Security and compliance
Ensure data security and compliance with data masking, monitoring, and change traceability
Ensure data security and compliance with data masking, monitoring, and change traceability
Monitor and understand your databases with full visibility into performance and change
Build, test, and deploy database changes with confidence
Simplify and speed up database development workflows
Prepare reliable data foundations for AI initiatives
Simplify and secure database modernization across platforms
Control costs and boost efficiency in database operations
Simplify and speed up cloud database transformation
StopWatch classDateTime.UtcNow isn't designed for high-precision timing and will often have a resolution over 10ms, making it unsuitable for measuring small periods of time. The StopWatch class is designed for this purpose, although beware of ending up with an entire codebase with StopWatch instrumentation.
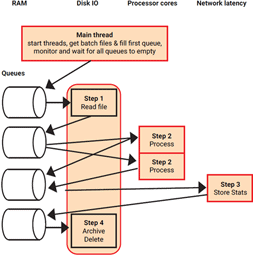
While Async-Await habits work well, an architectural pattern can switch into higher gears. When processing multiple small jobs, consider splitting job parts into resource-specific chunks. Then create separate threads for each resource, and place memory buffers in between. The goal is to fully utilize whatever resource is the bottleneck for .NET performance on any given machine.
In the diagram below, for example, an application has four steps.

It first reads a file from disk, does some processing on it, stores results in a database, and finally deletes the file. Each red box is a separate thread, and each vertical 'swim-lane' represents a particular resource. The process flows from top to bottom and uses queues as buffers between each resource-switch.
NullReferenceExceptions at runtimeExceptions can be slow and should only be used in exceptional circumstances, rather than for general control flow. Instead of assuming an object will not be null at runtime, utilize defensive coding to ensure your code only acts on objects that are not null. This will assist .NET performance by throwing fewer exceptions, and ensure a more robust and reliable application.
For example, consider the Tester-Doer pattern explained here: https://msdn.microsoft.com/en -us/library/vstudio/ms229009(v=vs.100).aspx
It's tempting to blame system code, third party libraries, or even the .NET framework itself when there's a .NET performance problem. But it's almost always the case that your application is misusing other people's code, so make sure you have really good evidence that a problem is elsewhere before blaming someone else.
Good .NET performance optimization projects need appropriate preparation in four key areas.
Create a test environment where you can reproduce consistent .NET performance behavior. Ideally, you want an automated test that shows equal .NET performance if you run it multiple times. Don't start optimizing without such a test environment.
Measure .NET performance KPIs before you change anything to serve as a benchmark. Compare the performance against the benchmark after changing the code. If the changes make the code faster, the new test results are your new benchmark. If not, undo the changes and continue to analyze with a .NET profiler tool like ANTS Performance Profiler.
Don't change too much at the same time. Make small changes, measure, and decide if you want to keep your change. If you make multiple changes, one change can make your code faster, while the other one might destroy the positive effects.
Never guess, measure! Get a .NET profiler tool like ANTS and use it to spot .NET performance bottlenecks. In many cases, performance killers are where you don't expect them. Avoid optimizing code just because you have the feeling that it does not perform well.
This is something that is said in many places but I want to repeat it once again because it's so important. Even using the limited .NET profiler tools in Visual Studio to analyze performance issues in your application will help. With an expert .NET profiler tool like ANTS Performance Profiler, you'll find out a lot more about the bottlenecks that are there – and be able to do a lot more, a lot faster.