How you can improve your SQL with code analysis in SQL Prompt
You could think of SQL Prompt code analysis as a machine-assisted code review. The rules that are used to check your code point out questionable areas that might be missed during regular testing.
Code analysis is a formal automated process of scanning a piece of software code and deducing potential problems, issues and faults that may not be apparent to programmers at first glance.
These could include mistakes that are easy to make for but hard to detect (such as copying and pasting something that is incorrect), the usage of obsolete elements in the code, or bad practices that, while technically correct, don’t produce the best or expected results.
The advantages of using code analysis include:
- Early detection of bugs and code smells in the development cycle, which means less time and money spent on fixing them.
- Discovery of problems in related or adjacent areas of code.
- Detection of anti-patterns and deprecated elements in code.
- Detection of security or performance issues.
- Use as a learning tool that shares knowledge across the team. This can be of particular value for more junior members and people new to SQL development.
- Identification of areas in the code that need to be refactored or simplified.
- Highlighting of areas of the code that may need more testing or a deeper review.
- Propagation of best practices and team standards, which ensures codebase consistency.
- Identification of potential software quality issues before the code moves to production.
Introducing code analysis in SQL Prompt 9
There is a distinct lack of code analysis tools in the SQL development world, despite their wide availability in other programming languages and environments (such as .Net, C/C++ and Java).
In June 2017 we acquired SQL Code Guard, with the aim of adding code analysis functionality to our existing tools. We’ve already added performance rules in Redgate Monitor, and now you can get fast and comprehensive code analysis in SQL Prompt as you type.
When you upgrade to SQL Prompt 9 you will start to see the new features in your SSMS or Visual Studio query window as you start typing.
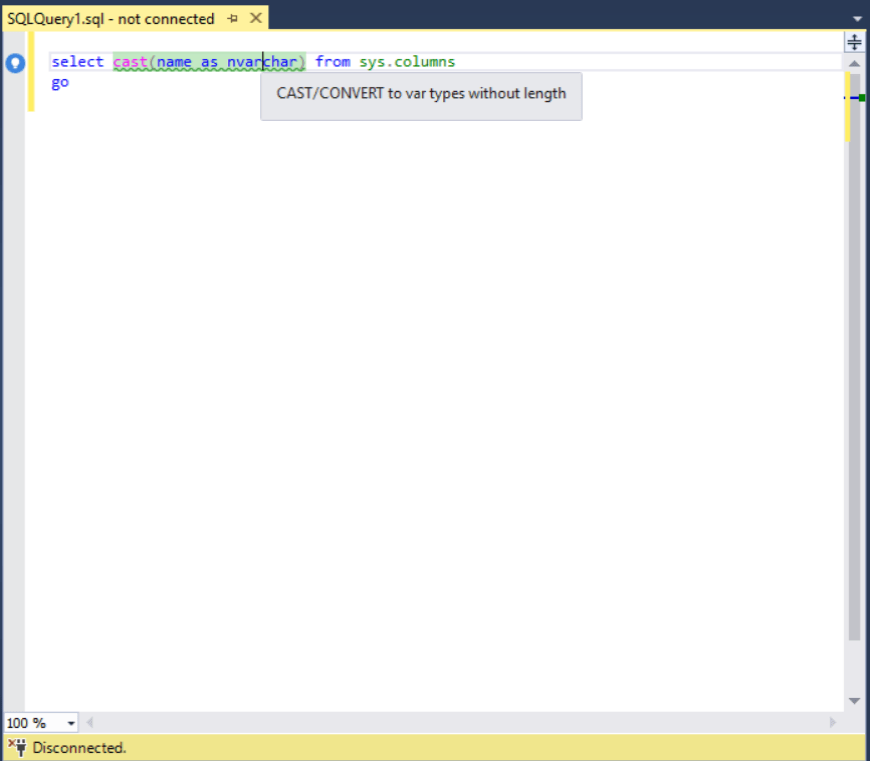
You will get a green wavy line under any parts of your script that have a code issue.
These can be selected by clicking on them, with a quick tip displayed when you hover your cursor over the issue:

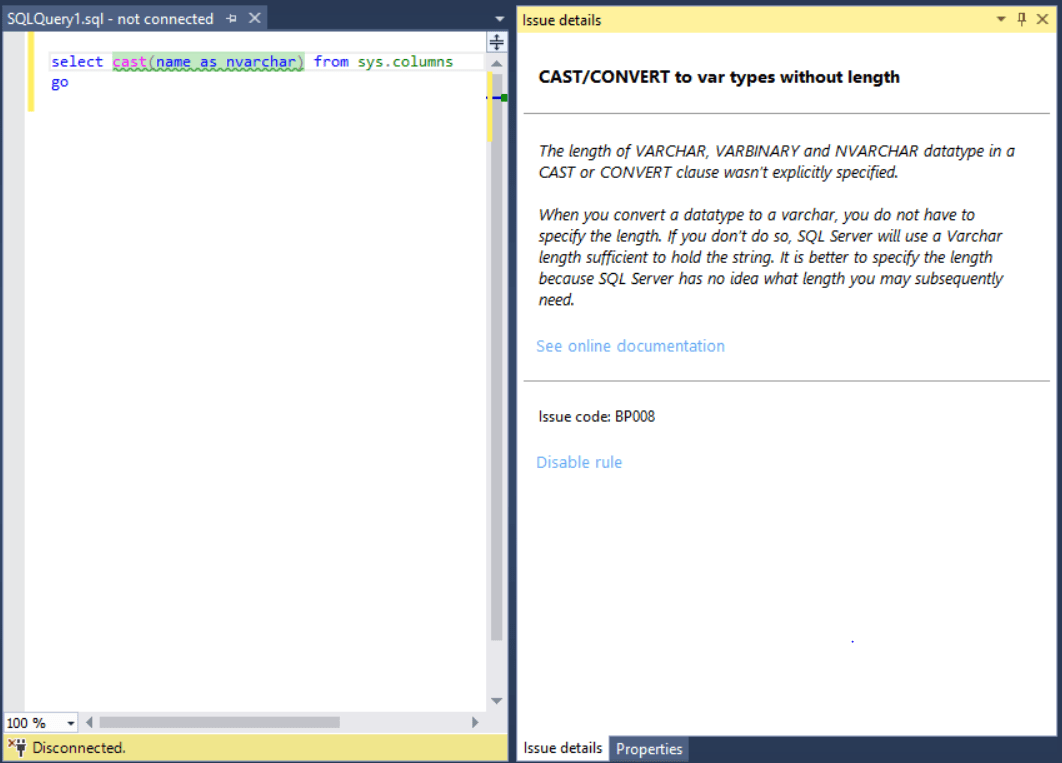
For a more detailed description of the issue, click on the blue lightbulb icon that appears to the left of the line you are on. This brings up the Issue details panel, which gives you more information on what the problem might be and how you can fix it.
The Issue details panel also contains a link to further online documentation, in the form of a library, that provides further reading and learning resources on code issues.

If you find this particular rule isn’t helpful or you don’t need it right now you can click on Disable rule to stop it displaying.
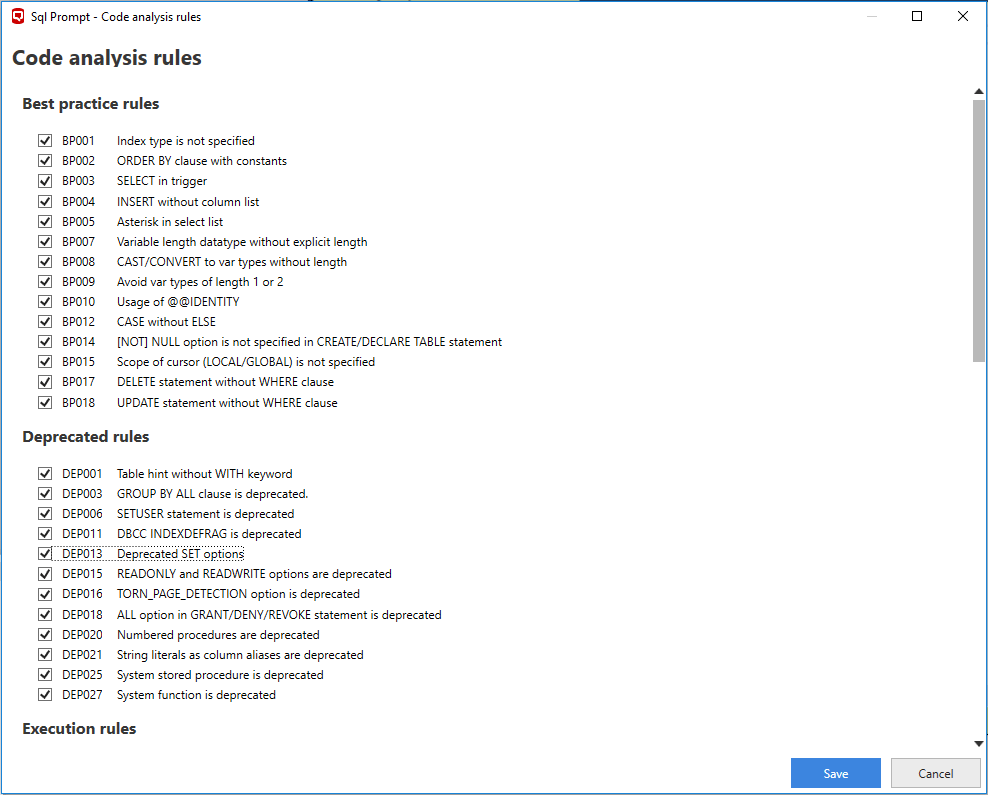
This can be done for individual suggestions as they appear, but a quicker way of managing your rules is through the Manage code analysis rules… options that can be found in the SQL Prompt menu.

From here you can turn rules on and off using the check boxes alongside them. The settings file for this can also be shared amongst your team, so you can all work with the same rules active, which can help with code consistency.
What’s next for code analysis in SQL Prompt?
We will continue to expand code analysis functionality in SQL Prompt by adding new rules until we have parity with SQL Code Guard.
We are also keen to hear about new rules you’d like added to SQL Prompt code analysis. Head over to UserVoice and add your suggestions for future releases.


