Tracking the number of active sessions on a database using Redgate Monitor
Phil Factor creates a simple custom metric to track the number of sessions that have recently done a read or write on a database. Having established a baseline for the metric, you'll be able to spot, and investigate the cause of, any wild deviations from normal behavior.
It’s surprisingly useful to know the number of active sessions on each of the databases on your servers. With a bit of SQL, we can create a custom metric to track how many sessions recently performed reads or writes on a database, such as in the last ten minutes. Once Redgate Monitor is attuned to the usual ebbs and flows in this figure, you’ll have a baseline for each database, and will be able to spot suspicious or unusual patterns of usage. At this point, there are plenty of ways in SQL to find out, in detail, which users are active, and what they are up to.
I’ve already discovered problems by tracking this metric, one where a process I thought was disabled had somehow restarted, and another where a database was showing no activity when it should have had some!
Who’s using your databases and what are they doing?
How many users are on your databases? Well, there could be just one user (login) doing one heck of a lot, using many sessions. This is especially true if you have a shared connection to the application under one User ID, so that there are many people or processes using one login name.
Ideally, this shouldn’t happen; each user should be using their unique Windows login, thereby enabling you to audit what is going on properly. The better your security, the more users you are likely to have in proportion to the sessions, because it means that users are not sharing logins.
Sadly, we don’t always live in an ideal world, especially in IT. We therefore need to track SPIDs and logins. Listing 1 shows a quick query to tell you how many sessions are being used by each login name on each database on a server. The string_agg function was introduced in SQL Server 2017. If you’re using an earlier version, the alternative is to use an XML concatenation technique (see Flyway Teams and the Problem of Database Variants for an example.
|
1 2 3 4 5 6 7 8 9 10 11 |
SELECT Db_Name(Database_id), String_Agg(Login_Name + ' (' + Convert(VARCHAR(8), No_Sessions) + ')', ', ') FROM ( SELECT database_id, login_name, Count(*) AS No_Sessions FROM sys.dm_exec_connections AS A INNER JOIN sys.dm_exec_sessions AS B ON A.session_id = B.session_id GROUP BY login_name, database_id ) AS f(Database_id, Login_Name, No_Sessions) GROUP BY Database_id; |
Listing 1
You also want to know the last SQL each session executed? Listing 2 will tell you.
|
1 2 3 4 5 6 7 8 9 |
SELECT A.session_id, Db_Name(database_id) AS [database], DateDiff(MINUTE, A.connect_time, GetDate()) AS [Connected (mins)], num_reads, num_writes, login_name, Text AS SQL FROM sys.dm_exec_connections AS A INNER JOIN sys.dm_exec_sessions AS B ON A.session_id = B.session_id INNER JOIN sys.sysprocesses AS s ON s.spid = A.session_id OUTER APPLY::fn_get_sql(sql_handle); |
Listing 2
This may be interesting, but first we want to find out what is a ‘usual’ number of active sessions for each of the databases, so that we can tell if the number of active sessions leaps, for any reason or suddenly drops to zero (never a good sign). Then, we can investigate further using queries such as those above.
Tracking the number of recently-active sessions
Redgate Monitor’s built-in User Connections metric gives us only instance-level data for the total number of connections, at any time. There is usually, but not always, a 1:1 relationship between connections and sessions. At the database level, the built-in Active Transactions metric gives us only currently running transactions; it will miss reads and will probably include lots of system transactions. Also, it’s just a point-in-time measure.
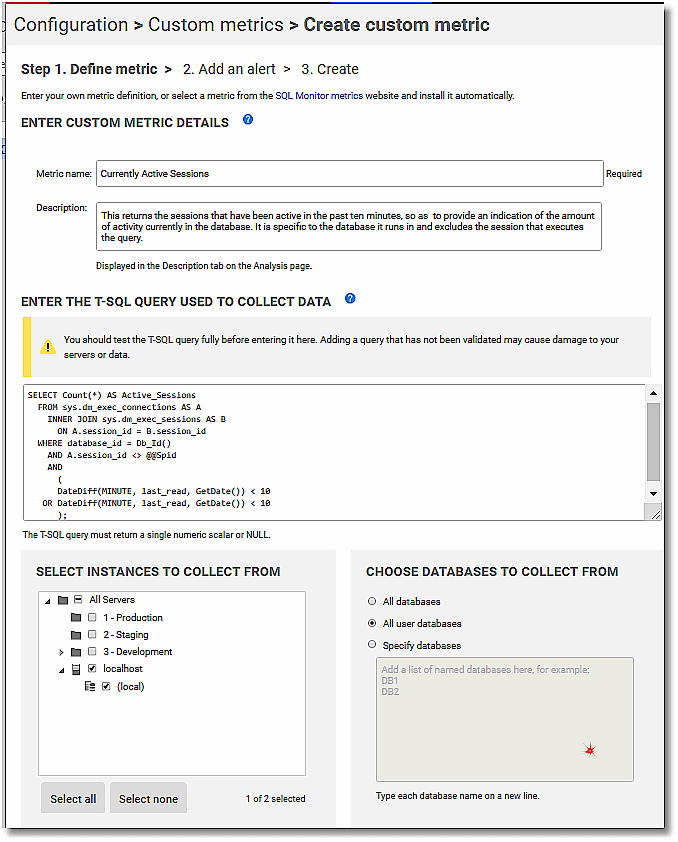
What we want instead is a database-level metric telling us how many sessions have been actively reading or writing over a recent period. Listing 3 shows a query that tells us the number of sessions that have done a read or write, on the connected database, in the past ten minutes.
|
1 2 3 4 5 6 7 8 9 10 11 |
SELECT Count(*) AS Active_Sessions FROM sys.dm_exec_connections AS A INNER JOIN sys.dm_exec_sessions AS B ON A.session_id = B.session_id WHERE database_id = Db_Id() AND A.session_id <> @@Spid AND ( DateDiff(MINUTE, last_read, GetDate()) < 10 OR DateDiff(MINUTE, last_write, GetDate()) < 10 ); |
Listing 3
Fairly simple, of course; it is easy to adapt it according to your own definition of ‘active’. How recent should a read or write be in order to be considered ‘recent’? Are you interested only in writes? It also has the necessary tweak of eliminating your own session (SPID) from the result. You don’t want to measure your own monitoring activity!
We now have something for a database that returns an integer, so it is very easy to use it to create a custom metric for Redgate Monitor.
Installing the custom metric
If you’re in Redgate Monitor then open the Configuration window, and click Custom metrics, and then click on the Create Custom Metric button. Now, we can fill in all the details for our Currently Active Sessions metric to track the number of sessions that performed reads or writes over the last 10 minutes. I collect this once every five minutes, because the query is a very light one, in terms of resources.

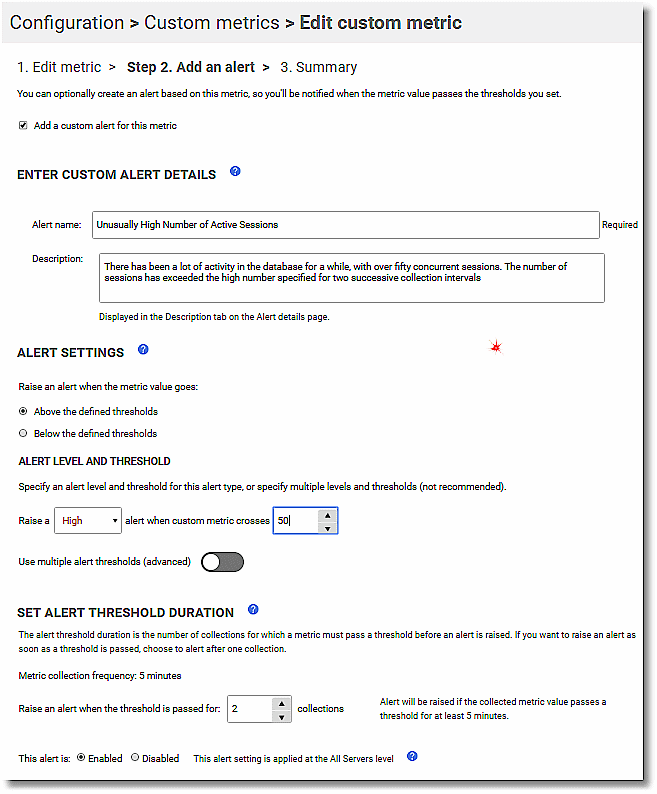
Once you’ve tracked the metric for a while, and understand the baseline for a database, you may also want to create an associated alert for any suspiciously high levels of activity, or conversely for any periods of zero activity.

The final screen merely confirms all the settings. Click OK and the metric and alert will be created and start tracking the data.
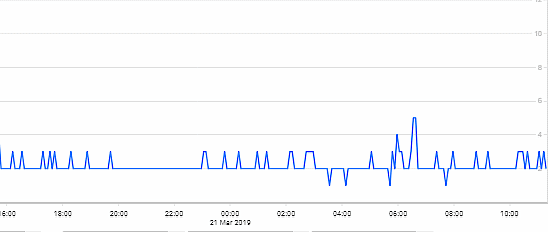
Here is the Analysis graph for the custom metric, monitoring a database on my server.

Summary
It is always reassuring to know how many users and sessions are in your databases, the identity of those users, and what they’ve been doing. The number of recently active sessions is a good example of a metric that needs a baseline to tell you if a measurement is reasonable or a sign of a problem. It’s also a metric that shows a problem too rarely to warrant constant human checks and is, therefore, ideal for Redgate Monitor.
Redgate Monitor thrives on being able to detect any unusual deviation from the normal in one or more metrics. Once you’ve been alerted to any suspicious or unusual patterns then, when you know what metrics are involved, you drill down to the detail using the rich undergrowth of DMVs, DMFs, and other diagnostic tools provided by the SQL Server product.
Tools in this post
Redgate Monitor
Real-time multi-platform performance monitoring, with alerts and diagnostics


