Is Tempdb Causing a Bottleneck?
One of your SQL Server instance shows a major dip in performance or throughput, affecting all the user databases. You notice that the slow interludes coincide, as if orchestrated. On investigation, it appears that several transactions running over that period were using a lot of space in tempdb. However, which of them, if any, are causing the tempdb bottleneck, and why?
Up until SQL Server 2016, tempdb was a common cause of bottlenecks, due to page allocation contention. While it’s rare for tempdb to cause bottlenecks in more recent versions, it can still, as a shared resource, be placed under stress and so become the source of performance problems, either through misuse, or having insufficient space or being in some other way wrongly configured for the workload.
After you’ve investigated the obvious configuration issues, you need to understand which users and processes are using a lot of space in tempdb, and why. In this article, we’ll be using Redgate Monitor and an extended event session to investigate potential problems with tempdb. From the information provided you’ll be able to verify quickly, or rule out, the old tempdb contention issue, as well as determine the ‘footprint’, or symptoms, of code that is a “tempdb hog”.
The ‘bad old days’ of tempdb contention
Prior to SQL Server 2016, tempdb often become a bottleneck due to “page allocation contention”. I explain the problem in Monitoring TempDB Contention using Extended Events and Redgate Monitor but, briefly, it is contention between processes trying to access the different types of allocation pages of a tempdb data file: a SGAM page that identifies and allocates extents that have free pages and a PFS page that identifies unallocated pages, and tracks which pages are allocated to which objects.
Any process that requests space in tempdb, will need to access these pages and, because there is only one each of these special allocation pages per data file, access to them could quickly become a ‘pinch point’, especially if processes on various databases were all running lots of concurrent queries that created, used, and then dropped small temporary objects in tempdb. The tell-tale sign of trouble was the appearance of a high volume of PAGELATCH_UP or PAGELATCH_EX waits, as competing threads were forced to wait for access to these in-memory allocation pages. In some cases, the blocking between competing threads trying to access these pages would become so severe that the database server became unresponsive, and throughput fell dramatically.
The underlying cause was, in effect, SQL Server’s poor, default tempdb configuration settings (creating only one modestly sized tempdb data file), plus “suboptimal” page allocation algorithms. Up to and including SQL Server 2014, these problems were ameliorated by:
- Creating multiple equally sized
tempdbdata files - Using trace flags to force SQL Server to grow all files to the same size at the same time (T1117) and to always allocates a full extent, as far as possible, for newly created tempdb objects (T1118).
- Reducing usage of
tempdb.
In SQL Server 2016 and later, rather than a single data file, tempdb gets a set number of files based on the number of logical processors that are detected on your machine. Also, the trace flags are now redundant as the behaviors they previously enforced are now the default. There were also many other fixes to improve round-robin allocation between tempdb allocation pages. See: TEMPDB – Files and Trace Flags and Updates, Oh My!
This has greatly reduced the size of the problem for more recent SQL Server versions, though it may still raise its head, depending on the workload, or if tempdb is still misconfigured for that workload.
There is also another less common form of tempdb metadata contention that is caused by competition for tempdb pages that belong to the system objects that SQL Server uses to track the temporary object’s metadata (see the above reference for details). This issue is not resolved by adding more tempdb files, as the system objects are one per database, not one per file.
The symptoms are very similar: you’ll see the PAGELATCH_XX wait type but this time the pages will belong to be one of the system objects such as sysobjvalues and sysseobjvalues. If you hit this issue then your options, aside from tuning code to optimize tempdb use to reduce the number and frequency of object creations, are:
- Use Memory-optimized table variables, in SQL Server 2016 or later
- Enable Memory-Optimized TempDB metadata, on SQL Server 2019 and later
Other causes of tempdb trouble
In the past, some perfectly sensible practices, involving use of temporary tables and table variables, were blamed for causing tempdb contention, when the problem was, in fact, the way that tempdb was configured on installation. Often the contorted CTEs and derived table sources that were used to avoid temporary tables were still using tempdb under the covers and had either the same query plan or performed worse.
Nowadays, contention for internal pages in tempdb should be far less of a concern, because tempdb is more optimally configured on installation, and developers can therefore feel a lot more relaxed about using temporary resources such as temporary tables and table variables.
However, good practices still need to be observed. Bad code can still cause other blocking and performance problems for tempdb just as it can for any database. If you load temporary tables with more data in them than is ever used, write iterative constructs in the code within which a table variable is created, used, and deleted, or use very “wide” table value parameters, to name just a few examples, you can cause a lot of stress on tempdb.
Remember that this ‘explicit’ use of tempdb occurs alongside ‘implicit’ or ‘internal’ use, where the optimizer chooses to use tempdb resources to resolve queries that involve ORDER BY clauses, GROUP BY clauses, or to store intermediate results for some types of joins, spooling operations, cursors, Window functions, table value functions, and so on. When databases are busy and all this tempdb activity collides, it can cause problems, and sometimes it is quite hard to pin down the culprit.
In short, it is still a good idea to keep an eye on tempdb usage, whatever the version of SQL Server. For the developer or tester, the frustration is one of not being able to ‘see’ the signs of stress. It isn’t enough to just follow ‘code smell’ guidelines, it is much better to be able to gauge the difference between good and bad code. We can use Redgate Monitor as a development tool to do just that.
Investigating tempdb usage in Redgate Monitor
By finding a reliable way of pinpointing the cause of a tempdb bottleneck, we can then check for sure whether the old contention issue I’ve described has now been ‘kicked into touch’, or become less of a problem, since SQL Server 2016.
To demonstrate, I’ll create a typical RBAR task that unnecessarily uses a nasty cursor. In the old days, this technique would have brought tempdb to its knees. This time, I’ll run the experiment on SQL Server 2017. I’ll stress out tempdb by running three threads that are either creating a lot of table variables, using a cursor on a large table, or updating the table. These processes all access a four-million row table of company names and addresses into an unindexed temporary table to simulate a row-by-row obfuscation process.
![]()
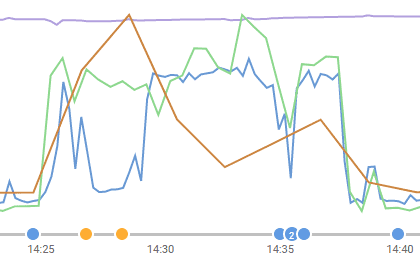
It isn’t a pretty sight, and you’ll see that waits sharply rise over a period in which the CPU is intermittently used. A quick look at the top ten waits graph shows that the most frequently occurring wait type was PAGEIOLATCH_SH, but that the preponderance of the wait time was due to waits to acquire locks (LCK_M_U).
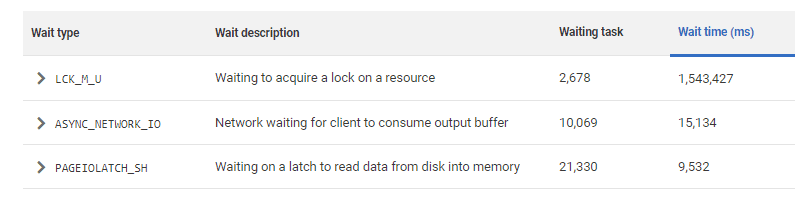
Essentially, we discover that a rogue query will still eventually cause problems but no longer causes that characteristic allocation contention (there are no significant PAGELATCH_xx waits on the list). You can click on any of the top ten waits in Redgate Monitor to see a list of the queries affected, but it shows the waiting victims of the sloppy code, not the code itself that caused the waits.
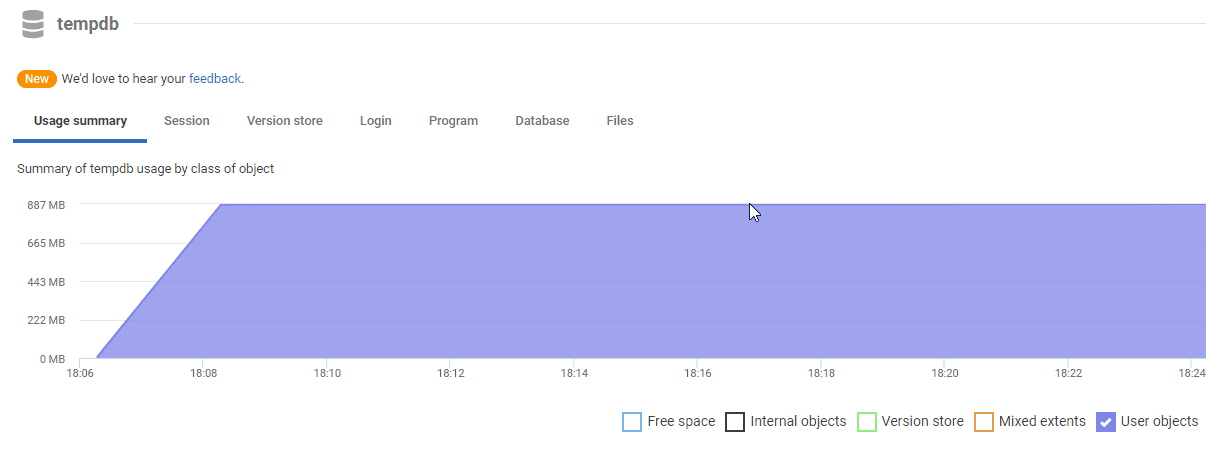
Lower down the Server Overview page you’ll find the tempdb usage summary graph, which will show you which processes were using space in tempdb over this period, and why.
The main graph shows how the tempdb space is being used. In this case, it is little surprise to the see that it is being used to support user objects, meaning temporary user-created objects such as temporary tables, table variables, or in this case, cursors.
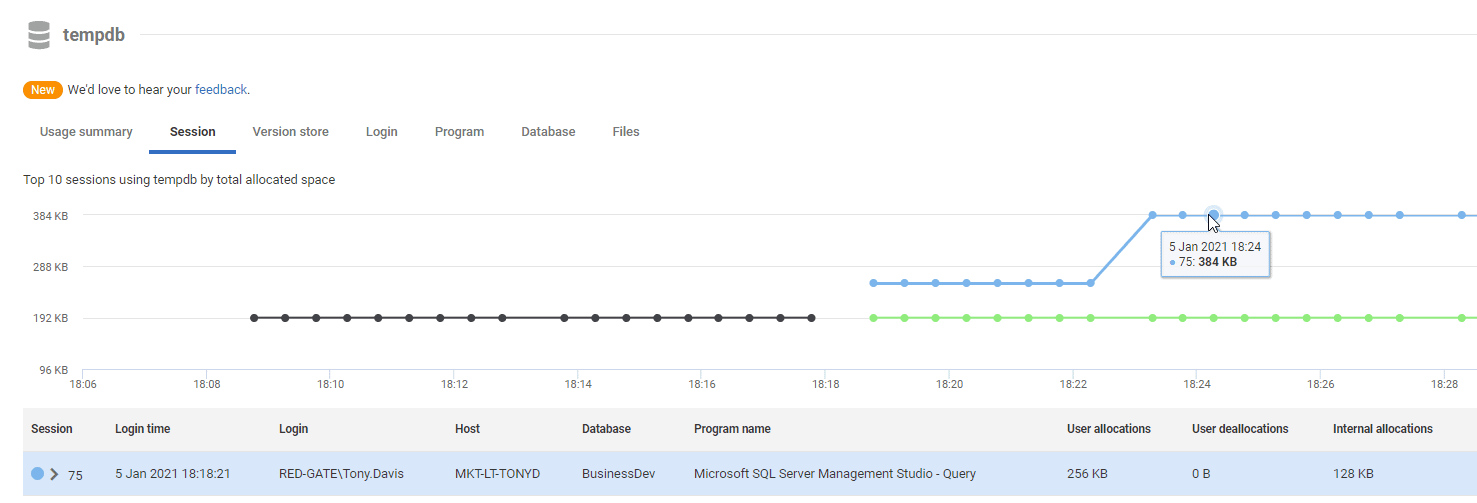
On the sessions tab, you can identify sessions, and individual queries, that are creating temp tables or variables (user allocations/deallocations) or spilling to tempdb for various reasons (internal allocations/deallocations). In this case, we can see several queries, and one (indicated by the blue line) that are using the space in tempdb.
The Login, Program and Databases and Files tabs further break down tempdb usage. accordingly. The Files tab is useful to investigate where each tempdb data file is being used evenly, as preferential filling of one file can lead to contention issues, as discussed previously. You’ll also find here some IO metrics, including IO Stalls. If you see significant stalls on any of the files, you’ll likely also be seeing significant waits.
For full details of the information you can find in each of the tabs, see the tempdb section of the Redgate Monitor documentation.
Drilling down into the Waits with Extended Events
Often, as in this case, you’ll now have all the information you need to spot the ‘rogue’ process that is misusing tempdb. At other times, it takes more detective work to decide which of the many processes using tempdb is causing what type of stress. In this case, you’ll want to gather corroborative evidence, taking a more detailed look at the most significant wait types recorded over the period, as this will tell you the resources for which processes were primarily waiting, which might be locks, latches, network, disk I/O waits or something else.
However, there are several problems. The first is that it is difficult, using even the more esoteric DMVs, to attribute waits in tempdb to a process that is causing them to happen, because these waits are ascribed to the databases from which the code is executed. The second difficulty was that one only wants to see the waits that would indicate problems. The third problem is that one only wants to know about waits that were excessive. To make matters worse, I encountered a problem where the DMVs that give accumulated figures for the waits actually ‘zeroed out’ and I started see negative accumulated wait times!
To see what is going on, you need to capture only the significant types of wait, and then only those that were longer than they should be. You also need to be able to examine these in detail along with the moment that they occurred, the session ID, database, and TSQL (if any). Extended events are the obvious way of doing all this in detail
To set up an extended events session, I used this code:
|
1 2 3 4 5 6 7 8 9 10 11 12 13 14 15 16 17 18 19 20 21 22 23 24 25 26 27 28 29 30 31 32 33 34 35 36 37 38 39 40 41 42 43 44 45 46 47 48 49 50 51 |
IF EXISTS --if the session already exists, then delete it. We are assuming you've changed something ( SELECT * FROM sys.server_event_sessions -- does our event exist? WHERE server_event_sessions.name = 'WaitHistogram' ) DROP EVENT SESSION WaitHistogram ON SERVER; --drop it if it exists GO CREATE EVENT SESSION [WaitHistogram] -- an event that gives you a summary of the significant events --and a detail report as well, with the SQL, session, database and plan handle. ON SERVER ADD EVENT sqlos.wait_info --get the wait info event (ACTION ( sqlserver.database_id, sqlserver.session_id, sqlserver.sql_text, sqlserver.plan_handle ) WHERE ( --we just check end events, more than 100ms, of the most significant waits. opcode = 1 --End Events Only AND duration > 80 -- had to accumulate 80ms of time --thanks for Glenn Berry and Jonathan Kehayias for this filter AND --the event filters have only a limited number of operators ((wait_type > 0 AND wait_type < 22) -- LCK_% waits OR (wait_type > 31 AND wait_type < 38) -- LATCH_% waits OR (wait_type > 47 AND wait_type < 54) -- PAGELATCH_% waits OR (wait_type > 63 AND wait_type < 70) -- PAGEIOLATCH_% waits OR (wait_type > 96 AND wait_type < 100) -- IO (Disk/Network) waits OR (wait_type = 107) -- RESOURCE_SEMAPHORE waits OR (wait_type = 113) -- SOS_WORKER waits OR (wait_type = 120) -- SOS_SCHEDULER_YIELD waits OR (wait_type = 178) -- WRITELOG waits OR (wait_type > 174 AND wait_type < 177) -- FCB_REPLICA_ waits OR (wait_type = 186) -- CMEMTHREAD waits OR (wait_type = 187) -- CXPACKET waits OR (wait_type = 207) -- TRACEWRITE waits OR (wait_type = 269) -- RESOURCE_SEMAPHORE_MUTEX waits OR (wait_type = 283) -- RESOURCE_SEMAPHORE_QUERY_COMPILE waits OR (wait_type = 284) -- RESOURCE_SEMAPHORE_SMALL_QUERY waits ) ) ) ADD TARGET package0.histogram --we will use a histogram filter just because it is a free lunch (SET filtering_event_name = N'sqlos.wait_info', slots = (64), source = N'wait_type', source_type = (0)), ADD TARGET package0.ring_buffer --this does most of the work but the histogram is more useful if we have a more generous filter WITH ( MAX_MEMORY = 4096KB, EVENT_RETENTION_MODE = ALLOW_SINGLE_EVENT_LOSS, MAX_DISPATCH_LATENCY = 30 SECONDS, MAX_EVENT_SIZE = 0KB, MEMORY_PARTITION_MODE = NONE, TRACK_CAUSALITY = OFF, STARTUP_STATE = OFF ); GO |
Naturally, there are plenty of knobs to twiddle with an Extended Events session like this. The built-in filter for Extended Events code is more limited than we’re used to with conventional SQL, but we have used a good filter list of the usual suspects from Glenn Berry and Jonathan Kehayias. You may want to change this filter. You may need to change the definition of what seems like a ‘significantly long’ wait, though this is likely to vary with the type of wait. You also may also need a more generously sized ring-buffer.
When we wish to start this session, we execute this:
|
1 2 |
--we make the 'on' switch separate so we can switch it on for a short session ALTER EVENT SESSION WaitHistogram ON SERVER STATE = START; |
We only stop the session after we’ve collected all the data because the data in the ring buffer is lost when the session stops. It is volatile.
I think that the SSMS ‘live data’ display for the XEvent is a useful way of inspecting the data, particularly when developing a session. We can also peep at the current tally of our significant waits whenever we need with this batch:
|
1 2 3 4 5 6 7 8 9 10 11 12 13 14 15 16 17 18 19 20 |
-- we read the XML into a variable first. The subsequent SQL is much quicker -- if we do so DECLARE @Target_Histogram_Data XML = ( SELECT TOP 1 Cast(xet.target_data AS XML) AS targetdata FROM sys.dm_xe_session_targets AS xet INNER JOIN sys.dm_xe_sessions AS xes ON xes.address = xet.event_session_address WHERE xes.name = 'WaitHistogram' AND xet.target_name = 'histogram' ); -- we can now list it out and put the right name to each wait type. This tells us -- how many times each type of wait happened SELECT Wait_count,map_key,Map_value FROM (SELECT the.event_data.value('(value)[1]', 'int') AS wait_type, the.event_data.value('(@count)[1]', 'int') AS wait_count FROM @Target_Histogram_Data.nodes('//HistogramTarget/Slot') AS the (event_data))f LEFT OUTER JOIN sys.dm_xe_map_values mv ON mv.map_key=f.wait_type AND mv.name='wait_types' |
This is little more than a status check. The next stage is to generate a result than can be placed into a table, indexed where necessary, and queried as required.
|
1 2 3 4 5 6 7 8 9 10 11 12 13 14 15 16 17 18 19 20 21 22 23 24 25 26 |
DECLARE @Target_Data XML = ( SELECT TOP 1 Cast(xet.target_data AS XML) AS targetdata FROM sys.dm_xe_session_targets AS xet INNER JOIN sys.dm_xe_sessions AS xes ON xes.address = xet.event_session_address WHERE xes.name = 'WaitHistogram' AND xet.target_name = 'ring_buffer' ); SELECT f.datetime_local, f.sql_text, f.Session_id, f.Plan_Handle, f.[database], f.wait_type, f.duration, f.signal_duration, f.Wait_Resource INTO #tf FROM ( SELECT Convert(datetime2, SwitchOffset(CONVERT(datetimeoffset,the.event_data.value('(@timestamp)[1]', 'datetime2')), DateName(TzOffset, SYSDATETIMEOFFSET()))) AS datetime_local, the.event_data.value('(action[@name="sql_text"]/value)[1]', 'nvarchar(max)') AS sql_text, the.event_data.value('(action[@name="session_id"]/value)[1]', 'int') AS Session_id, the.event_data.value('(action[@name="plan_handle"]/value)[1]', 'varbinary(64)') AS Plan_Handle, Db_Name(the.event_data.value('(action[@name="database_id"]/value)[1]', 'nvarchar(80)')) AS [database], the.event_data.value('(data[@name="wait_type"]/text)[1]', 'nvarchar(80)') AS [wait_type], the.event_data.value('(data[@name="duration"]/value)[1]', 'bigint') AS duration, the.event_data.value('(data[@name="signal_duration"]/value)[1]', 'bigint') AS signal_duration, the.event_data.value('(data[@name="wait_resource"]/value)[1]', 'nvarchar(80)') AS Wait_Resource FROM @Target_Data.nodes('//RingBufferTarget/event') AS the (event_data) )f |
The SQL Statement is made into a derived table source to make it easy to add filters such as:
|
1 |
WHERE f.[DATABASE]='tempdb' – or whatever database you're investigating |
….or aggregations such as:
|
1 2 |
GROUP BY Database_id, Wait_Type, Convert(Varchar(20),datetime_local,120) ORDER BY Database_id, Wait_Type, Convert(Varchar(20),datetime_local,120) |
However, it is likely to be more convenient to SELECT INTO a temporary table to do your transformations on the data, as I’ve done above. I’ll then use that table in the next section.
Results
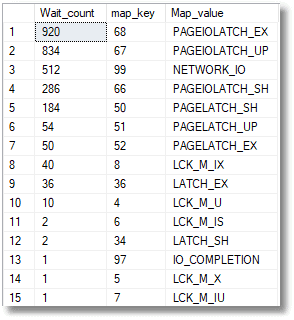
From the histogram we created, not the ring buffer, we can quickly see an aggregate giving the frequency counts of the ‘significant’ waits over 80 ms.
|
1 2 3 4 5 6 7 8 9 |
-- we can now list it out and put the right name to each wait type. This tells us -- how many times each type of wait happened SELECT Wait_count,map_key,Map_value FROM (SELECT the.event_data.value('(value)[1]', 'int') AS wait_type, the.event_data.value('(@count)[1]', 'int') AS wait_count FROM @Target_Histogram_Data.nodes('//HistogramTarget/Slot') AS the (event_data))f LEFT OUTER JOIN sys.dm_xe_map_values mv ON mv.map_key=f.wait_type AND mv.name='wait_types' |
We can, from the temporary table containing the data in the ring buffer, also see the session, database, and SQL text of the worst waits:
|
1 2 3 4 5 |
SELECT TOP 10 Convert(VARCHAR(20), datetime_local,113), sql_text, Session_id, [database], wait_type, duration FROM #tf –the saved table ORDER BY duration desc |
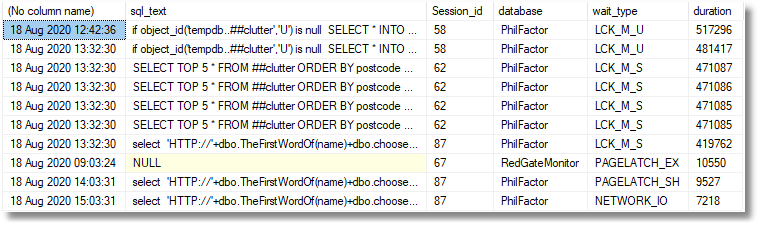
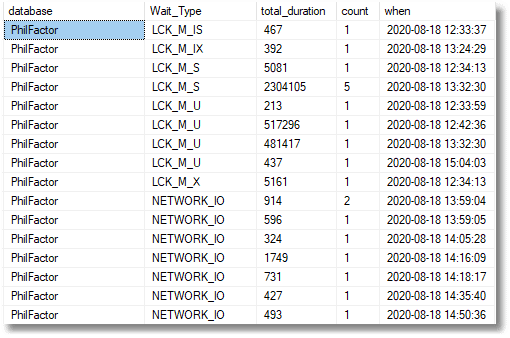
This allows us to see exactly where the waits happened and what session and code was involved. We can also watch trends over time for each wait type and database.
|
1 2 3 4 5 |
SELECT [database], Wait_Type, Sum(duration) AS total_duration, Count(*) AS count, Convert(Varchar(20),datetime_local,120) AS [when] FROM #tf GROUP BY [Database], Wait_Type, Convert(Varchar(20),datetime_local,120) ORDER BY [Database], Wait_Type, Convert(Varchar(20),datetime_local,120) |
And we can, of course, drill down to the actual timeline to spot the culprits, and see the SQL Code of the batches containing the queries that are causing the problem. Almost always, this is enough to shout ‘Aha’, and wander down the corridor looking for a particular developer.
|
1 2 3 4 5 6 7 |
SELECT datetime_local, sql_text, Session_id, [database], wait_type, duration FROM #tf --our temporary store for the extended event result. WHERE datetime_local BETWEEN '2020-08-18 13:20:30'--you need to provide the start time AND '2020-08-18 13:40:30' --and the end time AND [DATABASE] <> 'RedGateMonitor' ORDER BY datetime_local |
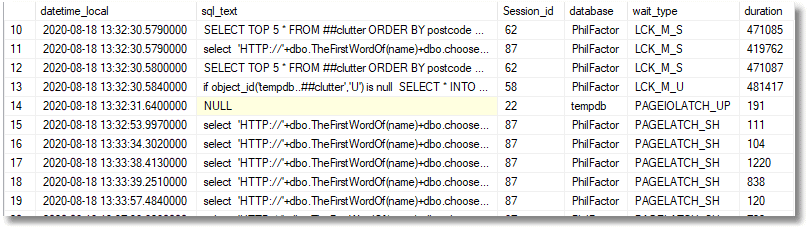
So here, we have finally achieved our aim. We now have the text of the start of the batches that caused the problems, at the time when they held up all the other ongoing processes that were trying to use tempdb at the time.
I think that the DMVs that report waits can only provide a measure of general information about stress. Redgate Monitor adds to this information a lot extra details about the dynamics of waits and is very valuable in showing baselines and trends. Sometimes though, it still helps to use Extended Events drill right down to the level of detail that shows you the queries, database, right alongside the significant wait types and the duration of each.
Regarding allocation bitmap contention, I think that the improvements since 2016 have made tempdb rather more resilient and this has meant that we are now more aware of other problems that will cause it stress problems. The test code I used above to cause the tempdb problems once used to almost switch the lights out. Extended Events would have shown an unusual number of PAGELATCH_UP and PAGELATCH_EX waits, indicating that SQL Server was experiencing contention when processes tried to allocate pages and were forced to wait before they can do so.
Now, there seems to be no single pattern of excessive waits that indicate tempdb stress. Our query shows that, although there were a lot of PAGEIOLATCH waits, it is the locking waits that seem to be causing the delays to other processes. Different troublesome queries are likely to show a different pattern of waits. The message, however, remains the same: the query needs to be re-written and tested against an Extended Events session to make sure it isn’t a resource-hog that kicks waits in the face of other tempdb users.
Conclusions
tempdb is like any shared resource. All the processes using temporary storage need to be good citizens, and it is impossible to avoid using tempdb. This means that frequently executed queries that use tempdb heavily must be optimized to be as efficient as possible. Realistically, it is best to devote precious time to the worst offenders, and by first using Redgate Monitor to work out when the stress happens, and then using Extended Events to investigate what is happening at those time intervals, it is then possible to see the waits and spot the victims and perpetrators of the delays.
There was a time that the practice of using temporary tables and table variables in frequently used code was frowned on by some experts because it was likely to cause allocation bitmap contention, Nowadays, tempdb seems to now be much better engineered for the sort of workload it must undertake: performance degradation is graceful. We no longer need feel guilty about using temporary resources such as temporary tables and table variables. Instead, we ought to look at other practices in code that are likely to lead to a batch being a bad neighbor.
Tools in this post
Redgate Monitor
Real-time multi-platform performance monitoring, with alerts and diagnostics
You may also like
-

Article
An Overview of PostgreSQL Monitoring in Redgate Monitor
An overview of how PostgreSQL monitoring in Redgate Monitor will help you improve performance and reduce downtime in your PostgreSQL instances.
-
Article
Database monitoring in Financial Services: why this high-stakes sector requires a scalable, more comprehensive solution
IT and data teams in Financial Services must meet the more exacting demands for data integrity, compliance, performance, high availability and security that are expected in the sector. These demands require a dedicated, comprehensive, and scalable monitoring solution to help teams succeed in this high stakes environment.
-

Article
How Redgate’s Foundry is Shaping the Future of Database Innovation with AI
Learn how Redgate’s Foundry drives AI innovation in database management - from intelligent monitoring and ML-based automation, to smarter SQL optimization.
-
Article
Understanding PostgreSQL's Cache Hit Ratio
This article explores PostgreSQL's buffer cache hit ratio (BCHR), a metric tracked by Redgate Monitor to help you assess the health and performance of your databases. By correctly interpreting this ratio and using it with other relevant memory and IO metrics, you can identify potential bottlenecks in query execution before they impact users.
-

Live training session
Level up your database insights | Identify and diagnose the impact of your deployments with SQL Monitor
In this 30-minute training session, Redgate Solutions Engineer David Ong will show how you can build insights and understand your server performance in an instant with fast deep-dive analysis using SQL Monitor.