Troubleshooting SQL Server Queries using Actual Execution Plans
For SQL Server 2019 onwards, Redgate Monitor can now show the actual execution plan, complete with runtime statistics, for expensive queries that were running over any period of investigation. This means you'll not only know how SQL Server executed your poorly performing query but also see accurate runtime data. Any big discrepancies between estimated and actual row counts will be revealed, and Redgate Monitor will highlight any warnings and offer recommendations.
Inefficient queries can make your application much slower than it needs to be, which can be very frustrating for you and your users, especially if the inefficiencies could have been avoided. Whether you’re investigating a performance issue, or proactively tuning performance, often you need to find the reason a query is having problems, to be able to fix it, and query plans make this transparent, removing the need for guesswork.
Query plans, and the actual plans in particular, are an essential tool to gain insight into how exactly a query is run, and Redgate Monitor works with SQL Server to surface the plans not only for the current run, but also for historical execution of queries. This means that when you have a report of performance issues from a day ago, or that happens intermittently, through Redgate Monitor you have an option to view what was actually happening in SQL Server at the time the query ran. This helps make the core issue easier to find and easier to solve, which in turn makes for faster performance improvements and happier users.
What are query execution plans?
At the point in an investigation where you’ve located a ‘problem’ query, which is hogging resources and causing slow response times, you’ll then need to work out exactly why it is running slow. However, it might not be obvious, just from looking at the query text, why this query is behaving the way it is or why it suddenly started performing badly, especially for larger queries. We also need to know what SQL Server did to execute that query. This is what the execution plan shows us. When SQL Server receives a new query, the SQL Server Query Optimizer constructs a query plan, which includes all the steps and operations that need to be performed to run the query to its completion and return the required data.
The query optimizer assesses many possible plans and selects the one that it estimates will have the lowest cost. These cost estimations are based on what it knows about the SQL, the structure of the tables, indexes and constraints, and on its statistics regarding the data in your tables. It saves its selected plan in the plan cache and passes it on for use in query execution. This plan is often referred to as the estimated plan, just because it is selected by the optimizer based on estimated row counts and costs i.e., it doesn’t contain any runtime information.
When the execution engine uses the optimizer’s plan to execute a query, it saves some runtime execution statistics for that query. When we request the actual execution plan, it is the same plan the optimizer selected but with these added runtime statistics, such as the actual number of rows returned (rather than just estimated number of rows).
Viewing execution plans in Redgate Monitor
It’s possible to view the execution plan for a query simply by executing it manually in SSMS. However, the big advantage of viewing the plan using a tool like Redgate Monitor is that it automatically retrieves the plans for you, for any expensive queries that ran within the time window you are investigating, so you can see exactly what plan was used for any historical execution of a query, within the context of what activity was happening on the server at that time.
On the Overview page, in Redgate Monitor, you can move the focus window to the required period of investigation, perhaps to when a performance problem was reported earlier in the day and see the Top queries that were running over that period. If you click on any query in the list, you will see the query details, which will include the text of the query, and its execution plan, alongside other information. You can view the plan in-situ or download it and reopen it in your favorite execution plan viewer.
For any version of SQL Server, Redgate Monitor will show you the estimated execution plan for any of the top queries, which it retrieves from the plan cache. For any monitored instance running SQL Server 2019 and later, if you’ve enabled a new database scoped configuration LAST_QUERY_PLAN_STATS, it can also show the actual execution plan (see later for more details on this).
What’s the added value of seeing the actual plan? Let’s find out by first viewing the estimated plan for a query, in Redgate Monitor, followed by the actual plan.
Viewing the estimated plan
Here is the estimated execution plan for one of the top queries, which was executed on a database called PizzaParadise:
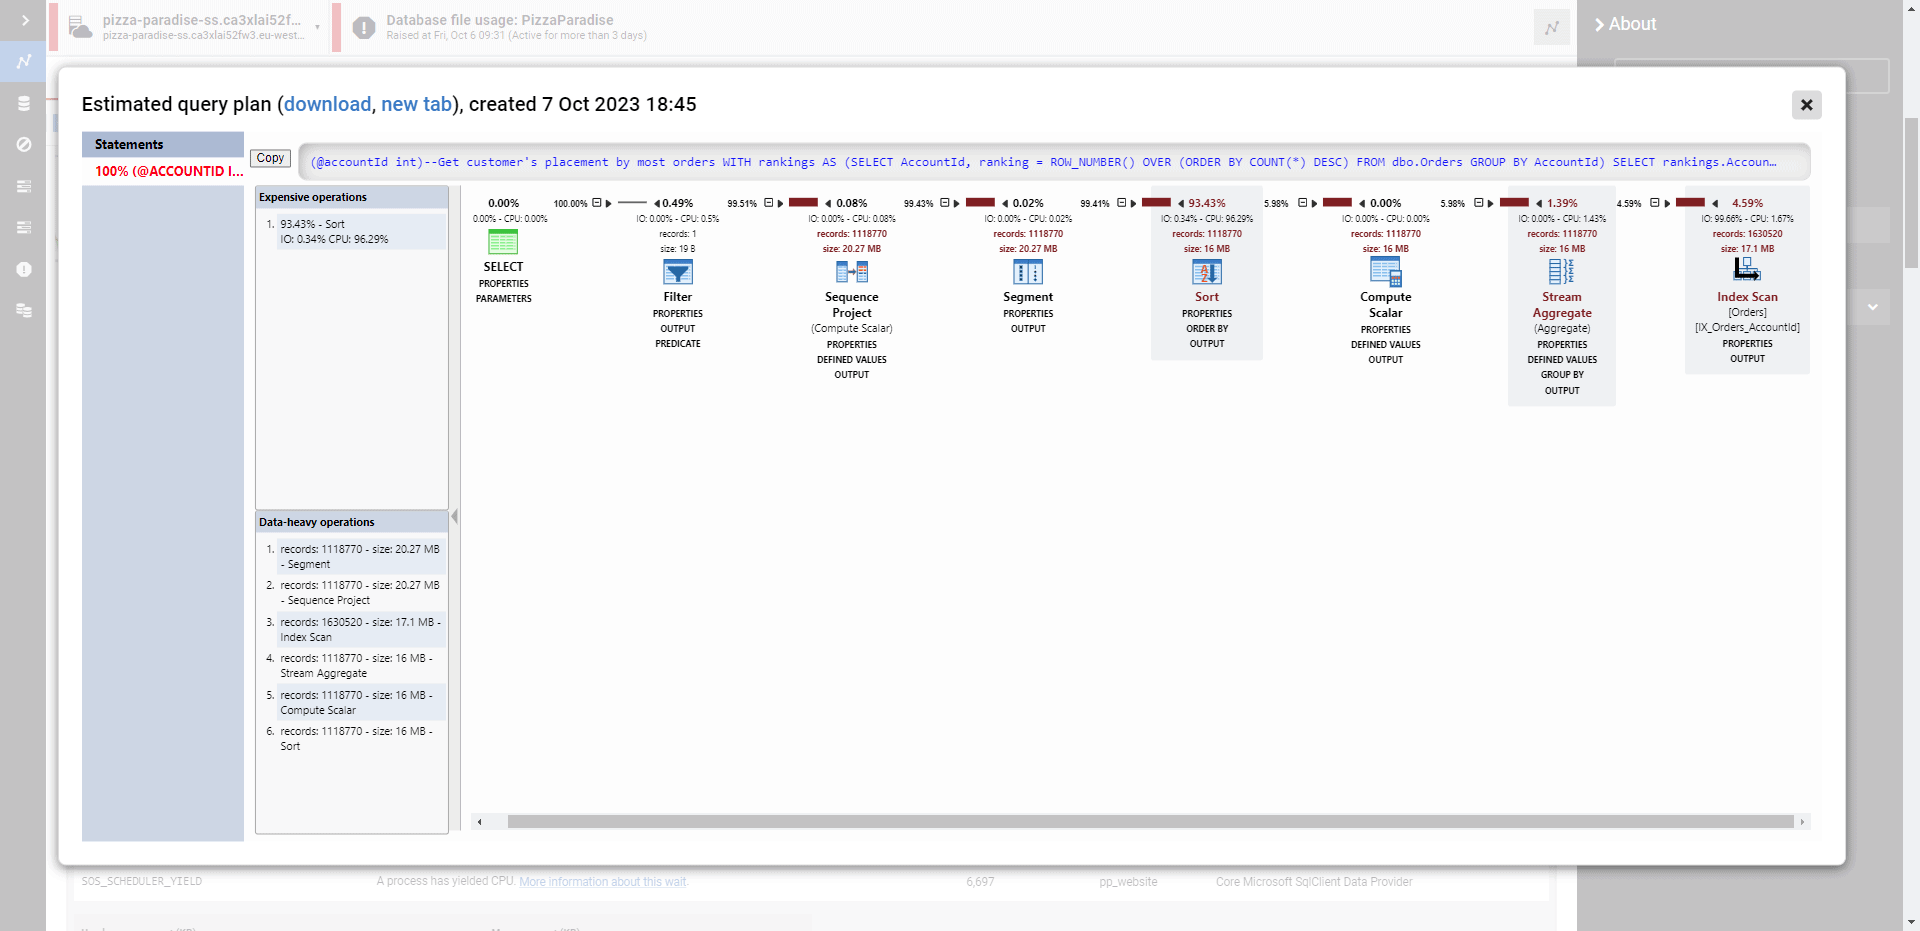
Having a breakdown of each operator in the plan for this query, and its estimated cost, is a great help because it indicates how resources are being used, at each part of the query, and so lets us know which part exactly is likely causing the problem. Above each operator we see two important pieces of information: its estimated percentage cost and the estimated number of rows it will return. Based on how many rows the optimizer thinks each operator in the plan will have to process, it estimates the cost of that operator (estimated CPU and IO processing cost, combined), relative to the cost of the plan. The cost estimates therefore indicate the operators that the optimizer estimates will use the most resources.
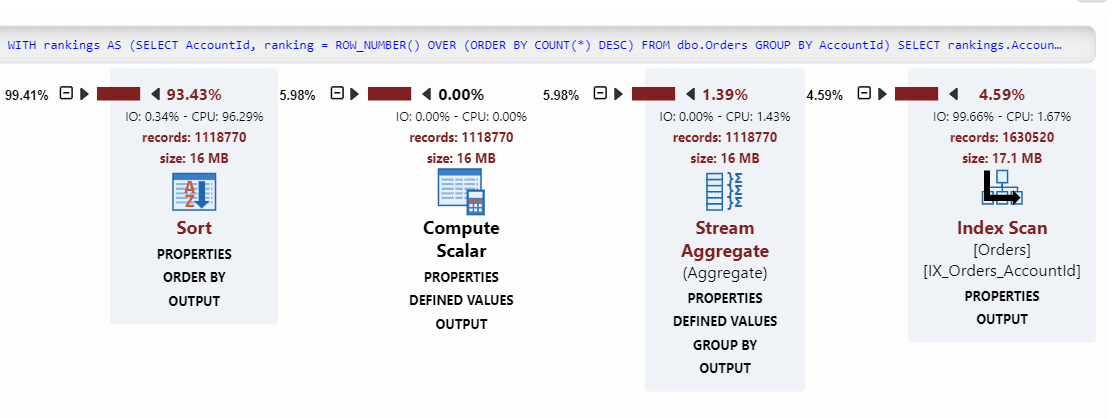
If we zoom in on a section of the plan, we can see more clearly which tables were accessed and how the data was processed. In this case, an index scan retrieved over 1.6 million rows in the Orders table, and then aggregation, computation and then sorting and sequencing were performed before finally returning a single row result of the customer’s sales rank. In amongst the “data heavy” operations, the optimizer estimates the Sort operator will account for over 93 percent of the resources allocated to this query:
So, once you’ve identified the query you need to improve, the percentages of estimated cost for each operator makes it easier to spot where the meat of the computational load is spent, and to troubleshoot if anything is unexpected or can be improved. If you are investigating a particular query’s performance problems, this is the first place you might look. Which operators are expected to eat up the resources in this query? Are they what you expected them to be? Is there a not-really-needed type conversion that is sneakily eating away resources?
Of course, all this assumes that the optimizer’s predictions of how much data would be returned, and therefore how best to process it, were accurate. Usually they are, especially in well-designed and maintained databases. However, if its predictions were wrong, then its cost estimates will be wrong. If optimizer expects a query to have x rows of results, it generates the best plan for this expectation. If, on executing the query using this plan, 100x more are returned than was estimated, then the selected plan will not be optimal and, it is likely to cause performance issues that a different plan could have avoided.
This is why it is always useful to be able to verify the cost estimates in the optimizer’s plan by viewing the runtime statistics in the actual plan once it’s executed.
The added value of viewing the actual plan
Most people view the actual plan by re-running the query manually through SSMS, enabling the capture of the Actual Execution Plan. While this is a useful functionality, it of course requires you to re-run the query manually, and you can only capture what has happened in this latest run.
From version 2019 (CTP 2.4 and greater) onwards, SQL Server keeps the latest version of the actual plan, per query, in a separate area of memory. You can retrieve the last actual plan for a query from sys.dm_exec_query_plan_stats. However, you still have no way of retroactively looking into the past to see what might have gone wrong in the runs from, say, a day ago, when the server was reported to have a performance issue. Fortunately, Redgate Monitor captures the actual plan, at intervals, to expose it retroactively. This enables you to look at a time window from the past, to view the actual plans collected over time.
This means that if you’re monitoring instances running SQL Server 2019 or later, Redgate Monitor can present two copies of the same execution plan, for a query: the ‘estimated plan’ that we just saw, and then another copy (the actual plan) with runtime statistics, injected by the execution engine once the plan was used to execute the query. Here is the actual execution plan for the same query on the PizzaParadise database that we saw earlier:
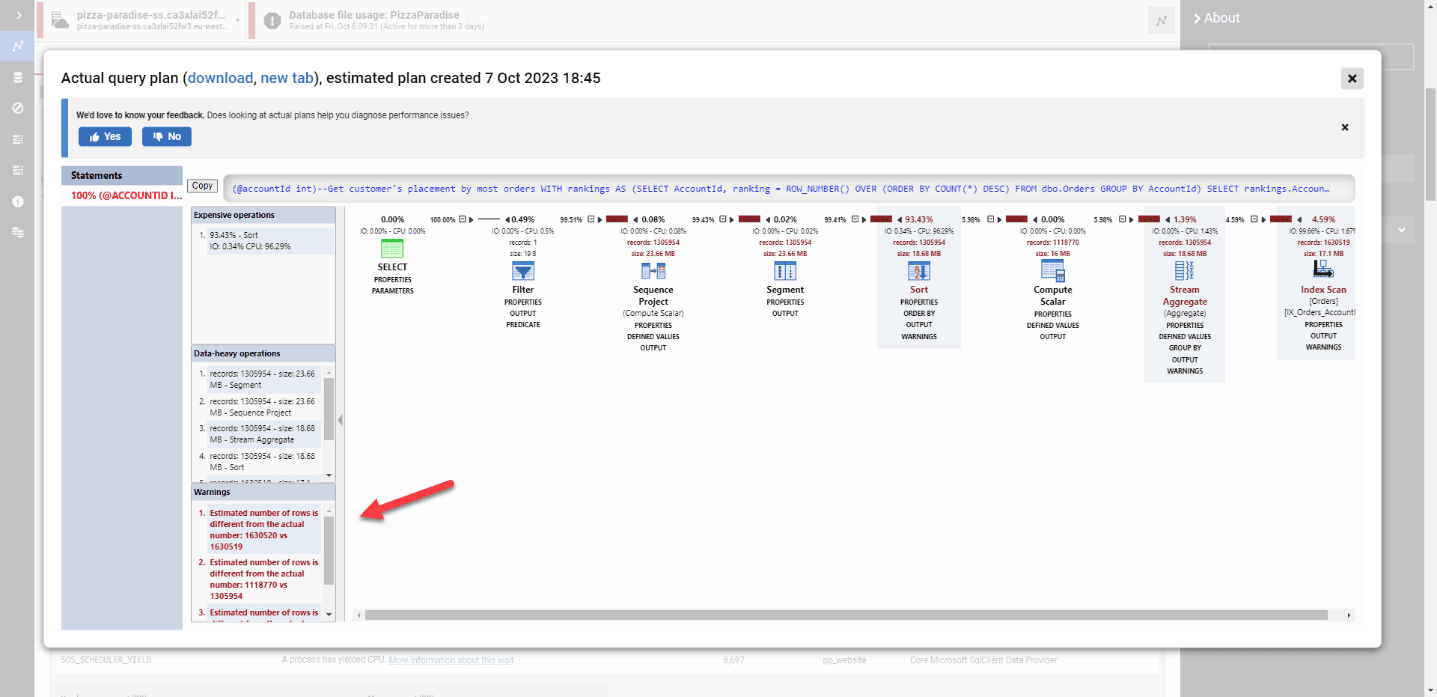
In left hand pane of the actual plan, you can now see some runtime execution warnings:
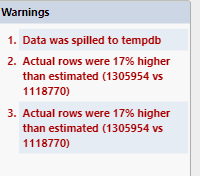
In this case, it tells us that the optimizer underestimated the number of rows that the Stream Aggregate operator would return (warning 2), and therefore also the number of rows that the Sort operator would need to process (warning 3). This led to an under allocation of memory for the sort operation, which subsequently spilled to tempdb on disk (warning 1).
One reason for this might be that the optimizer’s statistics are inaccurate, or out of date, perhaps because the data changed significantly but the index and column statistics, in this case on the AccountID column, have not yet been updated to reflect this. This meant that it did not accurately know the distribution of orders across accounts and so underestimated the number of rows that would be returned by the aggregation.
In general, there are several common causes of these “misestimations”. For example, a common one when executing stored procedures is that the optimizer uses a sniffed parameter value that returns very few rows, and so selects a plan optimized for that, whereas most other values return thousands (or vice versa) and therefore most executions of the query will be using a sub-optimal plan. This can lead to ‘erratic’ performance where a query performs terribly one day but fine the next (after a plan recompilation, for example).
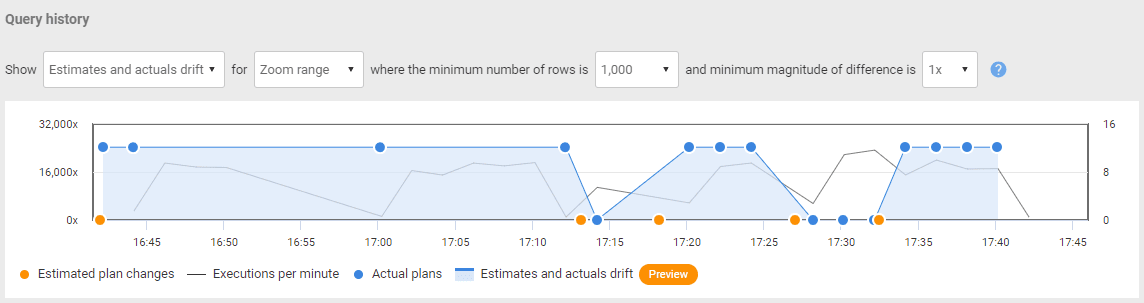
Redgate Monitor Query History: see actual vs estimated rows over time
For each query under the Top Queries tab, given that the query has a non-trivial plan, Redgate Monitor reads through the actual plan to find the operator estimated to be the most expensive within the plan, gets the magnitude of difference between estimated and actual rows, and graphs this over time for the specified time window. Presented together with the estimated plans, this enables you to both see the estimated plan changes, and the performance of the actual plans changing depending on the plan change. You can then hover over individual plans to see this difference, and the expensive operation in question, or click on the dot to navigate to that specific plan.
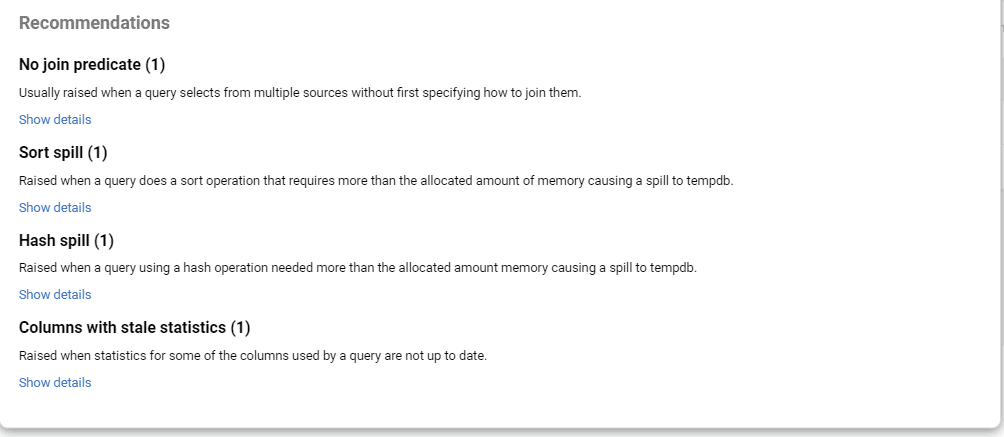
Query recommendations based on runtime warnings
As we saw earlier, SQL Server uses the runtime information available in actual execution plans to generate specific warnings gleaned from runtime issues – like too little or too much memory being granted for an operation, in-memory data having to spill to tempdb, or operators that must wait before being granted enough memory. Redgate Monitor collects these warnings and exposes them through the Recommendations feature, which you can find under Query Details in Top Queries, where you can see the recommendations extracted from the latest plan in a specific time window.
How to enable actual plan collection in Redgate Monitor
Exposure of actual plans is an opt-in feature from SQL Server version 2019 (CTP 2.4 and greater) onwards. To enable this on database level you need to enable a new database scoped configuration LAST_QUERY_PLAN_STATS, or, if you like, you can turn it on at the server level using the trace flag 2451. For anyone worried about the additional load this might bring to their server, Microsoft states in their documentation that this functionality works under the lightweight query execution statistics profiling infrastructure. This functionality lets SQL Server keep the latest actual plan, per plan handle, in memory, which gets overridden by newer runs. This is where Redgate Monitor comes in to capture the actual plan at any given point in time, to enable them to be viewable retroactively.
Bottom line
It’s not always easy to work out what exactly is causing resource contention and slow response times. Query plans, especially actual plans, can eliminate the need for guesswork when identifying the root cause of a query having performance issues. Redgate Monitor gives you access to historical performance data, allowing you to review past runs and diagnose intermittent problems, and by leveraging query plans, you can identify and resolve performance issues quicker, resulting in faster improvements and greater user satisfaction. This makes them an essential tool in performance tuning.
Tools in this post
Redgate Monitor
Real-time multi-platform performance monitoring, with alerts and diagnostics
You may also like
-

Article
Monitoring SQL Server with Splunk and Redgate Monitor
Splunk is a search engine for collecting and analyzing all sorts of "machine data", including log data and metrics for SQL Server. Redgate Monitor gives you the detailed diagnostic view of all your SQL Server instances, and databases. If you have Splunk to monitor your applications and server infrastructure, and Redgate Monitor to help you understand the behavior of a complex database system such as SQL Server, then you have a powerful and capable monitoring tool set.
-

Webinar
What’s new in Redgate Monitor: Database Security Monitoring and Auditing Capabilities
Join us for an introduction to Redgate Monitor’s brand-new database security monitoring and auditing capabilities, designed to strengthen your data protection and compliance strategy.
-
Webinar
Tipps und Tricks zum Datenbank-Monitoring
Sowohl erfahrene Datenbankadministratoren als auch Neueinsteiger erhalten in dieser Session das Wissen und die Werkzeuge, um die Abfrageperformance zu verbessern und die Datenbankeffizienz proaktiv zu gewährleisten. Das ist Ihre Gelegenheit, wertvolle Einblicke zu gewinnen und Ihre Methoden zum Monitoring von Datenbankabfragen zu optimieren.
-
Article
VMware Monitoring in Redgate Monitor
Jon Hayman reviews how the metrics available in Redgate Monitor can help you diagnose problems that might come from SQL Server running in a virtual environment.
-
Article
Checking for Database Drift using Extended Events and Redgate Monitor
Phil Factor uses Extended Events and a Redgate Monitor custom metric to detect when the metadata of a database has 'drifted', meaning that a database object has been created, deleted or modified outside of the official change management process.