Top Query Search in Redgate Monitor
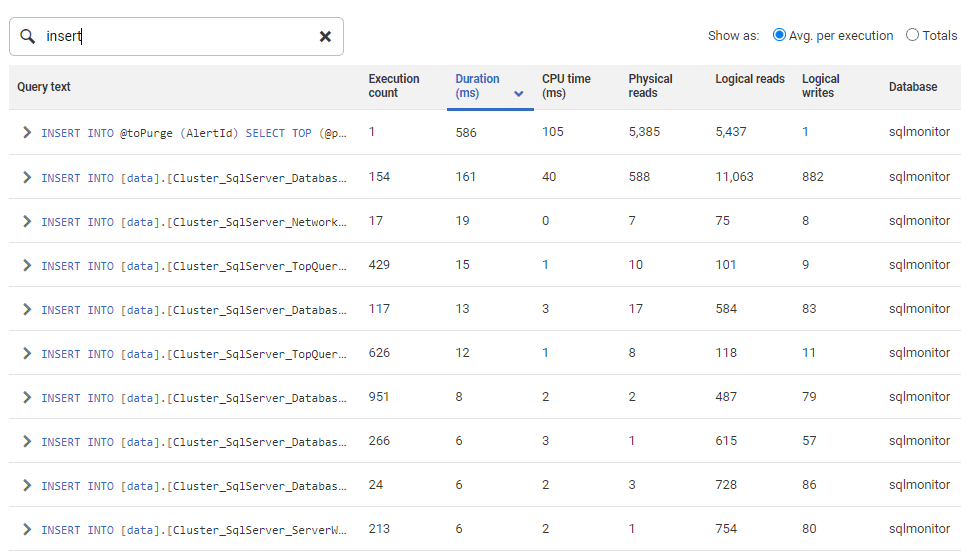
Redgate Monitor v12.0 has added a new Query Text Search feature to allow users to search the text of the most expensive queries that executed on a SQL Server instance over a period. Here's what it does, and how it works.
What is Query Text Search?
Redgate Monitor keeps track of what queries are being run by regularly sampling SQL Server’s “query summary” DMV, sys.dm_exec_query_stats, and persisting the query execution statistics to its repository. It presents this information in the top 10 queries table. By default, the list is populated by Duration (ms), meaning that the query with the longest average duration per execution is listed first. Redgate Monitor doesn’t store every single query that is run on a particular instance, only those that exceed certain minimum threshold levels.
If you’re trying to identify which queries are the biggest culprits in a system that’s experiencing generalized performance problems, then the top queries list is a good place to start, since it identifies all the most ‘expensive’ user and system queries that ran on the instance, over the period. However, without a search facility, it was often harder to locate a specific query in the list, if it was not one of the longest running queries during that period.
You often needed to expand the list to display the top 50 queries instead of just the top 10. You might also have needed to restrict the time range to a narrow window around when the query ran. For example, a query that ranked 42nd by physical reads at 2:12 pm and was never seen again would be unlikely to make the top 50 when considered over a 24-hour interval. Finally, you could try reordering the table by different columns, to find it. This repopulates and reorders the list each time, according to the selected metric such as CPU time or Logical reads.
Redgate Monitor v12 now allows you to search the text of top queries. It will return any matching query that was in the top 50 queries at any sampling point in the interval being examined, according to any of the available metrics. So even though our 2.12 pm query isn’t in the top queries list, Redgate Monitor has sampled it and stored it, so a search will find it. It should be make it much easier to find a particular query, or to find all queries referencing a particular table or view or calling a particular function, for example.

How Query Text Search Works
Redgate Monitor uses Lucene.NET to index query text. Lucene indexes data in the file system and searches those files when you perform a search. We considered using SQL Server’s inbuilt Full Text Search functionality but had concerns about performance, and the fact that data would be stored in the repository. We also considered using ElasticSearch or Solr, but either of these would have required the installation of an external service.
Lucene splits the text of the query into individual words, and we index top queries as they’re sampled, so this relatively intensive operation is carried out up front. Retrieving the sampled query is then fast. To limit the size of the files and avoid duplicating information, we chose not to store the full text of the query in Lucene; instead, we store just an ID that we can use to extract it, and any other information about the query, from our repository.
Special character searches
Lucene offers several search modes that require special characters. For instance, it supports wildcard searches for one (?) or more (*) characters, and ~ can be used to perform a fuzzy search, returning similar words as well as the exact search term.
Arguably some of these modes are more useful for natural language search than for searching for a T-SQL query, and perhaps the most common use case would be where the user already knows the exact query they want to find. In this case, they’d want to simply copy in a substring of the original query, and not bother with escaping any special characters (such as square brackets). In the end, we kept wildcard search, which might be useful for certain cases, such as when searching for tables using a common naming convention but opted to strip out other special characters from both the indexed query and the search term.
Summary
The ability to search the top queries by text should give users much easier access to those queries that Redgate Monitor is already sampling but were previously hard to find, and so improve Redgate Monitor’s utility as a performance tuning tool, as well as monitoring tool.
Try out the feature in Redgate Monitor v12 and let us know what you think. If you’ve suggestions for improvements, you can get in touch via User Voice.
Tools in this post
Redgate Monitor
Real-time multi-platform performance monitoring, with alerts and diagnostics


