Six Things to Monitor with PostgreSQL
This article describes six performance metrics that ought to be central to your PostgreSQL monitoring strategy. By using a tool like SQL Monitor to track these metrics over time, and establish baselines for them, you'll be able to spot resource pressure or performance issues immediately, quickly diagnose the cause, and prevent them becoming problems that affect users.
PostgreSQL continues to grow in both market share and overall developer popularity. Due in part to its very liberal open-source license, 25+ years of technology foundation, and unprecedented extension capabilities, it’s easy to see why so many developers and enterprises are choosing PostgreSQL.
For some DBAs that have deep experience in another platform like SQL Server, knowing how to monitor the database for peak performance can be challenging at first. Owed to the open-source nature of the product, proactive monitoring is not yet a solved problem in the PostgreSQL ecosystem. PostgreSQL has many metrics that can provide insights into the current status of the database or server, but automated, consistent monitoring is not built into the core open-source product.
To get the most out of the platform, it’s essential to have tools that can easily acquire these metrics and help you make sense of the numbers both now and over time. SQL Monitor collects a comprehensive set of these metrics for PostgreSQL, designed to help you identify and diagnose all the common causes of performance or maintenance issues in PostgreSQL databases. In this article, we’ll discuss six of these PostgreSQL metrics that should be monitored closely at the server and database level to ensure their smooth running and show you how SQL Monitor is ready to help in the journey.
Understanding Query Performance
There’s nothing worse than having an application query run slowly but not being able to figure out why. Some databases have features that help you identify why query performance changed over time for individual queries (for example, the Query Store feature in SQL Server).
PostgreSQL, on the other hand, does not yet have integrated processes or components that automatically do this for you. Although many of the necessary metrics exist and are maintained in all supported versions of PostgreSQL, it is still incumbent upon the end-user to monitor for slow running queries.
If configured correctly, all supported versions of PostgreSQL collect statistics about the execution of each query, as long as the pg_stat_statements extension is installed and accessible from at least one database in the cluster. PostgreSQL currently only stores the cumulative total metric values for each query, and you’ll find many online tools and sample queries that will show you the average values for a particular query. However, unless you’re capturing and storing ‘snapshots’ of this data, then you’ll have no way of identifying which query is affecting server performance right now, or at some time in the past, or to understand if the performance of a particular query has degraded suddenly, or over time.
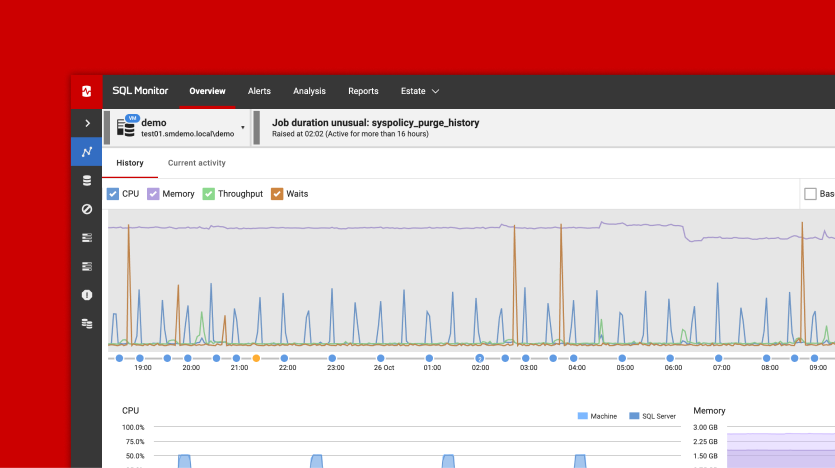
This is where a tool like SQL Monitor can be especially helpful because it will track these query performance statistics automatically, making it much easier to identify issues. Assuming pg_stat_statements is installed, SQL Monitor will periodically poll the data and store snapshots of the statistics. It reports this data within the Top Queries section of the Server Overview, which makes it much easier both to identify the most expensive queries that were running over the period of slow performance, and to understand the trend in the performance of a query over time.
Top Queries
The Top Queries section allows you to quickly filter for queries that are the most expensive, based on certain characteristics. This area is filtered to the same time range as the overall server metrics page, helping users to focus investigation efforts.
Within that time range you can sort top queries based on average or total metric counts across any of the tracked metrics. For example, if server performance has slowed down in the last hour, it’s often helpful to see which queries have been executed the most or have the highest average execution time. Opening the details pane for any query in the list shows the full query text and a history of average number of executions and duration, over time.

Retrieving and Visualizing Query Plans and Statistics
Having identified an expensive query, or one that seems to be performing abnormally, its query plan will often help us understand why. Proactively capturing query plans, however, does not happen automatically in PostgreSQL. Instead, it requires an extension called auto_explain and the query plans are only stored in the server logs. This can make it challenging to review and correlate plans found in the logs with metrics stored in by pg_stat_statements.
SQL Monitor simplifies this tremendously by reading query plans from the log, correlating them with the point-in-time statistics gathered from pg_stat_statements, and providing a visual query plan viewer. With this viewer, the runtime statistics of the query are visible for the entire execution plan and for each individual node of the plan, to see additional details in context:

The details of a PostgreSQL query plan are different from what you’re used to seeing for other databases, but the concepts are the same, and SQL Monitor’s plan visualization can help you understand the problematic areas of your query. For each node, the visual plan displays the number of blocks (pages) that have been read from cache (Shared Hit Blocks) or disk (Shared Read Blocks). Because each page is 8Kb in size, the more pages a query has to read, the slower its overall performance.
Additionally, much like in SQL Server, outdated statistics can often lead the Query Planner to choose poor query plans. Therefore, SQL Monitor highlights the difference between ‘planned rows’ from ‘actual rows’ that were returned at each step. When the Planner vastly over- or under-estimates the number of rows of data that will satisfy a query predicate (search condition), then performance usually suffers. If we have a straightforward way to see these discrepancies within the query plan, we can better target queries or processes that need to be improved.
Monitoring Server Resource Usage
Server resources are finite. Only by understanding how resources are being used when application load increases can DBAs make informed decisions about how to respond to resource bottlenecks. Should we, for example, increase available RAM or processor resources or modify server configurations to utilize existing resources better?
PostgreSQL has a strong correlation between memory usage and the number of active user connections. Unlike other databases, which use multiple threads or a built-in connection pooler, every connection to PostgreSQL is handled by a separate process. Additionally, the memory that a connection can use to satisfy the query is a product of the work_mem setting (the amount of RAM that can be allocated by a query before a file on disk is created) and the complexity of the query (the number of operations in the resulting query plan). Therefore, as the number of concurrent connections increases, it’s essential to have an overview of how connections, memory, and server load interact.
SQL Monitor we can reveal this trend in a couple of ways.
Number of Connections
First, every instance displays key metrics about the server and runtime as a set of helpful spark charts with time boundaries that match the overall graph time range.
![]()
Here we get a quick insight into the trend of connections over time. By default, PostgreSQL is configured for 100 connections. If the number of connections is consistently at or near the max setting, or it spikes during periods of slow queries, it’s an indication that the server might be resource-constrained for the current workload. Increasing the number of available connections could be the answer to increased performance, or it’s possible that the server doesn’t have enough CPU or memory free to accomplish the current query load. SQL Monitor’s built-in Percentage of connections used alert will warn you if the number of connections exceeds a threshold percentage of max_connections for a defined period.
If known performance problems correlate with the time of high connection usage, that’s also an indication that heavy load may be causing the server to queue queries at the precise time when you need more resources. Coupled with other data like Cache Hit Ratio, we can begin to see if the server needs more physical resources based on the current load and query characteristics.
Even better, being able to easily see historical baseline trends is an invaluable tool during the investigative process. SQL Monitor provides easy access to baseline data, set to a timeframe of your choice. Below, we can gauge if the current connection load is typical for the application during this time of day.

Cache Hit Ratio
In some databases like SQL Server, cache hit ratio doesn’t help identify constrained server resources as well as other metrics. In PostgreSQL, however, cache usage is directly tied to the amount of memory available to store data pages and the utilization of those pages over time. PostgreSQL does not currently have a statistic like Page Life Expectancy, as found in SQL Server.
When trying to conserve financial resources, DBAs will often squeeze as much performance as possible out of limited server resources, sometimes without fully understanding how badly it can affect query performance. The amount of memory that PostgreSQL can use to cache data pages is fixed by the shared_buffers configuration and must be a portion of the total available server memory. If this reserved space is not large enough to retain the actively queried data, many pages will have to be read from disk to satisfy the query. The default shared_buffers value is 128mb which is dramatically undersized for today’s real-world production workloads.
A database that has grown over time, especially the amount of “active” data, can slow down simply because there aren’t enough memory resources to keep up with query load. This becomes evident when investigating the Efficiency section of the Server Overview in SQL Monitor.
![]()
Any time the Cache Hit Ratio is under 90% or has consistent dips that correlate with high usage and poor performance, this indicates that the server doesn’t have enough resources to keep active pages in memory. Increasing the available memory or improving inefficient queries is often the best way to mitigate memory constraint issues.
PostgreSQL Maintenance with Vacuum
PostgreSQL is unique in how it implements transaction isolation using Multi-Version Concurrency Control (MVCC). Instead of storing modified rows in a separate log file or temporary table, PostgreSQL stores new versions of rows (called Tuples) within the same table, using transaction IDs (XID) to mark which version of a row currently running transactions should see. Once all transactions have finished that require a version of a row, it is considered a dead tuple and can be cleaned up. This cleanup is handled by a process called vacuum, which frees the space for new data and ensures transaction IDs are managed properly for future transactions.
Vacuuming is a task so essential to the proper functioning of a PostgreSQL database that an automated process called autovacuum runs by default on all servers. Although it can be turned off in configuration, doing so is highly discouraged, at least without a lot of experience and a plan for re-enabling it. If these dead tuples are never cleaned up, the overall performance of the PostgreSQL database will suffer in multiple ways. For example, to return the appropriate set of live data rows, PostgreSQL will have to read more pages from disk which increases disk I/O. Likewise, index efficiently will decrease as PostgreSQL has to follow pointers across multiple pages for the same data. Taken together, improper vacuum maintenance will eventually lead to suboptimal database performance. See Uncovering the mysteries of PostgreSQL (auto) vacuum for a detailed description of how MVCC works, the role of autovacuum and the important parameters that control its behavior.
With proper monitoring, it’s easier to spot signs of unhealthy vacuum performance and areas where configuration changes may be needed. Poorly maintained databases due to vacuuming issues typically materialize in at least three areas: table bloat, outdated table statistics and increased risk of transaction ID exhaustion.
The easiest one to identify and deal with is table bloat.
Table Bloat
Anyone that’s managed a relational database is familiar with the potential for bloat, a condition where the space on disk is disproportionate to the amount of data within the table or database. The reasons why table bloat happens can vary between database engines. In SQL Server for instance, not setting up log backups correctly can easily cause a database to take up more disk space than necessary, which will require more maintenance work in the future.
In a healthy and properly configured PostgreSQL instance, the autovacuum process easily maintains the database and keeps table bloat at bay. However, if the server resources are not adequate or unexpected usage patterns cause the autovacuum process to fall behind, you need to know immediately that this is happening.
One of the ways this can begin to present itself is with table bloat, a ratio of live tuples to dead tuples. Remember that a dead tuple refers to a row on disk that will never be used by another transaction; it’s old data that needs to be cleaned up so that new rows can utilize that space. If dead tuples continue to increase, autovacuum isn’t doing its job properly.
SQL Monitor has a PostgreSQL specific view on the main Server Overview page that highlights vacuum settings and table size metrics. Each table over 50MB will show current usage statistics in this area.
As you can see in the example below, the orders table has nearly 3.5GB of dead tuples, more than 8.5% of the total table size. Over the 24-hour period displayed, there has been no reduction in the total space used by dead tuples, an indication that vacuuming hasn’t occurred recently. This could be a configuration issue or a long-running transaction that’s preventing the cleanup of dead tuples.

In fact, we can see from the Last vacuum column that this table hasn’t been vacuumed in about a week. The screenshot was taken on May 31, 2023, and yet the last vacuum to occur was May 14, 2023. Because so much space is being held by dead tuples, this table is a clear candidate for further investigation.
If we zoom out and look for a larger trend, it becomes clear that dead tuples are being cleaned up periodically, but often with a week or more activity. The likely reason for this pattern is that autovacuum runs based on a percentage of rows modified, similar to how SQL Server triggers updates to table statistics. By default, the target is 20% of the total rows in a table. On a table with 10,000 rows, autovacuum will kick in after approximately 2,000 rows have been modified. However, as the table gets larger, more dead tuples will accumulate before the vacuuming process kicks in. At 1,000,000 rows, PostgreSQL will let about 200,000 dead tuples accumulate before freeing up the space for future data.

In this situation, it may be ideal to lower the autovacuum threshold to a lower percentage so that larger tables are vacuumed more frequently. This keeps table bloat in check and ensures that the disk utilization for the table doesn’t grow unnecessarily between vacuum processes.
Transaction ID Exhaustion
Another important aspect of the PostgreSQL MVCC implementation is that the transaction IDs that determine row visibility are limited to around 2.1 billion (2^31) integer values. Whenever the vacuum process runs, either manually or by the autovacuum process, PostgreSQL identifies transaction IDs that can be “frozen”, essentially returning transaction IDs to the pool so that the available ID space is sufficient for future transactions.
If a long-running transaction, or some other problem, prevents the vacuum process from properly managing the transaction ID space, the PostgreSQL instance will eventually run out of available IDs and prevent any data modification until the ID space can be cleaned up appropriately. This is referred to as transaction ID wraparound or exhaustion.
Although it is very uncommon for most PostgreSQL installations to experience transaction ID exhaustion, it’s essential that your monitoring solution tracks current levels and provides a sufficient alert to allow proactive maintenance of the transaction ID space. Without proper tracking and alerting, transaction ID exhaustion could cause your PostgreSQL database to go offline, an outcome that no DBA wants to experience without warning. By using a monitoring solution that tracks and alerts on long-running transactions and transaction ID consumption, DBAs can manage any issues that might arise with their PostgreSQL database, proactively.
SQL Monitor has a built-in metric that allows you to visualize the current percentage level of Transaction ID usage within a database. Additionally, by default, SQL Monitor will send an alert notification any time the transaction ID usage breaches a specific threshold. Knowing well in advance that something is preventing the transaction ID space from being managed efficiently helps database administrators deal with issues quickly.
![]()
Conclusion
PostgreSQL can handle tremendous workloads of all shapes and sizes. Knowing how to effectively monitor PostgreSQL comes with challenges, especially for users that have deep roots with other databases like SQL Server. Tools like SQL Monitor help automate data collection, highlight key problem areas, and effectively manage alerts for the most important issues.
This article has explained just a small set of metrics that require especially close attention in PostgreSQL monitoring. If you’re immediately aware of unusual patterns of behavior in any of these metrics, or combination of metrics, you’ll be able to act before an ‘abnormal trend’ becomes a problem that affects application performance. As you and your team work to implement an effective plan for PostgreSQL monitoring and performance optimization, focusing on these metrics will help you reach your uptime and performance goals.
Tools in this post
Redgate Monitor
Real-time SQL Server and PostgreSQL performance monitoring, with alerts and diagnostics


