Finding Inactive SQL Server Databases
Phil Factor demonstrates how to identify objects in a database that are not being used. The technique uses Extended Events to detect acquisition of Intent locks, and so determine which databases are active or apparently 'dormant', and then drills down to investigate on which tables data has been modified recently, and which views and stored procedures have been run.
It’s a common problem. You have a server with lots of databases on it, and it is beginning to get rather confusing as to which ones are needed on there, and which aren’t. On your average dev server, you’ll find plenty of old test databases, abandoned by a developer who’s probably now left the company, their requirement lost in the mists of time.
There are some interesting discussions about the different ways of detecting database usage with SQL Server. I like to use an Extended Event for this sort of task, because it is a reasonably lightweight way of doing it. One possibility for measuring system activity in a database is to simply count the number of checkpoints for each database. However, this is very indirect, and doesn’t tell you what is being accessed and why. The biggest problem with choosing a checkpoint-related event is that with an inadequate filter the event session will generate a mountain of data, on a busy database. It is like using a sensitive amplifier to detect if there is anyone in a football stadium. Fine if it is dead of night in an apparently empty stadium, but useless in the middle of a big match. You must select your suspects. Do these databases seem to have been neglected or cast aside?
What we need is a simple way of knowing, at a high level, which databases are being used, and which are not. Redgate Monitor can easily collect this information via a custom metric that queries the data collected from an Extended Events session.
For any used databases, we then need way to identify objects in a database that are not being used, i.e. to see which tables and views are and aren’t being accessed or modified. We’re talking about data access here, not changes to objects. We can get these details from a second Extended Event session that details exactly which objects were accesses, how, when and by whom. If they haven’t been used for a week or so, they are either used only sporadically, or abandoned. The former are good candidates for cloning, and the latter are better off being backed up, and restored only if required.
Intent locks
The Intent Shared (IS) lock is a good candidate for this sort of task, since it detects the signs of even tentative access to a database. It is the SQL Server equivalent of a polite cough. It is used as an advanced indication at the page level, as well as the database level, that a process requires a shared (S) lock on some rows. Similarly, the Intent Exclusive (IX) lock on a table or page indicates the intent to acquire exclusive (X) locks on the rows. Together, these will pick up the SELECT statements as well as modifications (Update, Delete and Insert), and each lock is acquired only once by each table associated with the SQL statement. While the IS lock is in place, other transactions cannot acquire the X lock on that table or view, and while the IX is in place other transactions cannot acquire the S, U or X lock on that table or view.
Fortunately, if you use Extended Events to look for these intent locks, you can get the TSQL text of the transaction responsible, and this will tell you what function, batch or procedure did it. You can also get information about the user and session. You will also get the name of the tables that were associated to the query, including tables that have foreign keys to the tables being directly affected by the selection or modification of the data
If a database isn’t getting these Intent locks to its objects, then it is likely to be a candidate for retirement. The more being acquired, the more active the database.
Problems with measuring database activity
Measuring database activity isn’t entirely straightforward. The method I use involves creating an Extended Events session to monitor the lock_acquired event for acquisition of IS and IX locks. However, you might find all sorts of locking activity originates from automated processes. Redgate Monitor, for example, will execute batches that run on every database that you ask it to monitor. You might have SQL Agent processes that someone has put in and forgotten about. You can filter all these out reasonably easily, but it is a task you must do before you can start monitoring a database for signs of life. The most important thing is to select a sensible candidate for investigation. If a database is showing signs of a lot of activity, then there isn’t much point in suspecting it of being unused.
The most difficult problem that I’ve had is in devising a method that not only gives me an overview of activity across all databases on an instance, so I can line up candidates for retirement, but also allows a more detailed investigation, over a longer period, to find out which of these databases are quiescent, rather than entirely unused, and which objects are being accessed in each of these databases. I need an overview session that tells me which databases are getting only very few Intent lock acquisitions, and then investigating each over a longer period, a few weeks perhaps, to understand any traffic it is getting. Then, with the more detailed information I can get, I can eliminate ‘noise’ such as automated maintenance processes and monitoring processes that might otherwise give me a false positive indication that the database is being used. It is a somewhat more refined alternative to deleting the database and waiting for the sound of distant screams.
In the end, I settled on having two Extended Event sessions active on my servers, one for the overview and the other for the detail of a single database. This is because I wanted the measurement of overall activity to be as lightweight as possible.
Monitoring for signs of life in a server’s databases
This first Extended Events session is how you line up the suspects, to identify the unused databases. You set up an XE session that accumulates the total number of Intent lock acquisitions in a set of buckets, each one corresponding to a database. You are filtering for just user objects (tables and views). You might need to filter out any monitoring activity. I’ve added a filter here to remove activity from Redgate Monitor just to illustrate a way of doing this.
|
1 2 3 4 5 6 7 8 9 10 11 12 13 14 15 16 17 18 19 20 21 22 23 24 25 26 27 28 29 30 31 32 33 34 |
IF EXISTS --if the session already exists, then delete it. We are assuming you've changed something ( SELECT * FROM sys.server_event_sessions WHERE server_event_sessions.name = 'WhoIsBusy' ) DROP EVENT SESSION [WhoIsBusy] ON SERVER; GO CREATE EVENT SESSION [WhoIsBusy] /* session that merely checks the number of Intent Shared locks being allocated in each database, as a rough measure of the activity goiong on in each database over a time period */ ON SERVER ADD EVENT sqlserver.lock_acquired --a lock on a resource such as a data page, has been acquired. (ACTION (sqlserver.database_name) --aggregate on the name of the database WHERE ( [package0].[equal_boolean]([sqlserver].[is_system], (0)) --ignore system objects AND [package0].[equal_uint64]([resource_type], (5)) --just the objects (tables and views) AND NOT [sqlserver].[like_i_sql_unicode_string]([sqlserver].[sql_text], N'%RedGateIgnore%') AND ( [package0].[equal_uint64]([mode], (6)) --IS OR [package0].[equal_uint64]([mode], (8)) --IX ) ) ) ADD TARGET package0.histogram --we just want the number of locks over time for each database (SET filtering_event_name = N'sqlserver.lock_acquired', slots = (128), -- up to 128 databases source = N'sqlserver.database_name' ) --aggregate on the database name WITH ( MAX_MEMORY = 4096KB, EVENT_RETENTION_MODE = ALLOW_SINGLE_EVENT_LOSS, MAX_DISPATCH_LATENCY = 30 SECONDS, MAX_EVENT_SIZE = 0KB, MEMORY_PARTITION_MODE = NONE, TRACK_CAUSALITY = OFF, STARTUP_STATE = ON ); ALTER EVENT SESSION WhoIsBusy ON SERVER STATE = START; |
Listing 1: Create and start the WhoIsBusy event session
Now, start this session and wait a while, say half an hour upwards, depending on the level of activity. Then we can see how many IS and IX locks were allocated for each database using a query like this.
|
1 2 3 4 5 6 7 8 9 10 11 12 13 14 15 16 17 18 19 20 21 |
/* now we can query the histogram to see the tally in each bucket. This is a very lightweight activity. and is ideal for getting an idea of overall activity. */ --this way of doing it gives a better performance DECLARE @Target_Data XML = ( SELECT TOP 1 Cast(xet.target_data AS XML) AS targetdata FROM sys.dm_xe_session_targets AS xet INNER JOIN sys.dm_xe_sessions AS xes ON xes.address = xet.event_session_address WHERE xes.name = 'WhoIsBusy' AND xet.target_name = 'histogram' ); SELECT databases.name, Coalesce(IntentLockCount, 0) AS IntentLocks FROM sys.databases LEFT OUTER JOIN ( SELECT the.event_data.value('(value)[1]', 'sysname') AS [Database], the.event_data.value('(@count)[1]', 'bigint') AS IntentLockCount FROM @Target_Data.nodes('//HistogramTarget/Slot') AS the(event_data) ) f([Database], IntentLockCount) ON f.[Database] = databases.name ORDER BY IntentLocks DESC; |
Listing 2: Querying WhoIsBusy event data to return number of intent locks per database
This gives a result that looks like this (the actual database names redacted!)
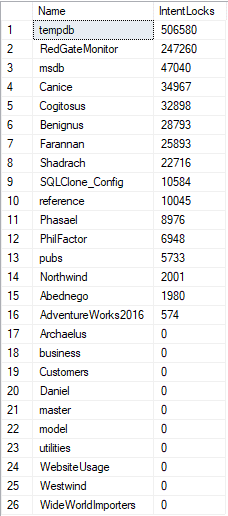
So far, we have a list of ‘retirement’ candidates for further investigation. Within a database, we can now easily set up a similar Extended Event session for the next level, which is seeing the objects within a database that are getting the attention, how and from whom.
Checking on the activity on individual tables and views
When we get to the point of looking for any signs of activity in an apparently quiescent database, we need new session that provides rather different information. We need, for our second session, to have the name of the table or view for which the lock is being requested. We want the TSQL of the statement or batch that is the cause of the request. We need to know the user who is accessing the object.
For this demonstration, I’m going to check on just one database, Pubs but, in reality, it would be one of the retirement candidates at the bottom of the above results. Our IsitUsed session, below, is like the first ‘overview’ one but it uses a ring buffer to store the information. This is fine, as long as you extract the information before it is overwritten. As you are monitoring what is only sporadic usage at best, it should be OK. As I’ll demonstrate later, Redgate Monitor can easily collect this information from the ring buffer via a custom metric.
We are excluding system objects again and filtering only for the ‘Pubs‘ database, just collecting locks that are on objects (5), and only getting the IS locks (6) or IX locks (8).
|
1 2 3 4 5 6 7 8 9 10 11 12 13 14 15 16 17 18 19 20 21 22 23 24 25 26 27 28 29 30 31 32 33 34 |
IF EXISTS --if the session already exists, then delete it. We are assuming you've changed something ( SELECT * FROM sys.server_event_sessions WHERE server_event_sessions.name = 'IsItUsed' ) DROP EVENT SESSION [IsItUsed] ON SERVER; GO CREATE EVENT SESSION [IsItUsed] ON SERVER ADD EVENT sqlserver.lock_acquired (ACTION ( package0.collect_system_time, sqlserver.database_name, sqlserver.sql_text, sqlserver.username ) WHERE ( [package0].[equal_boolean]([sqlserver].[is_system], (0)) AND [sqlserver].[equal_i_sql_unicode_string]([sqlserver].[database_name], N'Pubs') AND [package0].[equal_uint64]([resource_type], (5)) --object AND NOT [sqlserver].[like_i_sql_unicode_string]([sqlserver].[sql_text], N'%RedGateIgnore%') AND ( [package0].[equal_uint64]([mode], (6)) --IS OR [package0].[equal_uint64]([mode], (8)) --IX ) ) ) ADD TARGET package0.ring_buffer WITH ( MAX_MEMORY = 4096KB, EVENT_RETENTION_MODE = ALLOW_SINGLE_EVENT_LOSS, MAX_DISPATCH_LATENCY = 30 SECONDS, MAX_EVENT_SIZE = 0KB, MEMORY_PARTITION_MODE = NONE, TRACK_CAUSALITY = OFF, STARTUP_STATE = ON ); GO |
Listing 3: Create the IsItUsed event session
You can collect data for a whole list of databases rather than just one, but this sort of multi-database session only becomes practicable if you’re not interested in the identify the individual objects being accessed. The Extended Event session only returns the object_id, and to get the name, your SQL expression to retrieve this information must be executed in the correct database user context. If you are monitoring the Westwind database in the above list, for example, you’d need to run your analysis queries, in the collected event data, from a query pane connected to that same Westwind database.
You can get some but not all this object-level information, such as the table being accessed, directly from the TSQL causing the intent lock. However, if a view is accessed, SQL Server will also get Intent Shared locks on all the underlying tables and, of course, these will not all appear in the TSQL.
Which tables are being accessed and how?
We can start up our new session:
|
1 |
ALTER EVENT SESSION IsItUsed ON SERVER STATE = START; |
Listing 4: Start the IsItUsed event session
Then, from SSMS, we can view the events coming in, and the data collected. In the left-hand browser pane, click on Extended Events within the Management folder for the server. Open the Sessions subfolder, right click on the IsItUsed session, which should now have the green “play” symbol, indicating it is running, and select Watch Live Data.
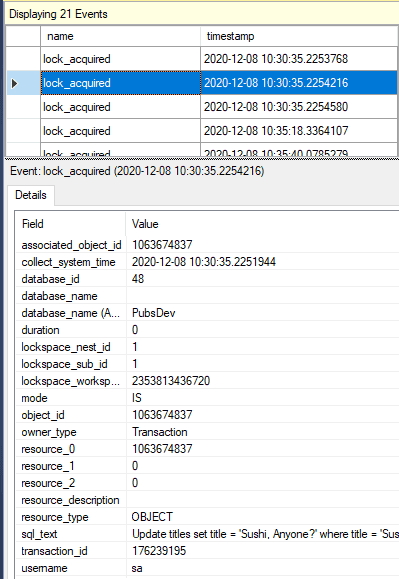
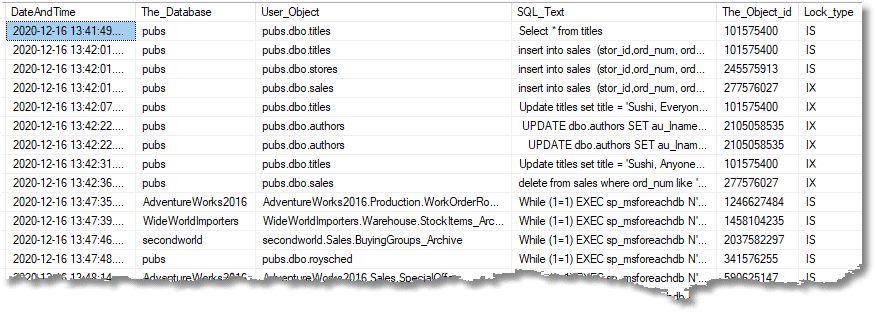
Having admired all this information, we’ll probably settle for this sort of digest:
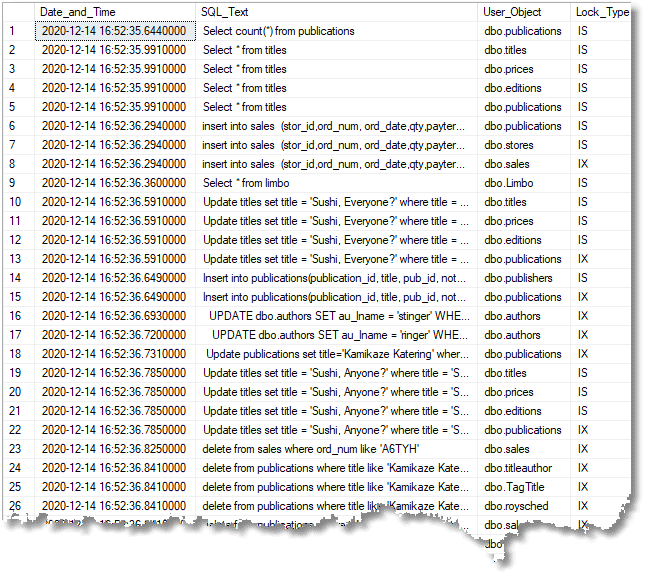
…which we get by querying the ring buffer:
|
1 2 3 4 5 6 7 8 9 10 11 12 13 14 15 16 17 18 19 20 21 22 23 |
Use Pubs DECLARE @Target_Data XML = ( SELECT TOP 1 Cast(xet.target_data AS XML) AS targetdata FROM sys.dm_xe_session_targets AS xet INNER JOIN sys.dm_xe_sessions AS xes ON xes.address = xet.event_session_address WHERE xes.name = 'IsItUsed' AND xet.target_name = 'ring_buffer' ); SELECT Convert(DATETIME2, SwitchOffset(Convert(DATETIMEOFFSET,the.event_data.value('(@timestamp)[1]', 'datetime2')), DateName(TzOffset, SysDateTimeOffset()))) AS Date_and_Time, the.event_data.value('(action[@name="sql_text"]/value)[1]', 'nvarchar(max)') AS SQL_Text, Object_Schema_Name(objects.object_id)+'.'+objects.name AS User_Object, CASE WHEN the.event_data.value('(data[@name="mode"]/value)[1]', 'int')=6 THEN 'IS' ELSE 'IX' END AS Lock_Type --, Object_name(the.event_data.value('(data[@name="resource_0"]/value)[1]', 'Bigint')) AS resource0 FROM @Target_Data.nodes('//RingBufferTarget/event') AS the (event_data) LEFT OUTER JOIN sys.objects -- to get the schema and name of the object ON objects.object_id=the.event_data.value('(data[@name="resource_0"]/value)[1]', 'Bigint') AND objects.is_ms_shipped=0 --don't want to know about system objects WHERE objects.object_id IS NOT NULL; -- this line filters out anything that isn't a database object |
Listing 5: Querying IsItUsed event data to see which objects were accessed and TSQL executed
Obviously, here I’m seeing a lot of activity because I’m just testing things out, but when you run this on a candidate for removal, you’ll see only sparse activity and you’ll want to find out where it came from, and why. There are more actions that you can specify for the event to help with this, such as the user_id and spid.
Getting the last time a TSQL query was run on a database
We can now think about everything we want from this event session. Firstly, we can build up a list of our ‘narcoleptic’ databases, and a date at which they were last accessed. If all we need is the last time a query was run on any database in a list, and not the identify all the individual objects accessed, we can just adapt the IsItUsed event session to monitor several databases. There is no IN operator in Extended Events, so we must use chained OR expressions:
|
1 2 3 4 5 6 7 8 9 10 11 12 13 14 15 16 17 18 19 20 21 22 23 24 25 26 27 28 29 30 31 32 33 34 35 36 37 38 39 |
IF EXISTS --if the session already exists, then delete it. We are assuming you've changed something ( SELECT * FROM sys.server_event_sessions WHERE server_event_sessions.name = 'IsItUsed' ) DROP EVENT SESSION [IsItUsed] ON SERVER; GO CREATE EVENT SESSION [IsItUsed] ON SERVER ADD EVENT sqlserver.lock_acquired (ACTION ( package0.collect_system_time, sqlserver.database_name, sqlserver.sql_text, sqlserver.username ) WHERE ( [package0].[equal_boolean]([sqlserver].[is_system], (0)) AND ( [sqlserver].[equal_i_sql_unicode_string]([sqlserver].[database_name], N'Pubs') OR [sqlserver].[equal_i_sql_unicode_string]([sqlserver].[database_name], N'Adventureworks2016') OR [sqlserver].[equal_i_sql_unicode_string]([sqlserver].[database_name], N'SecondWorld') OR [sqlserver].[equal_i_sql_unicode_string]([sqlserver].[database_name], N'WideWorldImporters') ) AND [package0].[equal_uint64]([resource_type], (5)) --object AND NOT [sqlserver].[like_i_sql_unicode_string]([sqlserver].[sql_text], N'%RedGateIgnore%') AND ( [package0].[equal_uint64]([mode], (6)) --IS OR [package0].[equal_uint64]([mode], (8)) --IX ) ) ) ADD TARGET package0.ring_buffer WITH ( MAX_MEMORY = 4096KB, EVENT_RETENTION_MODE = ALLOW_SINGLE_EVENT_LOSS, MAX_DISPATCH_LATENCY = 30 SECONDS, MAX_EVENT_SIZE = 0KB, MEMORY_PARTITION_MODE = NONE, TRACK_CAUSALITY = OFF, STARTUP_STATE = ON ); |
Listing 6: Adapting the IsItUsed event session to collect lock_acquired events for a list of databases
And here’s the query to get the last time that a TSQL query was run within a database:
|
1 2 3 4 5 6 7 8 9 10 11 12 13 14 15 16 17 18 19 20 21 |
DECLARE @Target_Data XML = ( SELECT TOP 1 Cast(xet.target_data AS XML) AS targetdata FROM sys.dm_xe_session_targets AS xet INNER JOIN sys.dm_xe_sessions AS xes ON xes.address = xet.event_session_address WHERE xes.name = 'IsItUsed' AND xet.target_name = 'ring_buffer' ); Select max(Datetime_Local) as LastTimeAccessed,[Database], left(SQL_Text,80) as [TSQL] from ( SELECT CONVERT(datetime2, SwitchOffset(CONVERT(datetimeoffset,the.event_data.value('(@timestamp)[1]', 'datetime2')), DateName(TzOffset, SYSDATETIMEOFFSET()))) AS datetime_local, the.event_data.value('(action[@name="database_name"]/value)[1]', 'nvarchar(80)') AS [database], the.event_data.value('(action[@name="sql_text"]/value)[1]', 'nvarchar(max)') AS SQL_Text FROM @Target_Data.nodes('//RingBufferTarget/event') AS the (event_data) )f(datetime_local,[Database],SQL_Text) group by left(SQL_Text,80), [Database] order by LastTimeAccessed ASC |
Listing 7: Querying event data to find what TSQL was last executed on a database and when
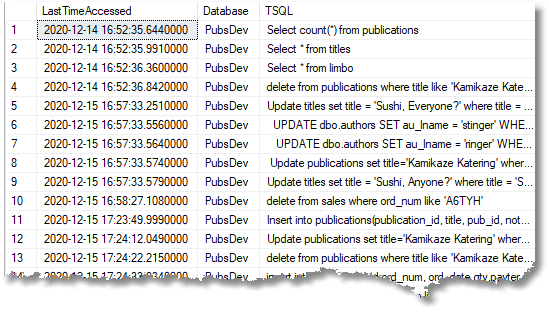
If you need to see what objects were associated with the intent wait and when, it can still be done when you have several databases under observation, but the code is much more complicated because one must be in the right database context to work out the name of the object, and its schema. This means that you must do each database in turn. The upside of this is that you can execute this code from any database on the server, and if you wrap this into a procedure, the complexity won’t worry you!
|
1 2 3 4 5 6 7 8 9 10 11 12 13 14 15 16 17 18 19 20 21 22 23 24 25 26 27 28 29 30 31 32 33 34 35 36 37 38 39 40 41 42 43 44 45 46 47 48 49 50 51 52 53 54 55 56 57 58 59 60 61 62 63 64 65 66 67 68 69 70 71 |
DECLARE @Target_Data XML = ( SELECT TOP 1 Cast(xet.target_data AS XML) AS targetdata FROM sys.dm_xe_session_targets AS xet INNER JOIN sys.dm_xe_sessions AS xes ON xes.address = xet.event_session_address WHERE xes.name = 'IsItUsed' AND xet.target_name = 'ring_buffer' ); --CREATE TYPE OurSpecialType AS TABLE --(DateAndTime DateTime2,The_Database sysname, SQL_Text nvarchar(max),The_Object_id bigint, Lock_Type char(2)) IF NOT EXISTS (SELECT name FROM sys.Table_Types WHERE name LIKE 'OurSpecialType') CREATE TYPE OurSpecialType AS TABLE ( DateAndTime DATETIME2, The_Database sysname, SQL_Text NVARCHAR(MAX), The_Object_id BIGINT, Lock_Type CHAR(2) ); DECLARE @BasicData OurSpecialType; insert into @basicData (DateAndTime,The_Database, SQL_Text,The_Object_id, Lock_Type) SELECT Convert(DATETIME2, SwitchOffset(Convert(DATETIMEOFFSET,the.event_data.value('(@timestamp)[1]', 'datetime2')), DateName(TzOffset, SysDateTimeOffset()))) AS Date_and_Time, the.event_data.value('(action[@name="database_name"]/value)[1]', 'nvarchar(80)') AS [The_Database], the.event_data.value('(action[@name="sql_text"]/value)[1]', 'nvarchar(max)') AS SQL_Text, the.event_data.value('(data[@name="resource_0"]/value)[1]', 'Bigint') as The_Object_id, CASE WHEN the.event_data.value('(data[@name="mode"]/value)[1]', 'int')=6 THEN 'IS' ELSE 'IX' END AS Lock_Type FROM @Target_Data.nodes('//RingBufferTarget/event') AS the (event_data) DECLARE @Databases TABLE (TheOrder INT IDENTITY(1, 1), TheDatabase sysname); DECLARE @ii INT, @iiMax INT; INSERT INTO @Databases (TheDatabase) SELECT DISTINCT The_Database FROM @BasicData; SELECT @ii = 1, @iiMax = @@RowCount; DECLARE @CommandString NVARCHAR(4000) = N' USE <MyDatabase> Select DateAndTime,The_Database, DB_Name()+''.''+Object_Schema_Name(objects.object_id)+''.''+objects.name AS User_Object, SQL_Text,The_Object_id, Lock_Type from @The_Basic_Data The_Event_Data LEFT OUTER JOIN sys.objects -- to get the schema and name of the object ON objects.object_id=The_Event_Data.The_Object_id AND objects.is_ms_shipped=0 --don''t want to know about system objects WHERE objects.object_id IS NOT NULL and The_Event_Data.The_Database=DB_Name(); -- this line filters out anything that isn''t a database object '; DECLARE @Params NVARCHAR(100) = N'@The_Basic_Data ourspecialtype READONLY', @ThisCommand NVARCHAR(4000); DECLARE @TableOfWaits TABLE ( DateAndTime DATETIME2, The_Database sysname, User_Object sysname, SQL_Text NVARCHAR(MAX), The_Object_id BIGINT, Lock_type CHAR(2) ); WHILE @ii <= @iiMax BEGIN SELECT @ThisCommand = Replace(@CommandString, '<MyDatabase>', TheDatabase) FROM @Databases WHERE TheOrder = @ii; INSERT INTO @TableOfWaits (DateAndTime, The_Database, User_Object, SQL_Text, The_Object_id, Lock_type) EXECUTE sp_executesql @ThisCommand, @Params, @The_Basic_Data = @BasicData; SELECT @ii = @ii + 1; END; SELECT DateAndTime, The_Database, User_Object, SQL_Text, The_Object_id, Lock_type FROM @TableOfWaits ORDER BY DateAndTime; |
Listing 8: A report of reads and writes for all databases
Creating a custom metric
We can now provide Redgate Monitor with a custom metric that collects and analyzes the number of IS and IX locks in a time interval, providing a measure of the amount of activity on any database or server. Each time the metric runs, a single numeric value is collected. Values are displayed as data points on Redgate Monitor’s Analysis graph when you select a custom metric from the ‘Show’ dropdown list. Any custom alert is raised at a defined level: either Low, Medium, or High. They can either be ‘Active’; meaning that the issue that triggered the alert is still a problem, or ‘Ended’: meaning that the issue has been resolved. As the collected metric value changes, the Active alert will automatically escalate or downgrade from the threshold level at which it was raised.
For Redgate Monitor, we can use our initial simple Extended event, WhoIsBusy, as before. We take the analysis query from Listing 2 and adapt it for the custom metric so that we can use it either to collect a count of the IS and IX locks acquired for all databases on the server, or for each database.
|
1 2 3 4 5 6 7 8 9 10 11 12 13 14 15 16 17 18 19 20 21 22 23 24 25 26 27 28 29 30 31 32 33 |
--this way of doing it gives a better performance DECLARE @Target_Data XML = ( SELECT TOP 1 Cast(xet.target_data AS XML) AS targetdata FROM sys.dm_xe_session_targets AS xet INNER JOIN sys.dm_xe_sessions AS xes ON xes.address = xet.event_session_address WHERE xes.name = 'WhoIsBusy' AND xet.target_name = 'histogram' ); Select case when db_name() like 'master' then (SELECT sum(IntentLockCount) FROM sys.databases LEFT OUTER JOIN ( SELECT the.event_data.value('(value)[1]', 'sysname') AS [Database], the.event_data.value('(@count)[1]', 'bigint') AS IntentLockCount FROM @Target_Data.nodes('//HistogramTarget/Slot') AS the(event_data) ) f([Database], IntentLockCount) ON f.[Database] = databases.name ) else (SELECT Coalesce(IntentLockCount, 0) AS IntentLocks FROM sys.databases LEFT OUTER JOIN ( SELECT the.event_data.value('(value)[1]', 'sysname') AS [Database], the.event_data.value('(@count)[1]', 'bigint') AS IntentLockCount FROM @Target_Data.nodes('//HistogramTarget/Slot') AS the(event_data) ) f([Database], IntentLockCount) ON f.[Database] = databases.name where name like DB_name() ) end |
Listing 9: Custom metric to return count of intent locks per database
After entering the query, we need to specify the instance and databases for which we want it to be collected, as well as a collection frequency, and whether we want to use collected or calculated values.
If we specify it for a server-level metric, then we choose ‘Specify databases to include’ and enter just the master database, in which case the metric returns data for the whole server. If, instead, you want Redgate Monitor to collect data on individual databases then select ‘All user databases’. Now it is getting values for individual databases, and it needs to do that to create a graph of usage over time for all its monitored databases. Redgate Monitor will execute the data collection query on each database in turn, making each call in the context of the database from which it wants to collect data. Our SQL expression above, therefore, gets the histogram values and filters out just the value for that database.
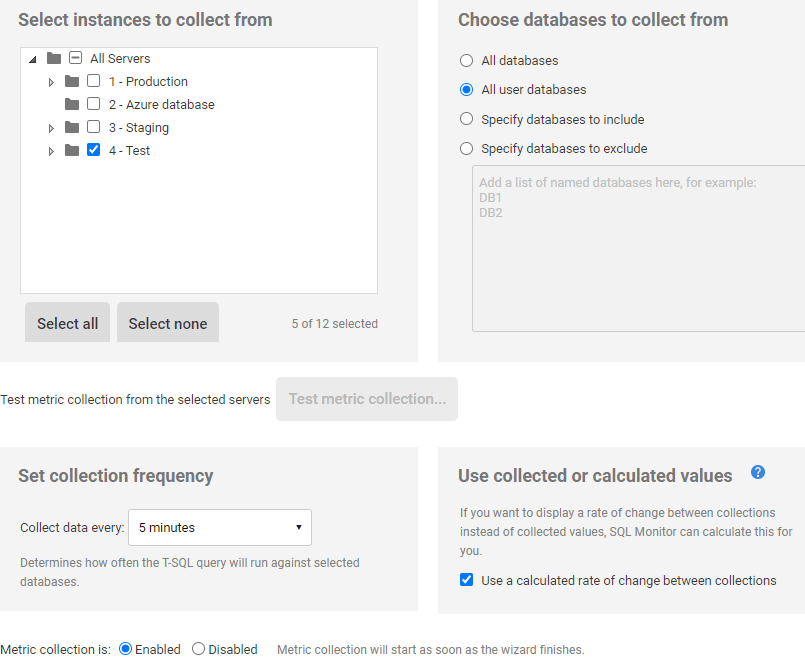
We also turn on the ‘Use a calculated rate of change between collections’ checkbox. If we do this, Redgate Monitor calculates the rate of use by finding the difference between each pair of consecutive values and dividing it by the number of seconds between each collection.
Our metric just passes pass back the current value and lets Redgate Monitor draw conclusions from it. Here we have an analysis graph showing the activity of some intermittently used databases.
 It is impractical to display on an analysis graph more than five databases at a time because the graph starts to look more like a birds-nest. Therefore ‘(All)’ option that selects to display the metric for every database on the instance isn’t suitable for analyzing the data for this metric.
Also, the graph for a highly used database affects the scale of the graph and the quiescent database appear as a line at the bottom of the graph even if there is activity in them.

You therefore need to select the individual databases you want to display, but you can’t select more than one at the same time. Instead, you must select the custom metric several times and select one database for each instance of the custom metric. Then you get the activity of each database.
When you detect activity on one or more narcoleptic database, you can then set up the IsItUsed session in listing 6 with your suspect databases and leave it to run for as long as you need. It is putting data into a ring buffer, so it won’t cause anything to burst messily if there is too much activity. Check occasionally with an appropriate query: either the simple one for a single database in Listing 5, the one that simply tells you the latest time that each query was done in Listing 7, or for a complete timeline for several sleepy databases, in Listing 8. With that level of forensics, you have enough evidence to make backups of databases and then remove them from the server, or at least berate unsuspecting developers on the sins of wasting valuable space on a server.
Conclusions
Sometimes, you just want to know if anyone is using a database. This means that you’re not so interested in the performance metrics, you just need to first know if a database is being used, even if it is just occasional use. Once you believe it is hardly-ever being used, or maybe completely abandoned, then it is time to put an Extended Event on it to see what is happening in more detail. Is this database just storing a long-abandoned metric, maybe for a website that has been retired but is still having its usage logged? You always have the right XE session for the task to answer this sort of question.
Tools in this post
Redgate Monitor
Real-time multi-platform performance monitoring, with alerts and diagnostics