


Five practical ways Redgate Assistant helps DBAs get to the answer faster
An alert is the most useful if it helps you decide what to do next.
Redgate Monitor gives you the information you need to understand what is happening across your estate: alerts, metrics, queries, waits, execution plans and performance history. But during an investigation, the difficult part is rarely finding more data. It is working out which signals matter, how they relate and where to begin.
What is Redgate Assistant?
Redgate Assistant is AI built directly into Redgate’s database tools. In Monitor, it lets you investigate performance problems using natural-language questions and the context Monitor already holds.
It brings together relevant metrics, queries, waits and execution plans, then uses authored skills built around Redgate’s database expertise to help interpret the evidence. In addition to insightful dashboards, you get a clear explanation of the situation and a direction on next steps.
Here are five ways it can help today. We will continue to update this list as Redgate Assistant evolves and new skills become available.
1. Understand why an alert fired
Without Redgate Assistant, you may need to check host and instance metrics, inspect the queries running at the time and work out how the different signals relate. That takes time, particularly when several alerts arrive together or you are looking at an unfamiliar server.
With Redgate Assistant, you can ask:
“Why did this alert fire?”
It can examine the alert alongside the context held in Monitor, identify relevant patterns and help you understand whether queries, resource pressure, waits or blocking may have contributed.
It then explains what happened in plain language and points you towards the evidence worth examining first. You can ask it to clarify a recommendation, investigate a particular query or explain how to carry out the suggested next step without beginning again.
2. Understand why a query is slow
Reading an execution plan well takes experience. When a query starts causing problems, you may be looking at unfamiliar operators, expensive operations and several possible places to begin.
You can ask:
“What is making this query expensive?”
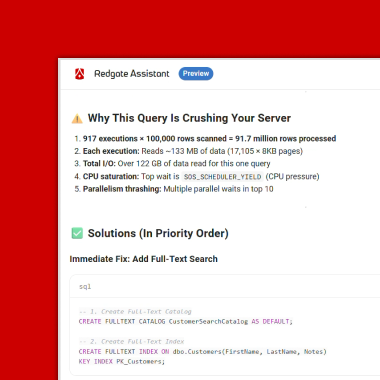
Using the context Monitor already holds, Redgate Assistant can interpret the execution plan alongside other evidence. It can draw attention to issues such as scans, inefficient predicates, missing or non-covering indexes, and expensive subqueries.
Instead of spending the first part of the investigation translating the plan, or waiting for a more experienced colleague, you get an initial explanation you can review. You can then explore a particular finding or ask about the recommended next step.
Execution-plan expertise still matters. Redgate Assistant simply gives you a faster route into the problem and helps less experienced team members understand the reasoning behind the analysis.
3. Focus on the slow queries that matter
A query taking a long time does not automatically mean something is wrong. Some queries are naturally expensive. Others only become concerning when their behavior changes.
Fixed thresholds cannot always tell the difference. They can leave you with a long list of “slow” queries, many of which are behaving normally.
Redgate Assistant helps you ask a more useful question:
“Which slow queries actually need my attention?”
Redgate Assistant can use Monitor’s worst queries data to consider execution history, duration, CPU, reads and normal workload patterns rather than judging every query against the same threshold. It can also consider execution frequency and likely impact, helping distinguish an occasional expensive query from one repeatedly placing pressure on the system.
The result is a shorter, more useful list. Redgate Assistant can rank the findings and explain the evidence behind them, giving you a clearer sense of where your time will have the greatest effect.
4. Trace blocking to its source
When sessions begin blocking one another, the visible symptoms do not always reveal the source. A blocking chain may involve several sessions, and identifying the session at the top can be difficult while users and applications are waiting.
Instead of reading the blocking information cold, you could ask:
“What is causing this blocking chain?”
A blocking analysis capability being developed for Redgate Assistant is designed to bring together the blocking chain, the queries involved, their execution plans and the resources being contested. It will help identify the head blocker, show which sessions are being held up and explain how long they have been waiting.
Rather than manually reconstructing the chain, you begin with an organised explanation of what is happening and where the problem appears to originate. You can then assess the wider impact and decide what action is safe for your environment.
5. Move from diagnosis to a recommendation you can review
Finding the problem query is only part of the job. You then need to decide how to improve it, and optimization suggestions should be reviewed rather than accepted automatically.
Once Redgate Assistant has diagnosed a query, you can ask:
“How could I improve this query?”
It can recommend specific changes and explain their expected effect. That might mean changing a predicate, investigating an index or rewriting part of the query. You can put a recommendation back into the conversation and ask what it involves, why it should improve performance, or how to implement it.
If you also use SQL Prompt, the investigation can continue in SQL Server Management Studio. Redgate Assistant can carry the context across, load the relevant optimization skill and help produce an improved version of the query without making you explain the problem again.
The more advanced Optimize Query capability being developed for Monitor is intended to bring more of this workflow into the investigation itself. It can examine the execution plan, statistics, schema, and workload context, then propose a rewrite or recommend an index change. For a proposed rewrite, it can compare the estimated execution-plan cost with the original.
That comparison is an initial performance check, not proof that the rewrite is functionally correct. Nothing is applied to production without your approval. You validate the recommendation and decide whether it is appropriate for your system.
A new way to investigate with Redgate Monitor
Redgate Assistant is not another dashboard. It is a new way to work with the performance data Redgate Monitor already collects.
Your alerts, metrics, queries, waits, execution plans and performance history are already in Monitor. Redgate Assistant brings that context into one conversation, helping you move from “something is wrong” to a clearer understanding of why—and what you could do next.
If you subscribe to Redgate Monitor, you can start using Redgate Assistant directly in Monitor. See how it turns a performance problem into an evidence-backed action plan in this interactive demo.
For organizations using a supported AI tool, the Monitor MCP Server offers another option. It provides secure, read-only and auditable access to information such as Monitor metrics, top queries and estate inventory, allowing teams to investigate Monitor data from a compatible AI environment.
This document contains proprietary information and is protected by copyright law.
Copyright © 2026 Red Gate Software Limited. All rights reserved
Tools in this post
You may also like

Article
Five practical ways Redgate Assistant helps DBAs get to the answer faster
An alert is the most useful if it helps you decide what to do next. Redgate Monitor gives you the information you need to understand what is happening across your estate: alerts, metrics, queries, waits, execution plans and performance history. But during an investigation, the difficult part is rarely finding more data. It is working out which signals matter, how they relate and where to begin. What is Redgate Assistant? Redgate Assistant is AI built directly into Redgate’s database tools. In Monitor, it lets you investigate performance problems using natural-language questions and the context Monitor already holds. It brings together relevant
Article
Redgate Assistant and the path to Autonomous Operations
Ask an AI assistant to explain why a query is running slowly and it can help a database professional reach an answer faster. Give that same assistant the ability to change the database and the stakes change. The closer AI gets to taking action, the greater the consequences of incomplete context, inappropriate access or an incorrect decision. AI adoption in database management is already accelerating. Redgate’s 2026 State of the Database Landscape research found that 44% of organizations now use AI for database management, compared with 15% a year earlier. The value is becoming clearer too. Among organizations already using AI
Article
Build vs Buy in the Age of AI
Every DBA has a toolbox they trust that often includes a folder of scripts refined over a decade, mostly a handful of DMV queries. These queries answer “what’s slow right now” faster than any dashboard, and a working knowledge of the environment that took years to build. So, when a new AI tool promises to answer the same questions in plain English, the first reaction is usually suspicion rather than excitement. That suspicion should be expected, but it also means a lot of DBAs are making an unspoken decision without really weighing in and kicking the tires. There’s a comfort to
Loading comments...