Set up Redgate pgNow Activity Monitoring on Azure Database for PostgreSQL Flexible Server
This article is a QuickStart setup guide for Redgate pgNow activity monitoring on Azure Database for PostgreSQL Flexible Server. Once you’ve completed the setup, you can start using live query activity, health, and performance data to troubleshoot current issues on your PostgreSQL instances, all without writing any SQL scripts.
Redgate pgNow is a free activity monitoring tool for your PostgreSQL instances, wherever they are running. It connects directly to the server and presents live diagnostic data, making it easy to see what’s running right now on any monitored instance. It collects data using PostgreSQL’s standard performance extension, pg_stat_statements, along with system views such as pg_stat_activity.
To use pgNow with Azure Database for PostgreSQL Flexible Server, you’ll first need to enable the pg_stat_statements extension, which is off by default. It’s quick to configure, either through the Azure portal or using the AZ CLI. I’ll walk you through the process so you can connect pgNow to your Azure Flexible Server and start troubleshooting live performance issues as quickly as possible.
pgNow is currently in public preview, so we would welcome feedback and suggested enhancements, which you can send directly from the pgNow app.
What makes pgNow so useful?
Redgate pgNow combines live session data from system views like pg_stat_activity with time-sliced workload analysis based on pg_stat_statements. As soon as you connect pgNow to your server, you’ll instantly see which applications are connected to which databases, what queries they are running, whether any are over-consuming resources or blocking other sessions, and more.
As well as live troubleshooting troublesome queries, pgNow will also help you detect:
- Sub-optimal autovacuum settings – the defaults on Azure Flexible Server don’t always suit every workload and can cause bloated tables or transaction wraparound risk. pgNow will surface these issues early.
- Inefficient indexing – pgNow assesses index efficiency in the context of your current workload, giving a much faster view than waiting for Azure’s built-in recommendations.
- Connection pool exhaustion / max connections reached – the default Azure Flexible Server tiers have relatively low connection limits. pgNow can show if connections are being starved, or if the app is opening too many sessions.
If you wanted to replicate all this by hand, you’d need to write multiple queries, collect data at set intervals, save it, and calculate the deltas to produce live query statistics. It’s a lot of effort. Instead, whenever someone complains that “the database is running slow,” you can simply open pgNow and instantly review live performance diagnostics.
Real-time diagnostics only
pgNow gives you real-time diagnostics while connected. It doesn’t retain historical data; once you close the app, the data is gone. To diagnose past problems, compare baselines, and track trends over time, you need a more comprehensive tool like Redgate Monitor, which continuously collects, stores, and analyzes PostgreSQL activity at a deeper level.
Download pgNow and connect to Azure Flexible Server
If you haven’t already done so, you can download pgNow from here. This guide assumes you already have an Azure Database for PostgreSQL Flexible Server instance running in your Azure subscription.
When you start pgNow, you’ll see a connection dialog where you enter the server name, port, database name, and user credentials. pgNow builds a standard PostgreSQL connection string from these details and connects to the server.
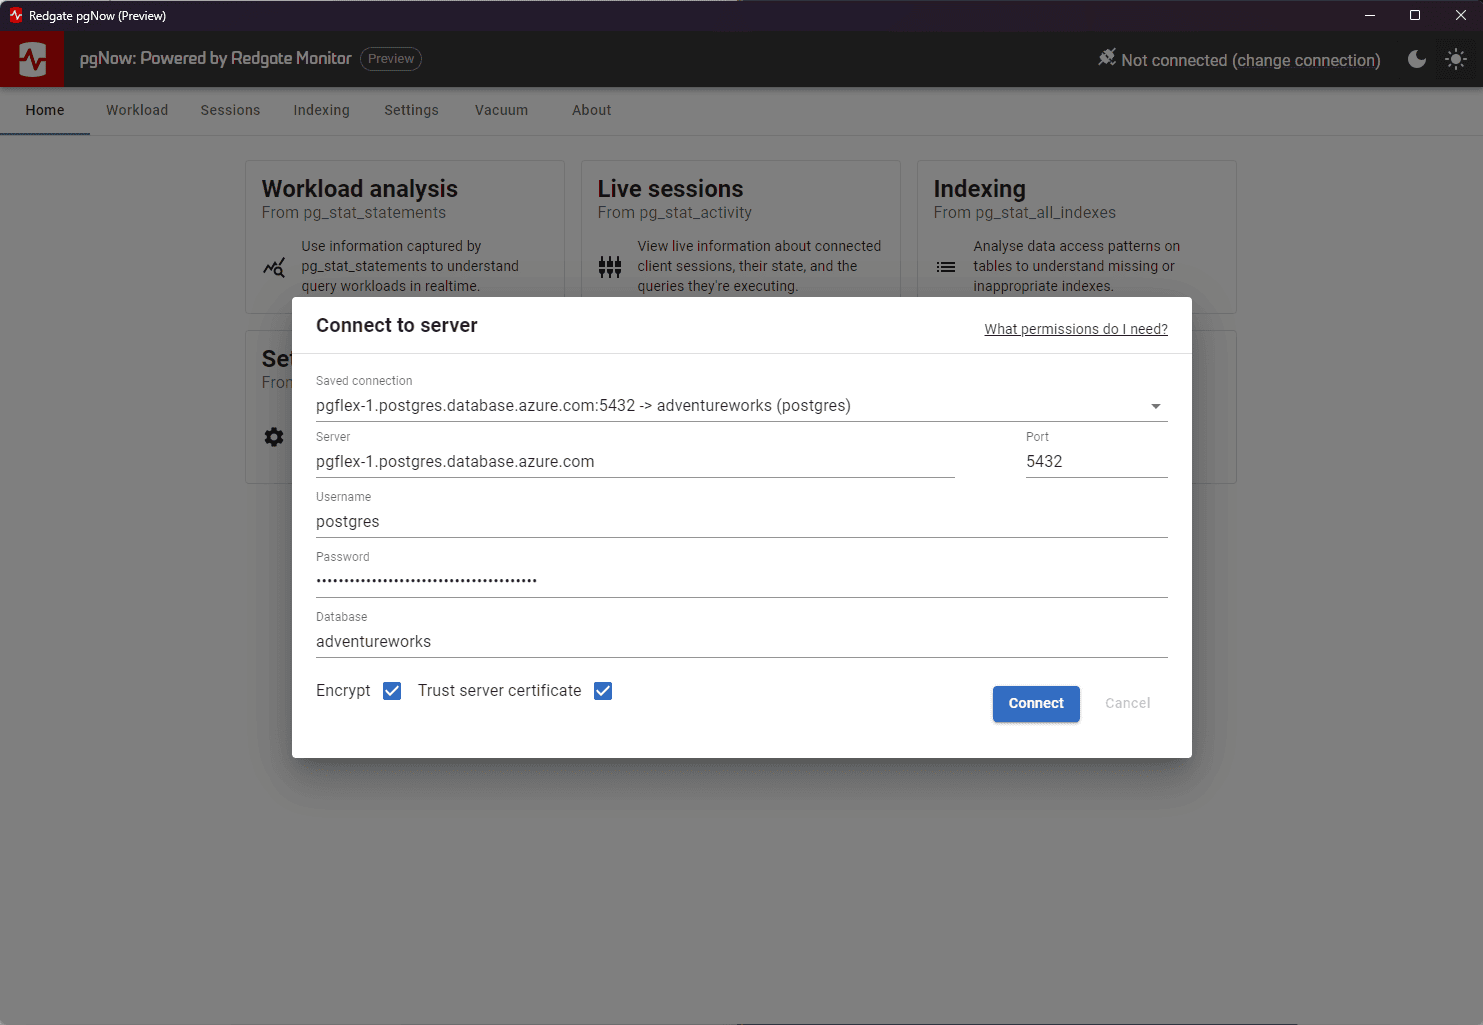
At this point, if you navigate to the Workload tab, you’ll see a notification telling you that the pg_stat_statements extension needs to be enabled. So, let’s get configuring.
Enable pg_stat_statements in Azure Flexible Server
On a standard PostgreSQL instance, you would enable pg_stat_statements by editing the postgresql.conf file to add the extension to the shared preload libraries:
shared_preload_libraries = 'pg_stat_statements'
However, because Azure Database for PostgreSQL Flexible Server is a managed PaaS service, you can’t edit the config files directly. Instead, here’s what you need to do:
- Add
pg_stat_statementsto the shared library and set the required server parameters - Enable
track_io_timing(optional) - Create the
pg_stat_statementsextension in your database
Step 1: Add pg_stat_statements and set the required server parameters
I’ll show how to do this in either the Azure portal or the AZ CLI.
In the Azure portal…
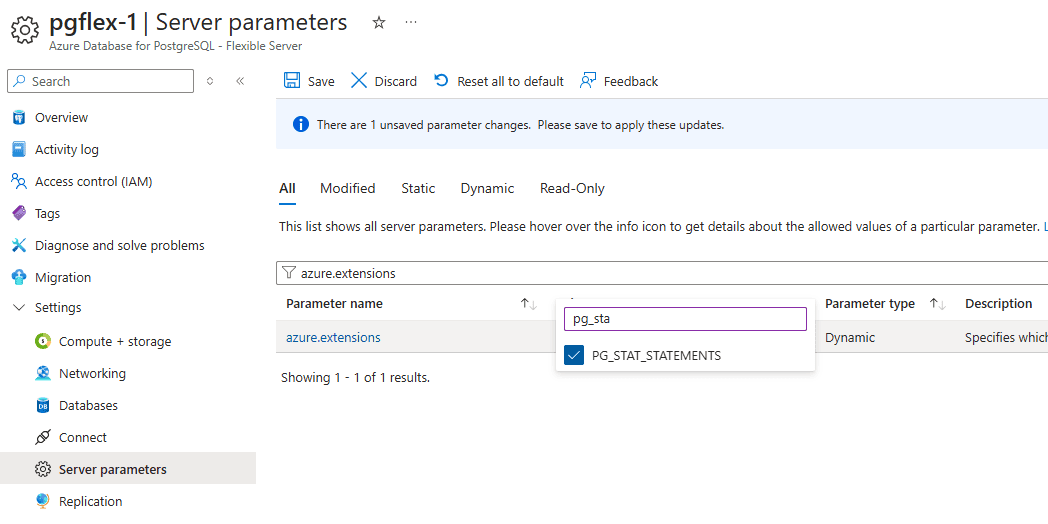
Go to your Flexible Server instance and click Server parameters in the left-hand menu. Filter the list to find the azure.extensions parameter, search the list of values for pg_stat_statements and select it to add it to the list of permitted extensions.
This adds pg_stat_statements to the shared_preload_libraries, but now we need to configure tracking. Still in Server Parameters, filter the list to show only the pg_stat_* parameters and set the pg_stat_statements.track parameter to ALL, to start collecting stats for all statements, including utility commands. You might opt to use TOP if it’s more appropriate for your environment (if your server is very busy or you only want to track user queries):
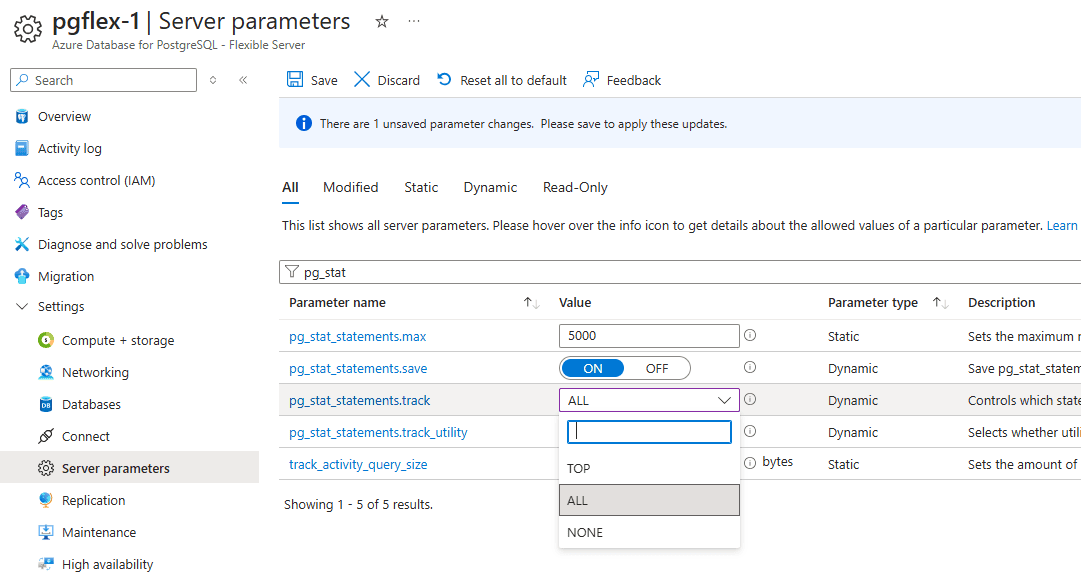
At the time of writing, Azure Flexible Server for PostgreSQL does not support enabling the pg_stat_statements.track_planning setting. This means you won’t see plan timings in the pgNow Workload tab.
After making these parameter updates, click Save.
In the AZ CLI…
You can run the same steps in the AZ CI. First, add pg_stat_statements to the available extensions:
az postgres flexible-server parameter set \
  --resource-group rg-pgnow-1 \
  --server-name pgflex-1 \
  --name azure.extensions \
  --value pg_stat_statements
Warning: This command will overwrite the existing configuration, so if you have other extensions like pg_cron enabled, be sure to include them in the value list to avoid them being accidentally removed!
Then set the tracking level:
az postgres flexible-server parameter set \
  --resource-group rg-pgnow-1 \
  --server-name pgflex-1 \
  --name pg_stat_statements.track \
  --value all
Step 2 (optional): Enable IO timings
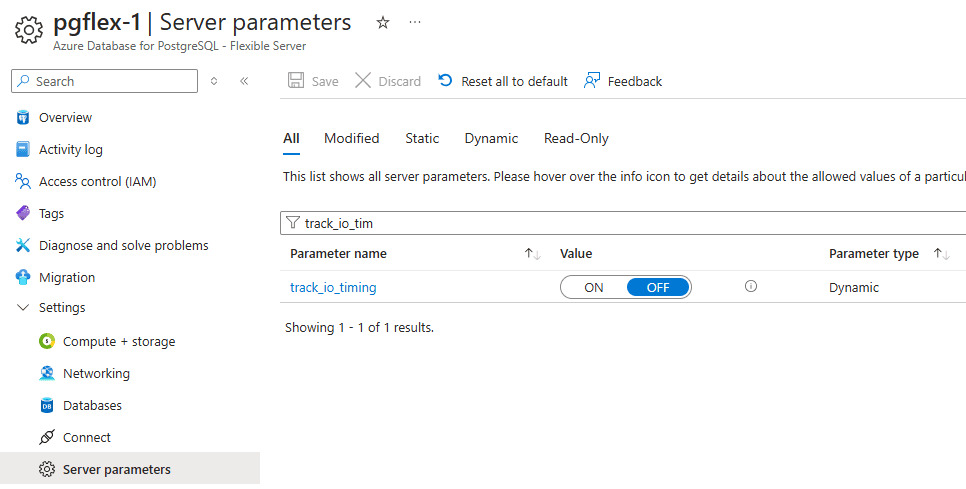
If you also want pgNow to collect IO timing information (such as block read and write times), you need to enable the track_io_timing server parameter, as it is off by default on Azure Flexible Server.
In the Server parameters section of Azure portal, search for track_io_timing and set it to ON:
Or in AZ CLI, run:
az postgres flexible-server parameter set \
  --resource-group rg-pgnow-1 \
  --server-name pgflex-1 \
  --name track_io_timing \
  --value on
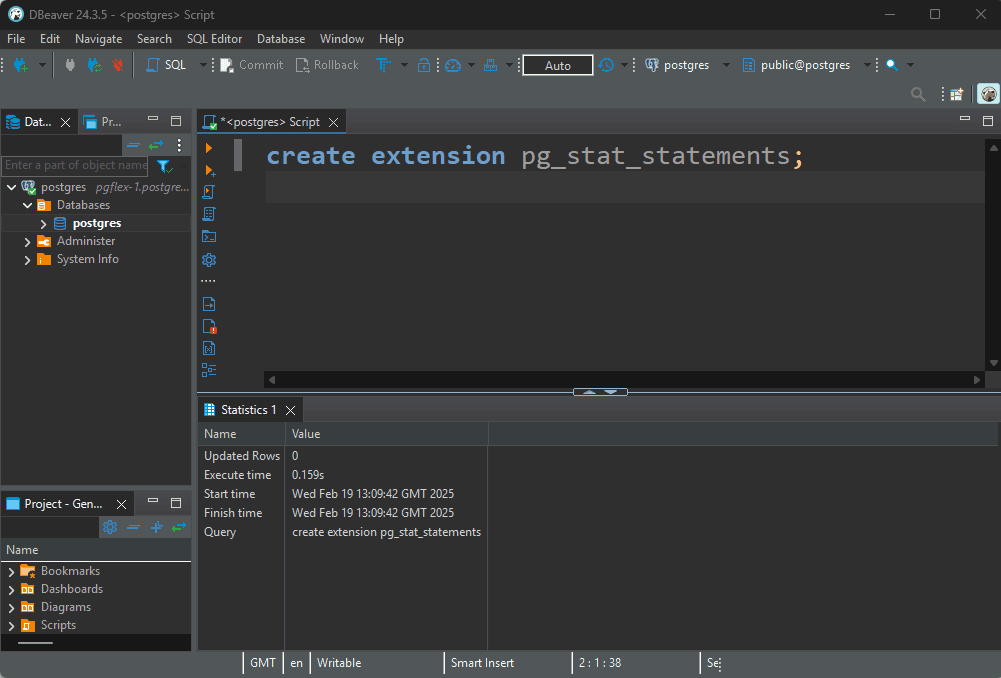
Step 3: Create the pg_stat_statements extension in your database
At this point, if you return to pgNow, you’ll see that some setup steps are complete, but Step 2 (“Create the extension in the connected database”) is still not done. That’s because the extension library is now available at the server level, but you still need to create the extension objects (views, functions) inside each database. To do this, connect to the database from your IDE or pgAdmin and run:
|
1 |
CREATE EXTENSION pg_stat_statements; |
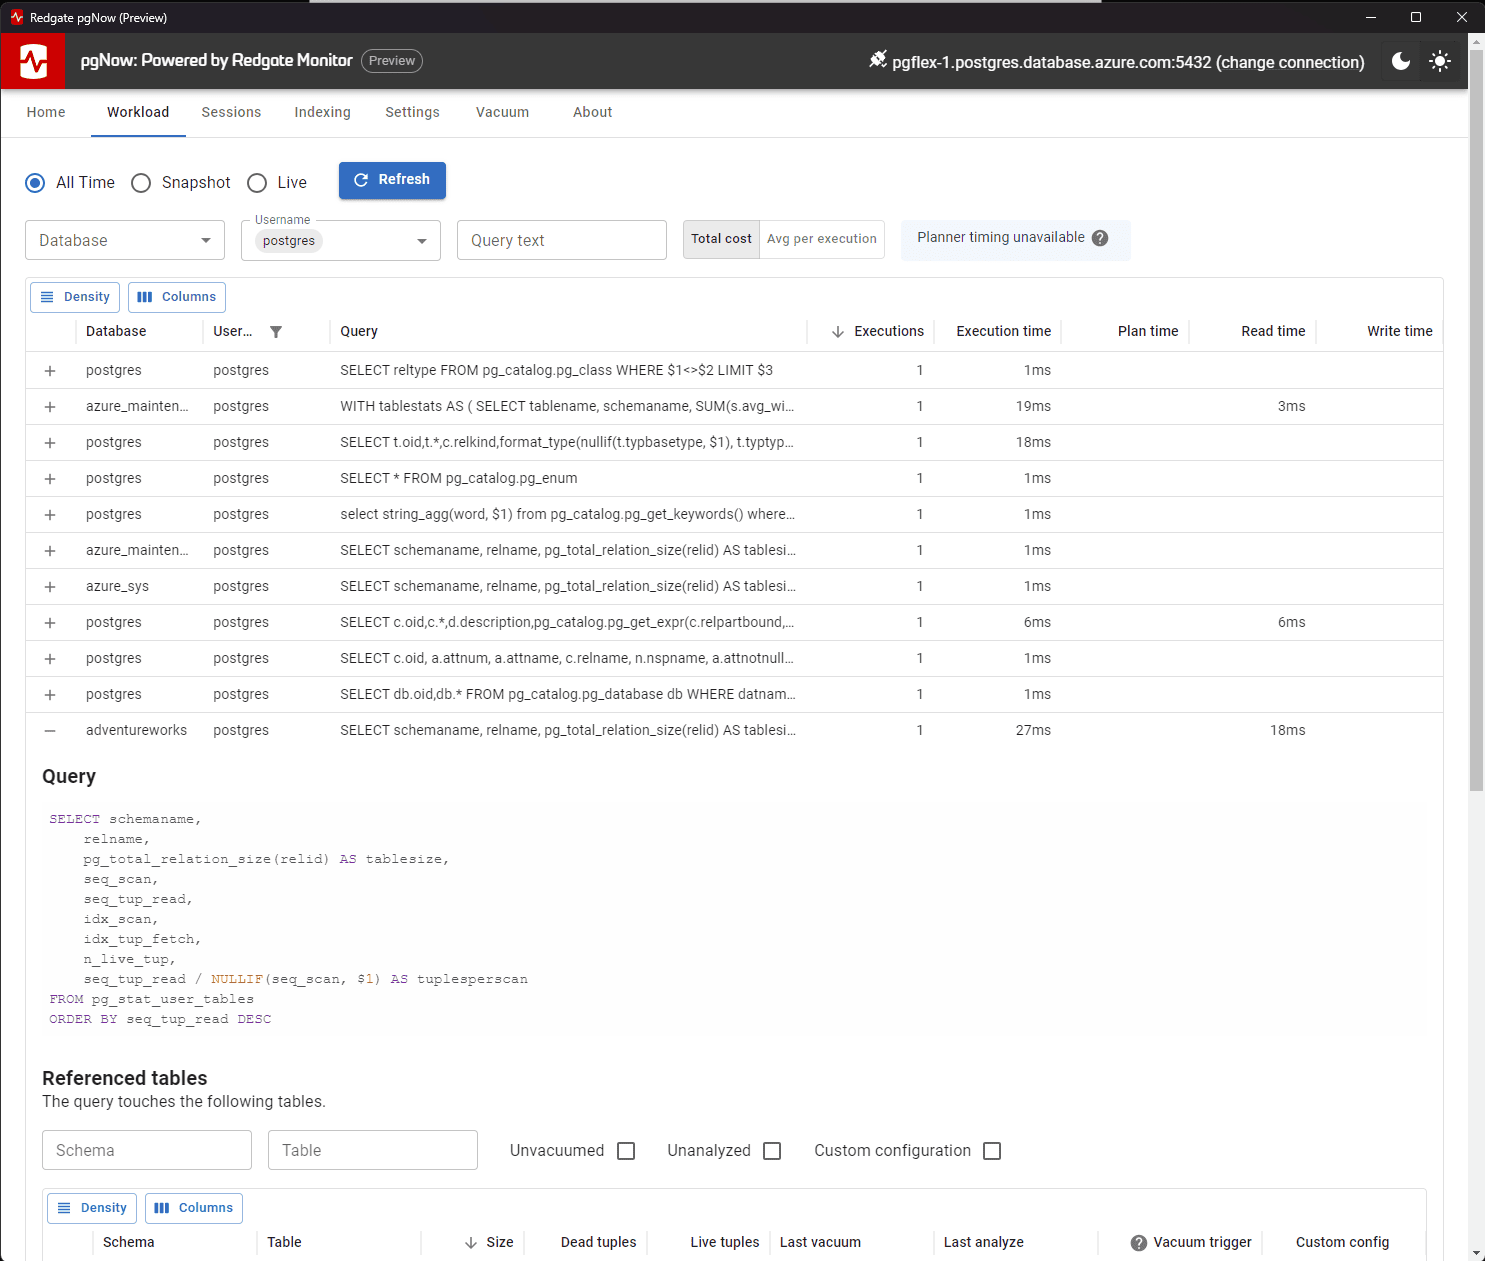
Get started with pgNow
Once you’ve completed these steps, return to pgNow. You should now see query statistics, execution plans and IO timings in the Workload tab. You’re ready to start live troubleshooting!
Summary
In this article, we stepped through how to configure Azure Database for PostgreSQL Flexible Server to work with pgNow. It only takes a few quick changes: enable the required server parameters, enable IO timings (optional), and create the extension in your database.
You can now use pgNow to get instant visibility into query performance, sessions, and live database activity. You can detect inefficient queries, sub-optimal autovacuum settings, connection pool problems, or indexing issues, all without writing any SQL!
Try it now:
Download pgNow and start monitoring live activity on your Azure Flexible Server instances.
Tools in this post
Redgate Monitor
Real-time multi-platform performance monitoring, with alerts and diagnostics
You may also like
-

Customer event
Exclusive SQL Monitor Customer User Group - Europe
We are excited to invite you to be part of Redgate’s inaugural Customer Success Virtual User Group for SQL Monitor. This is an opportunity for you to come together with an exclusive group of peers from across Europe to share your experiences and feedback in an intimate online event. Microsoft Data Platform MVP, Grant Fritchey
-

Article
Redgate Monitor is now available as a fully managed SaaS edition
Database teams are already juggling a lot. Monitoring the performance of complex, multi-platform estates takes expertise and focus — and that's before you factor in installing, maintaining, and updating the monitoring tooling itself.
-
Article
Unearthing Bad Deployments with Redgate Monitor and Redgate's Database DevOps Tools
Sudden performance issues in SQL Server can have many causes, ranging all the way from malfunctioning hardware, through to simple misconfiguration, or perhaps just end users doing things they shouldn't. But one particularly common culprit is when deployments go wrong: I don't know a single DBA who hasn't been burned by a bad release.
-
Article
Troubleshooting Blocking in SQL Server using Redgate Monitor
Redgate Monitor tells us immediately when significant blocking occurs, and where, during busy periods, and provides the full blocking chain, in an easy-to-digest graphical format, so we can diagnose and resolve the blocking quickly.
-

Live training session
What's new in SQL Monitor 11
In this session hear about the improvements we have made in the latest release of SQL Monitor, and a demonstration to show how to fully optimize the tool. Our experts cover monitoring instances hosted on Amazon RDS, monitoring tempdb, performance improvements, and an introduction to the new documentation site for SQL Monitor.