Configuring Amazon Aurora PostgreSQL for Redgate pgNow Activity Monitoring
This article is a QuickStart guide for configuring Amazon Aurora PostgreSQL so you can use Redgate pgNow to view live query activity, health and performance data for your PostgreSQL instances, without writing any SQL scripts.
Redgate pgNow (currently in Early Access Preview) is a free activity monitoring tool designed to make it easy to see what’s happening right now inside your PostgreSQL instances.
It connects directly to the server and presents live diagnostic data, using information from PostgreSQL’s standard performance extension, pg_stat_statements, as well as system views like pg_stat_activity.
If you want to use pgNow with Amazon Aurora PostgreSQL, there’s just one configuration step to enable the pg_stat_statements extension, which is off by default in Aurora clusters. It’s not difficult, but you do need to know your way around the AWS console. I’ll walk you through the process so you can connect pgNow to your Aurora cluster and start troubleshooting PostgreSQL performance as quickly as possible.
Why is pgNow useful?
Whenever someone complains that “the database is running slow,” you can open pgNow on your desktop, connect to the server, and instantly review live performance diagnostics that tell you what’s going on right now, without needing to write SQL queries.
Even if you’re comfortable writing queries, pg_stat_statements only stores cumulative totals. You might find online tools or sample queries to calculate averages for particular queries, but pgNow adds time slicing, so you can see live query statistics for current queries.
PgNow’s time-sliced workload analysis, combined with live session data from system views like pg_stat_activity, means you’ll know instantly which applications are connected to which databases, what queries they are running, what resources they are consuming and whether any processes are blocked.
PgNow also performs index analysis, highlighting missing or inefficient indexes, and will also help you troubleshoot configuration issues and autovacuum problems.
It is a client tool that gives you real-time diagnostics only while connected. It doesn’t retain historical data – once you close the app, the data is gone. To diagnose problems from yesterday, calculate baselines, and track performance trends over time, you’d need a more comprehensive tool like Redgate Monitor, which continuously collects, stores, and analyzes PostgreSQL activity at a much deeper level.
Download and connect
If you have not already done so, you can download pgNow from here. This guide assumes you already have an Amazon Aurora PostgreSQL instance running in your AWS account.
When you start pgNow, you’ll see a connection dialog where you enter the server name, port, database name, and user credentials. pgNow builds a standard PostgreSQL connection string from these details and connects to the server.
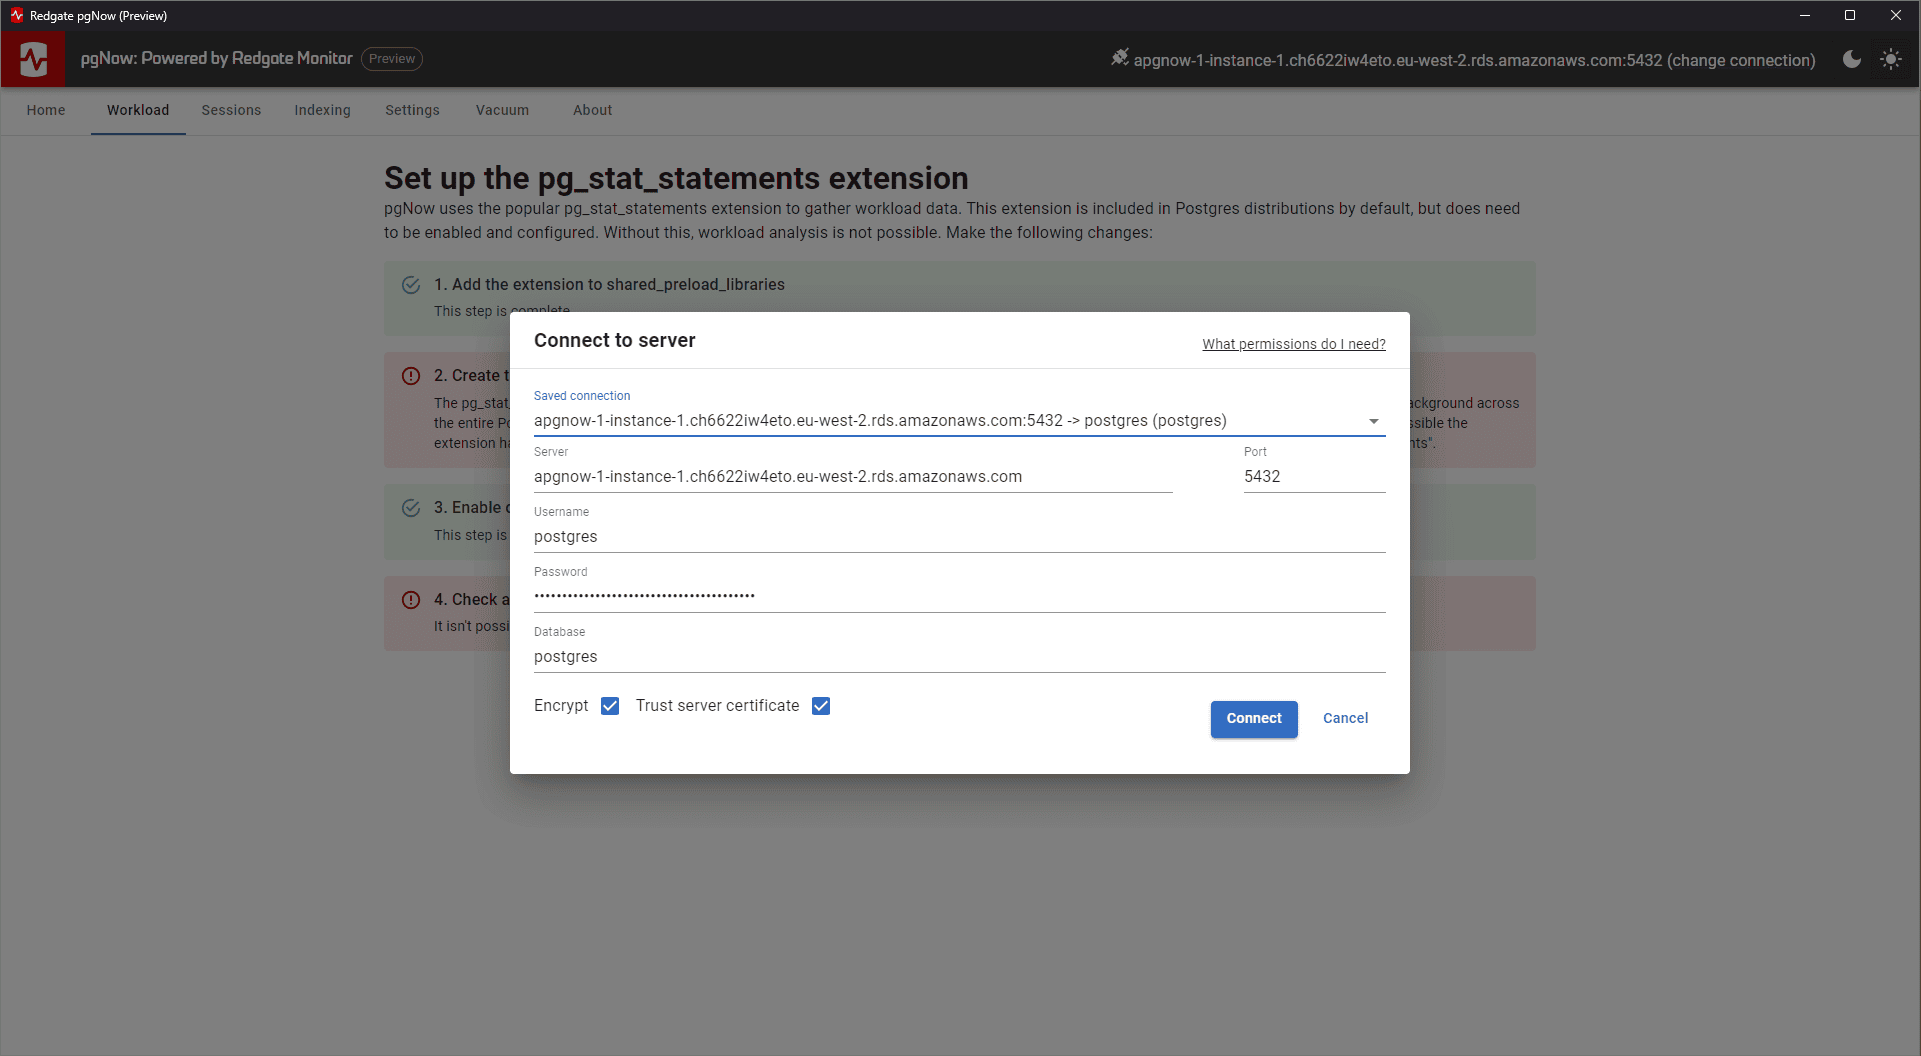
At this point, if you navigate to the Workload tab, you’ll see a notification telling you that the pg_stat_statements extension needs to be enabled.
Enable pg_stat_statements in Amazon Aurora PostgreSQL
On a standard PostgreSQL instance, you enable pg_stat_statements by editing the postgresql.conf file to add the extension to the shared preload libraries:
shared_preload_libraries = 'pg_stat_statements'
However, Amazon Aurora PostgreSQL, as part of the managed Amazon RDS PaaS, doesn’t allow you to edit the config files directly. Instead, here’s what you need to do:
- Create a new RDS Parameter Group
- Set the required parameters to enable
pg_stat_statements - Apply that Parameter Group to your Aurora cluster.
- Create the
pg_stat_statementsextension in the database, as usual.
Step 1. Create the parameter group
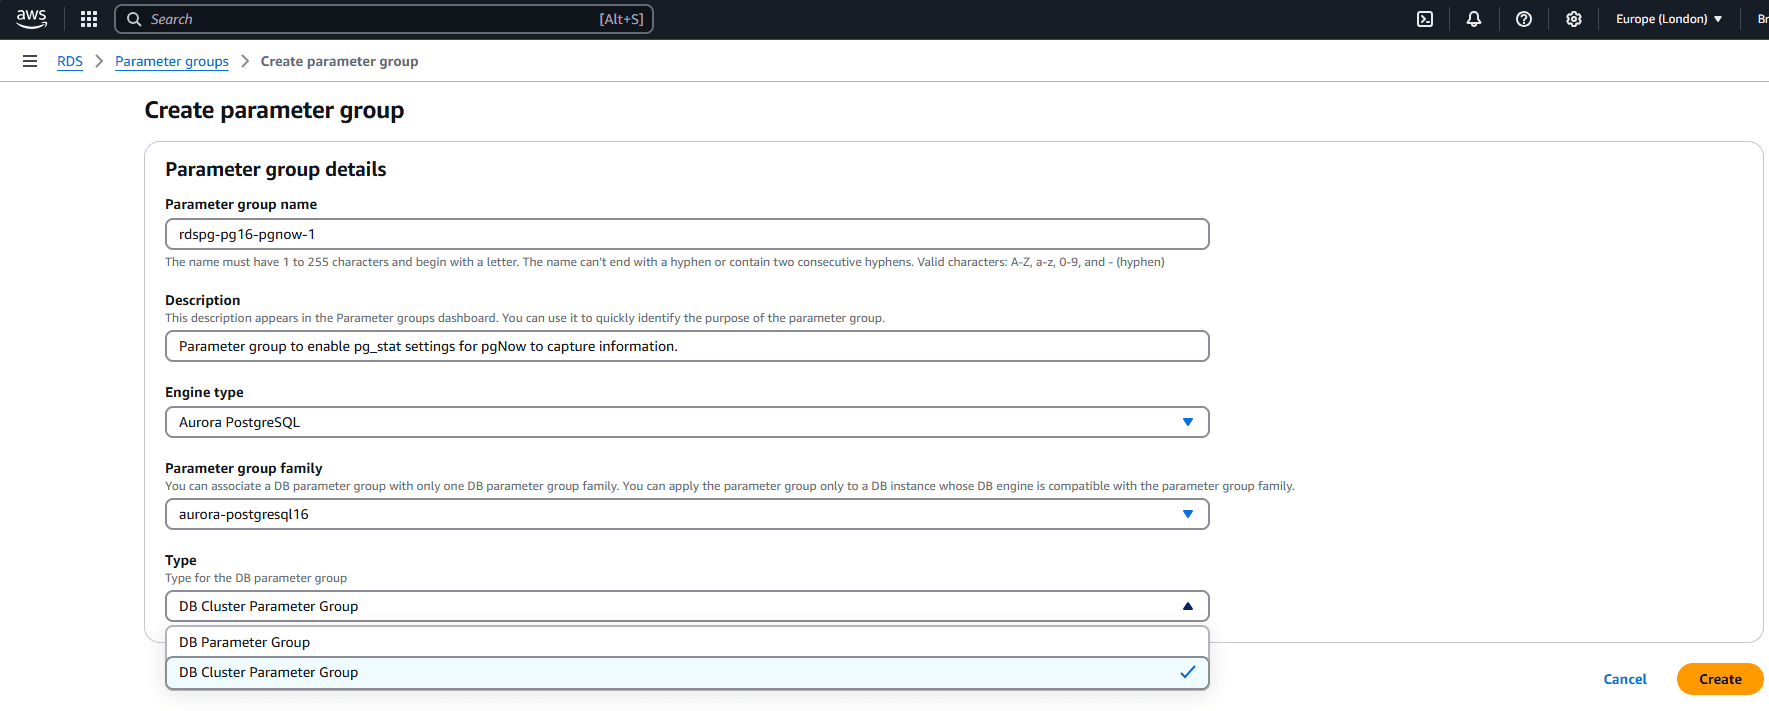
In the AWS console (console.aws.amazon.com), go to RDS, then click Parameter Groups in the left-hand menu and create a new one.
Give it an appropriate name and description. Select the engine type, in this case “Aurora PostgreSQL“, and choose the parameter group family for your PostgreSQL version, which is “aurora-postgresql16” in my case.
Next, choose whether to create a cluster-level or instance-level Parameter Group. For this setup, it’s best to create a cluster-scoped Parameter Group. This ensures the settings apply to all instances in the cluster, including any replicas you may add later.
Having created the Parameter Group, we can configure the parameters needed for pgNow to read performance data.
Step 2. Enable the pg_stat_statements parameters
Select your new parameter group and click “edit”. You’ll see a long list of modifiable parameters. Filter the list to find pg_stat parameters and set the pg_stat_statements.track parameter to ALL, to start collecting stats for all statements, including utility commands. You might opt to use TOP if it’s more appropriate for your environment (e.g. very busy servers or if you are only interested in user queries).
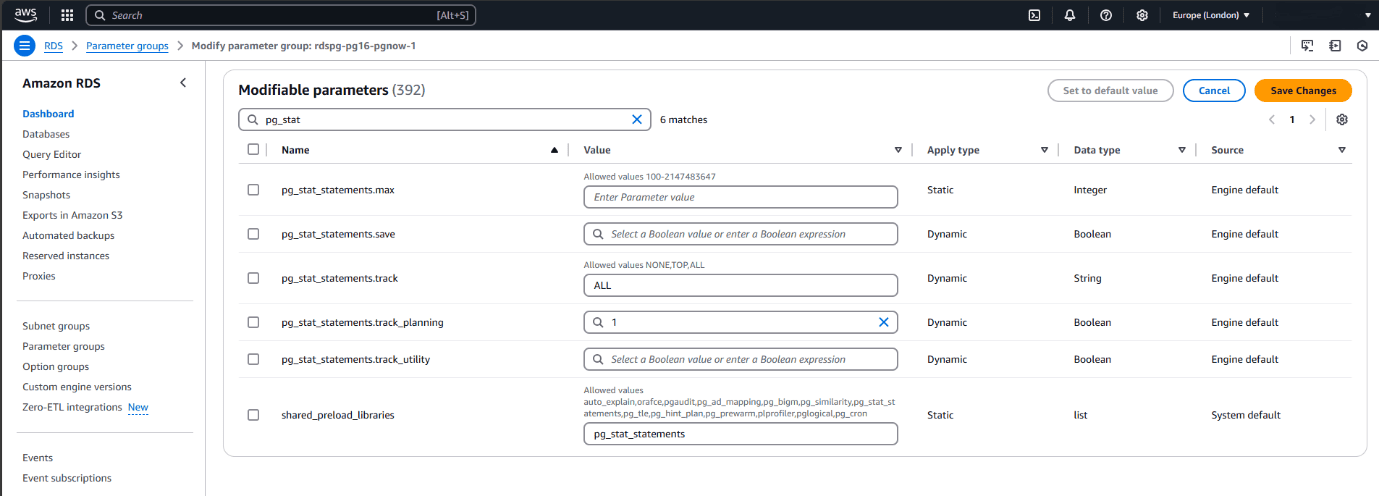
You can also set the pg_stat_statements.track_planning parameter to 1 if you want plan timings. Be aware that this can introduce some performance overhead, so review whether it’s appropriate for your environment.
Getting IO timings
In standard PostgreSQL instances, you would also need to enable the track_io_timing server parameter to collect IO timing information (such as block read and write times). However, in Amazon Aurora PostgreSQL, this parameter is on by default, so there’s no need to add it to the Parameter Group
After making these changes, click Save changes to update the Parameter Group.
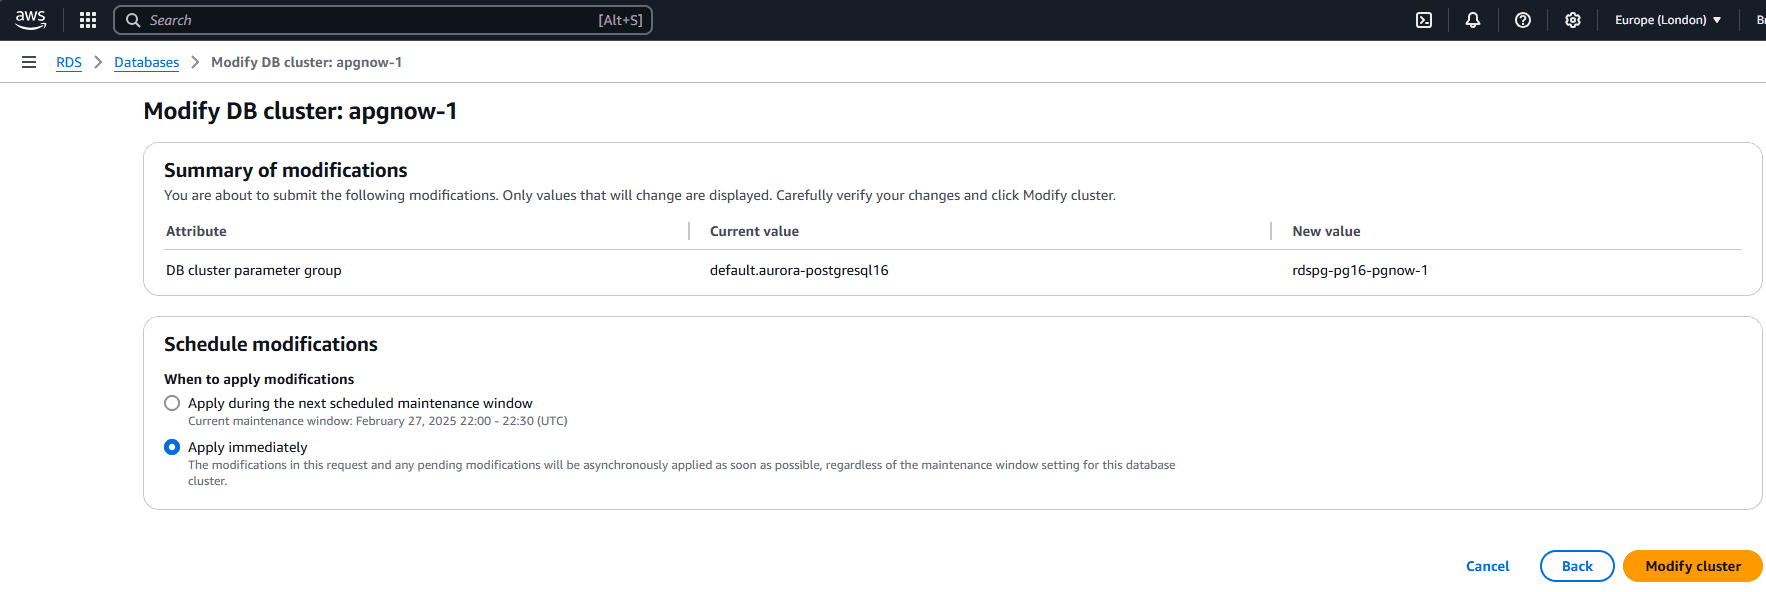
Step 3. Apply the parameter group to the Amazon Aurora cluster
At this point, you’ve created and configured the Parameter Group, but it’s not yet associated with your Aurora cluster. To apply it:
- In the AWS console, return to the RDS section and select your Aurora cluster.
- Click Modify.
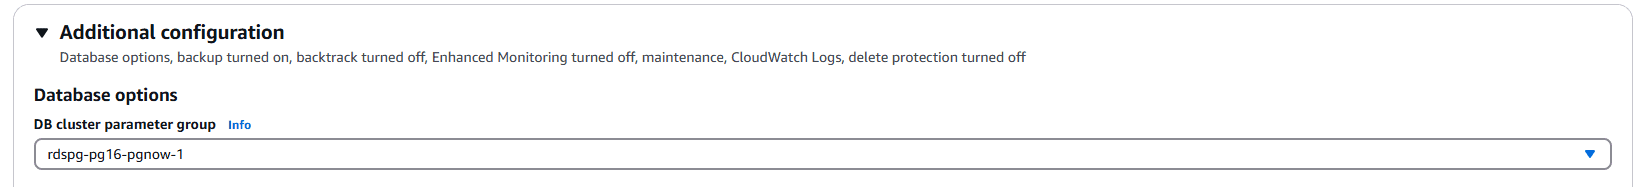
- In the Additional configuration section (at the bottom of the page), select the DB cluster parameter group you created earlier.
- Choose whether to apply the change immediately or during the next maintenance window.
Step 4. Create pg_stat_statements in your database
At this point, if you return to pgNow, you’ll see that after applying the Parameter Group, Steps 1 and 3 of the set up are complete. However, step 2 (“create the extension in the connected database“) is not.
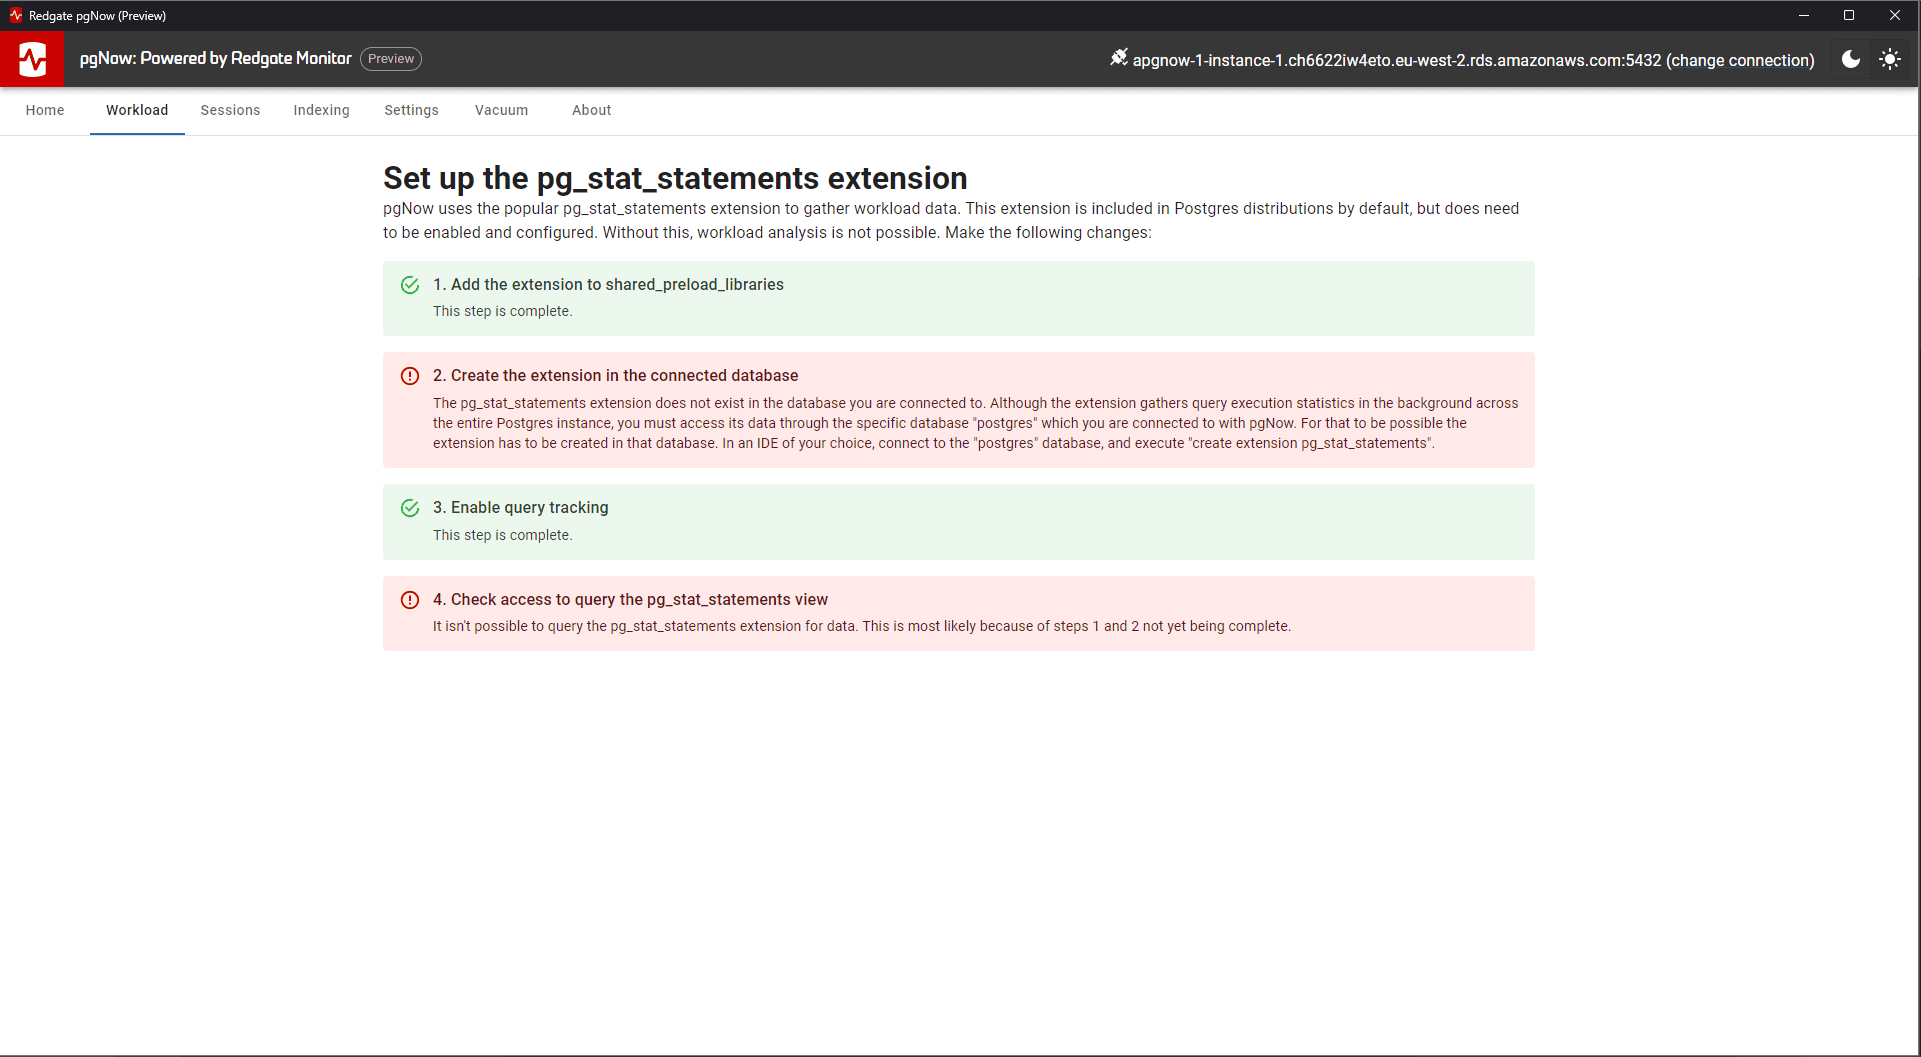
That’s because the extension library has been loaded at the cluster level (via shared_preload_libraries), but you still need to create the pg_stat_statements extension objects (views, functions) inside each database.
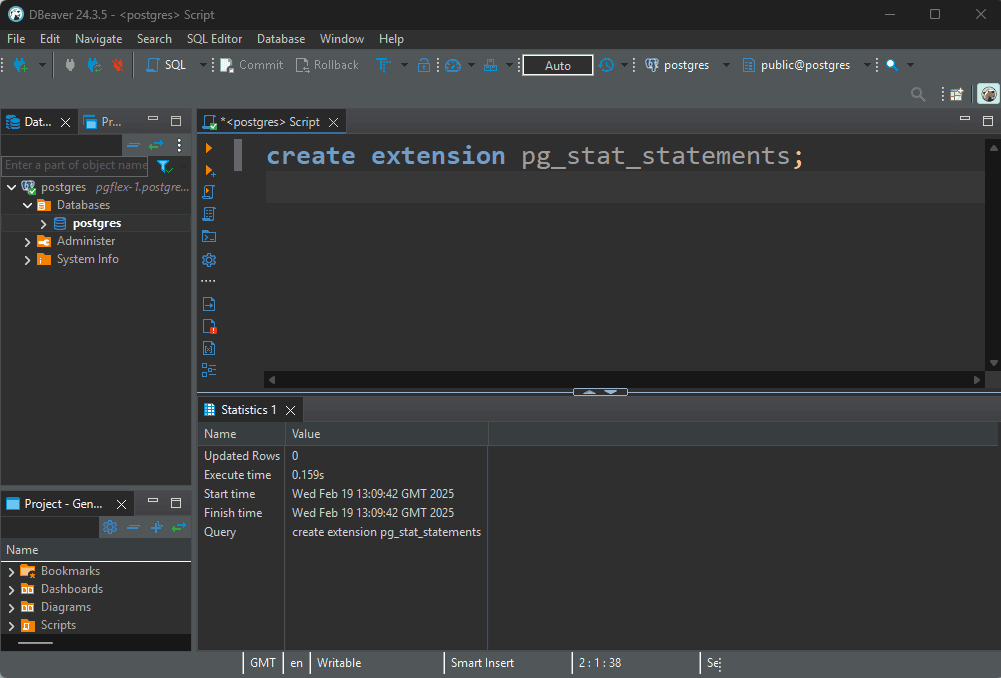
To do this, simply connect to the database from your IDE of choice and create the extension, like this:
|
1 |
CREATE EXTENSION pg_stat_statements; |
Get started with pgNow
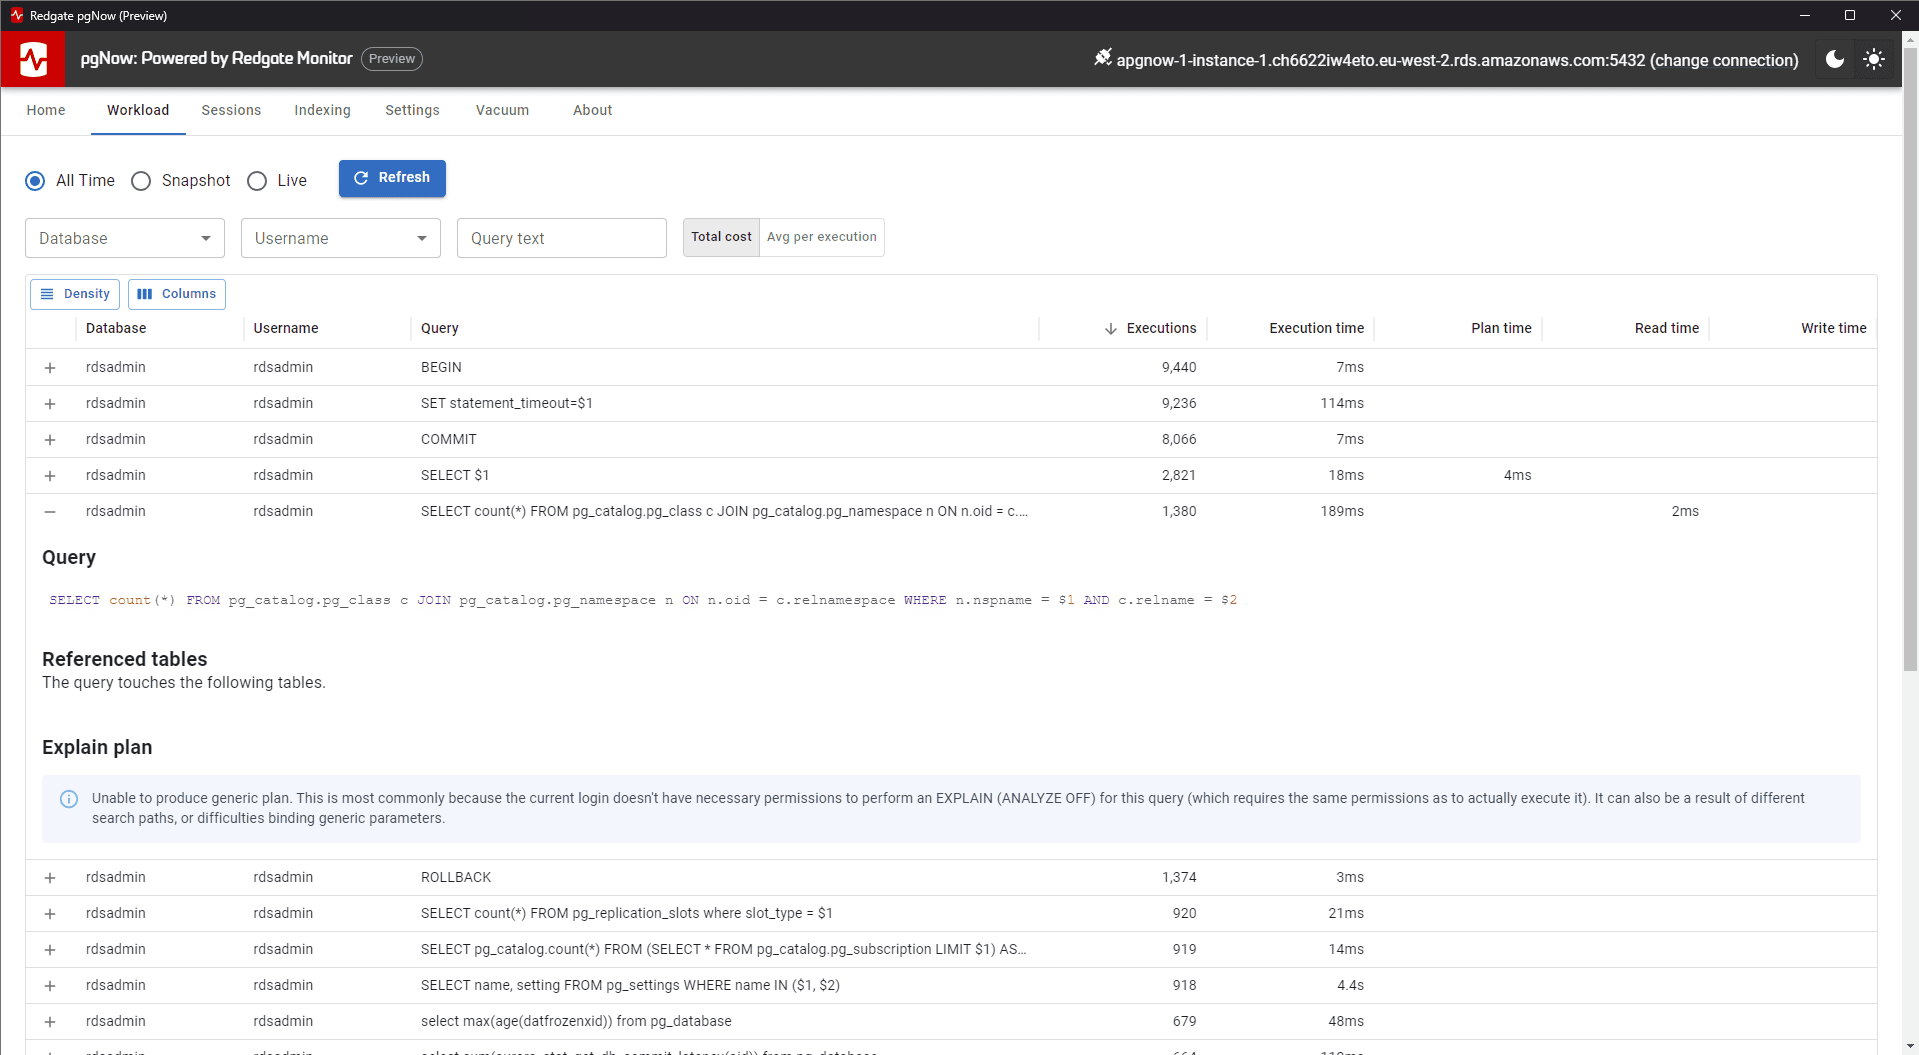
Once you’ve completed these steps, return to pgNow. You should now see query statistics, execution plans, and IO timings in the Workload section.
You’re ready to start live troubleshooting!
Summary
In this article, we stepped through how to configure Amazon Aurora PostgreSQL to work with pgNow. It only takes a few quick changes: create a Parameter Group to enable pg_stat_statements, apply it to your Aurora cluster, and create the extension in the database.
Once done, you can use pgNow to get instant visibility into query performance, sessions, and database activity, as well as optimizing configuration settings and checking vacuum health. All without writing any SQL!
Try it now:
Download pgNow and start monitoring live activity on your Aurora PostgreSQL instances.
Tools in this post
Redgate Monitor
Real-time multi-platform performance monitoring, with alerts and diagnostics
You may also like
-

Article
Database Monitoring for Developers
Database monitoring is an essential part of database development and testing because it will reveal problems early and allow you to drill down to the root cause, as well as look for any worrying trends in behavior of the database, when under load. If you are delaying doing this until a database is in production, you're doing it wrong.
-
Article
Is Tempdb Causing a Bottleneck?
One of your SQL Server instance shows a major dip in performance or throughput, affecting all the user databases. You notice that the slow interludes coincide, as if orchestrated. On investigation, it appears that several transactions running over that period were using a lot of space in tempdb. However, which of them, if any, are causing the tempdb bottleneck, and why?
-
Article
Monitoring and Troubleshooting Deadlocks with Redgate Monitor
This article explains what SQL Server deadlocks are, why they occur, why they require immediate investigation, and the diagnostic data required to troubleshoot them. It then demonstrates an "Update Order" deadlock condition and shows how to find the cause quickly, in Redgate Monitor, using the Extended Events deadlock graph provided by the deadlock alert.
-
Live training session
Level up your database insights | Identify and diagnose the impact of your deployments with SQL Monitor
In this 30-minute training session, Redgate Solutions Engineer David Ong will show how you can build insights and understand your server performance in an instant with fast deep-dive analysis using SQL Monitor.
-
Webinar
Healthcare Industry Panel: Breaking down silos in database operations
Breaking down silos in healthcare database operations Watch this intimate sit-down with three leading healthcare organizations as we explore how Redgate Monitor has been instrumental in unifying teams in database operations. This webinar provides a unique opportunity to hear firsthand from Johns Hopkins Hospital, HCA Healthcare, and Sentara Health industry leaders about their journey toward