


Smarter Postgres Monitoring: Compare Queries, Spot Unused Indexes, and Diagnose Waits
Over recent months, we’ve been steadily improving PostgreSQL monitoring in Redgate Monitor, with a singular focus: to help Postgres users diagnose performance problems faster, with less manual investigation. The latest updates and new features tackle this problem in a few different ways:
- Query Compare makes it easier to see why the same query performs differently from one execution to the next.
- The new Databases section gives fast visibility into database-level activity, including index usage and unused indexes.
- Top Waits summarizes the primary reasons why requests are being forced to wait, right alongside the resource and query data needed to trace the source of a slowdown.
- Custom Metrics for PostgreSQL let teams extend that visibility to the checks and KPIs that matter most in their environments.
Query Compare
"Why is this query suddenly running slow?" is a question most DBAs and developers have struggled with, and comparing execution plans is often the quickest way to find the answer. Perhaps the planner chose a different access method or join type, or the same plan returned vastly different row counts depending on the input parameters.
Until recently, comparing plans meant opening two separate tabs side by side: awkward enough on its own, and worse if you’re already juggling multiple browser tabs. To make this easier, we've introduced Query Compare, a feature that lets you view two query execution plans side by side on a single page and inspect their key differences.
To perform query plan comparison: simply expand the accordion of a tracked or top query, select two execution plans, and click the "Compare" button:
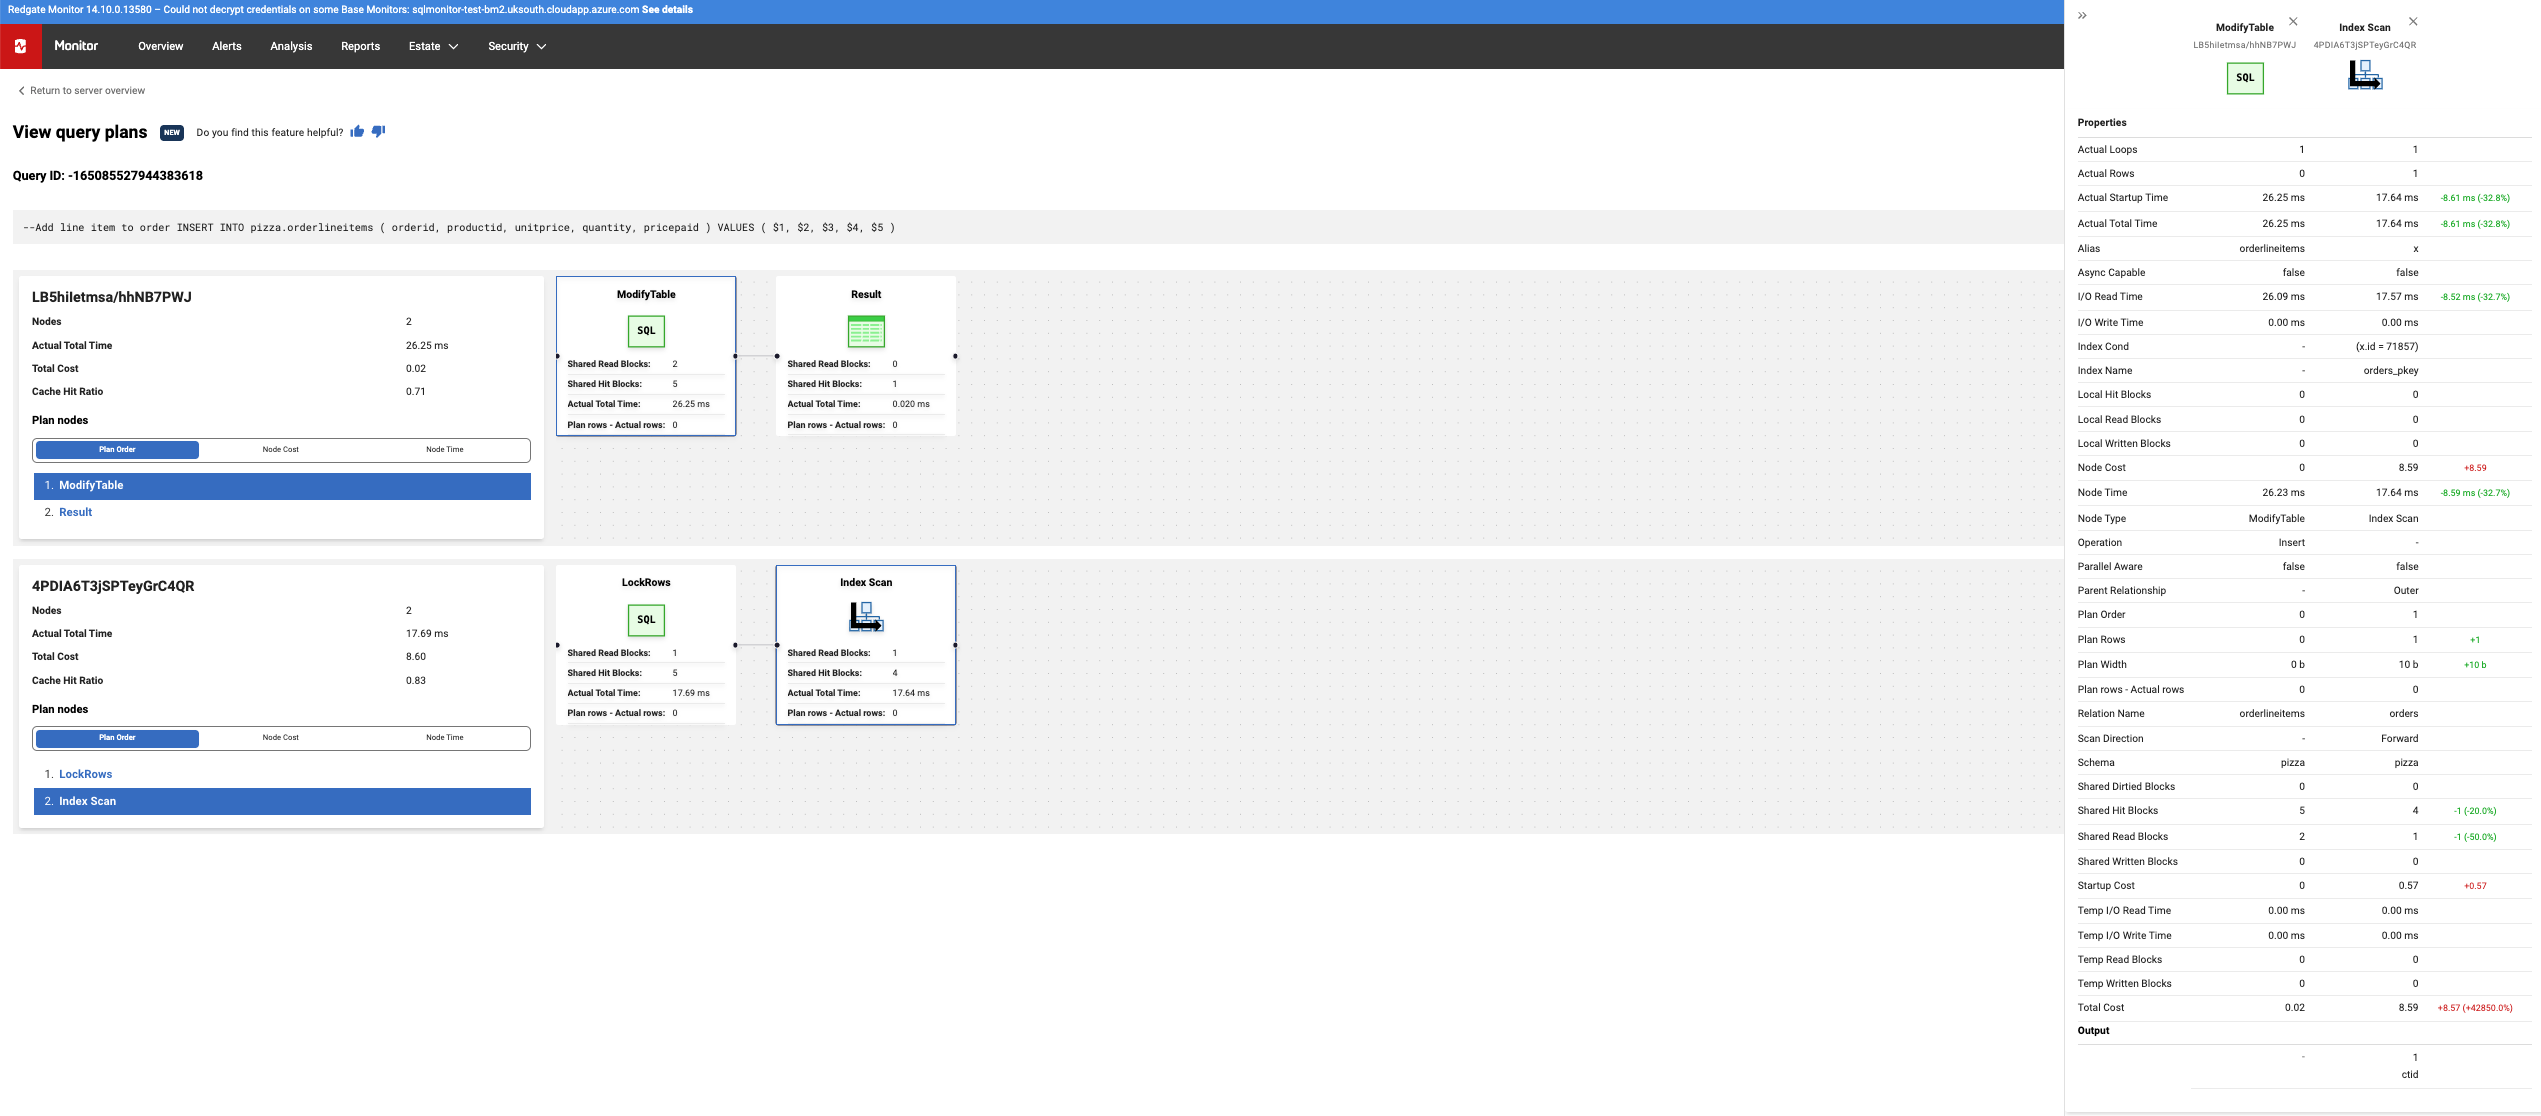
Figure 1: Example of a query execution screen
Query Compare automatically highlights differences between two captured plans side by side, including changes in plan shape, timings, costs, row counts, and block activity. That makes it much easier to see what changed between two executions and focus on the differences most likely to explain the slowdown.
Database-level Insights
We’ve introduced a dedicated Databases section for monitored PostgreSQL instances, giving you a clearer view of each database’s size, activity, and performance. Select the Databases tab at the top of the Server Overview and then click into your chosen database. You'll find a concise summary of database performance, database size, query activity, and index usage, including visibility into unused indexes.
Based on our research with Postgres users, visibility into index performance is a common concern. Without it, unused indexes can quietly accumulate, adding unnecessary write overhead, bloating storage, and slowing down your database. In the following screen, you can quickly see, for example, an index on the pizza.orders table (ix_orders_timereceived) that has never been scanned, despite being 2.11 GB:
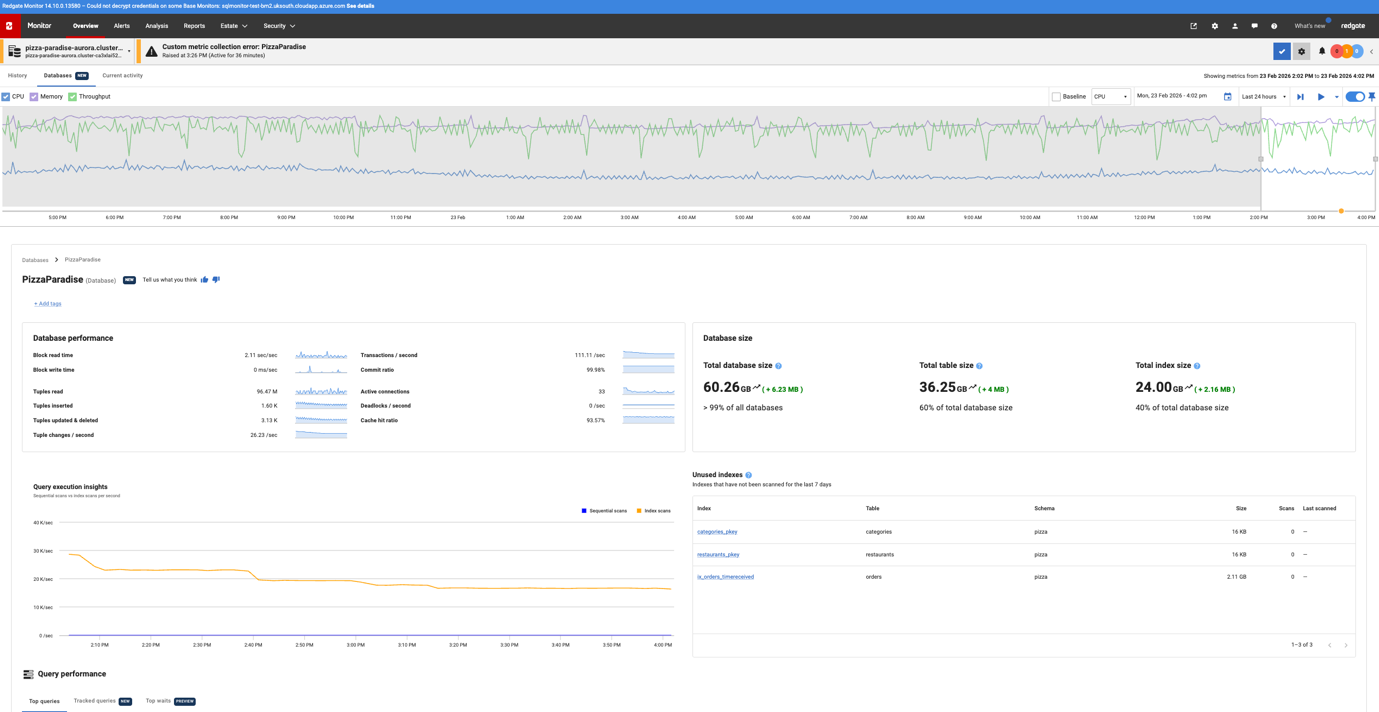 Figure 2: An example of a Database page
From here, you can drill down into individual tables and indexes to see a summary of table and index sizes, how often they are accessed, how they are accessed (e.g., sequential scan versus index scan), plus recent vacuum activity.
In the following screen, we're examining the pizza.orders table in more detail. It has three indexes, including ix_orders_timereceived, which is unused but is causing extra write overhead and consumes 2.11 GB on a 21 GB table. The other two indexes are actively used, so this view makes it much easier to see which indexes are earning their keep and which may be candidates for review or removal.
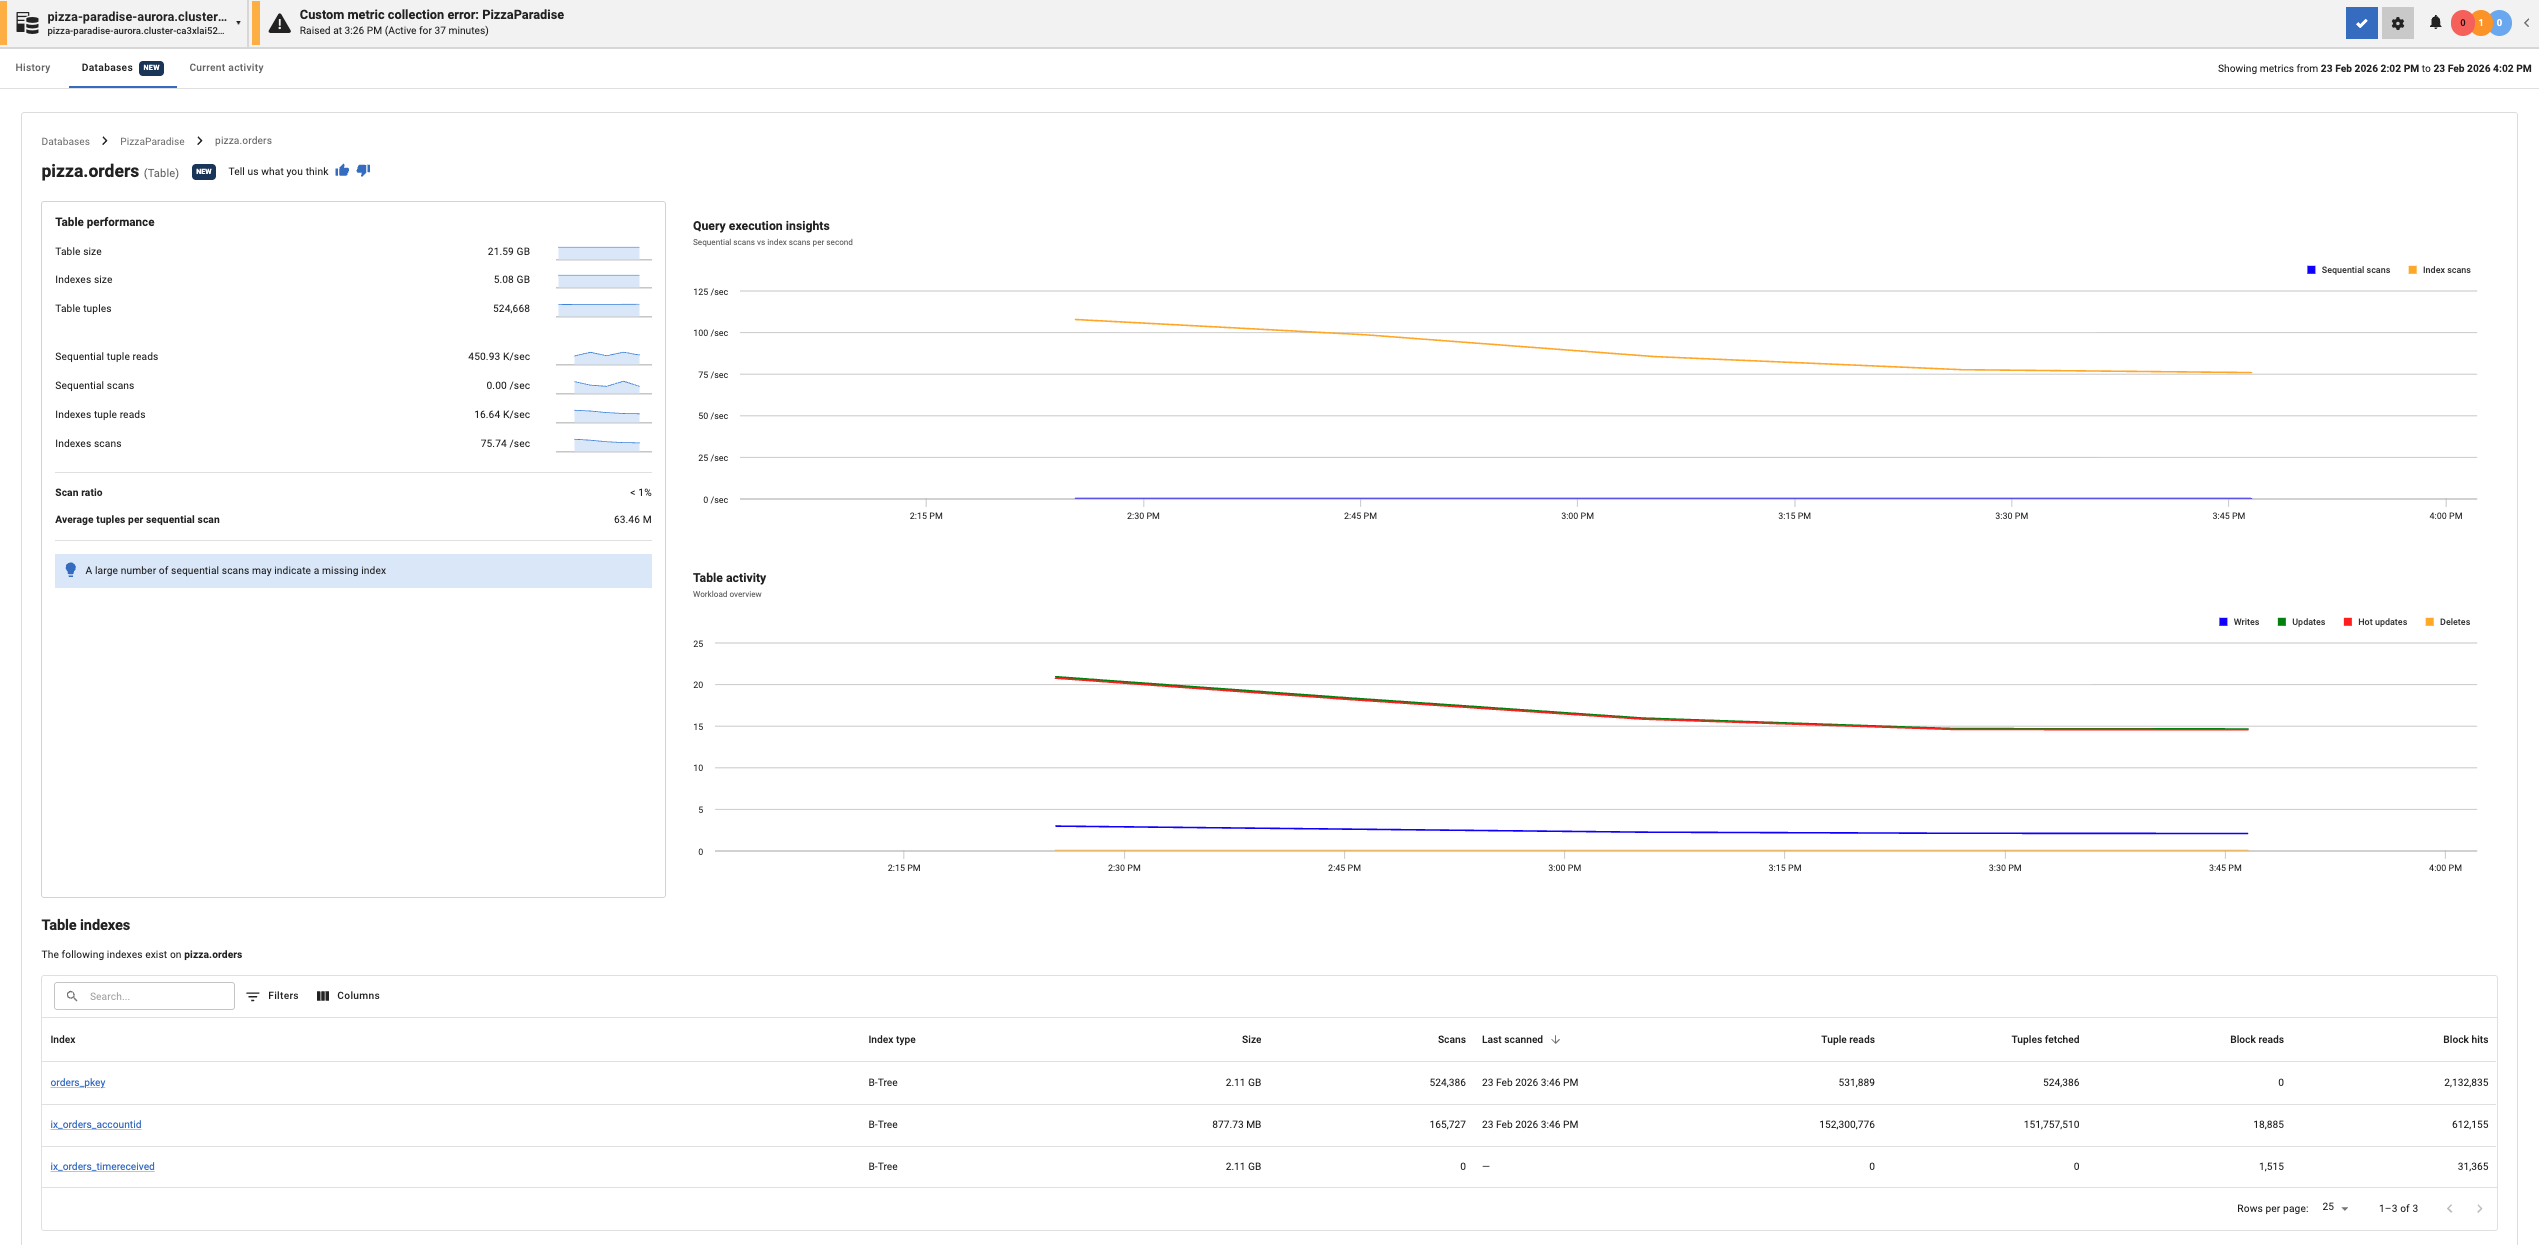
Figure 3: Example of an index page
Top Waits
When query performance is slow, wait statistics help you understand why your sessions are waiting rather than actively executing. However, wait stats alone don't tell you the underlying cause. You also need to see resource usage, query execution statistics, and plans to pinpoint the source of contention. We've introduced a Top Waits section for PostgreSQL instances that brings all this information together in a single, coordinated view. It quickly summarizes where sessions spent the most time waiting, alongside the performance metrics and query data needed to trace a slowdown to its root cause.
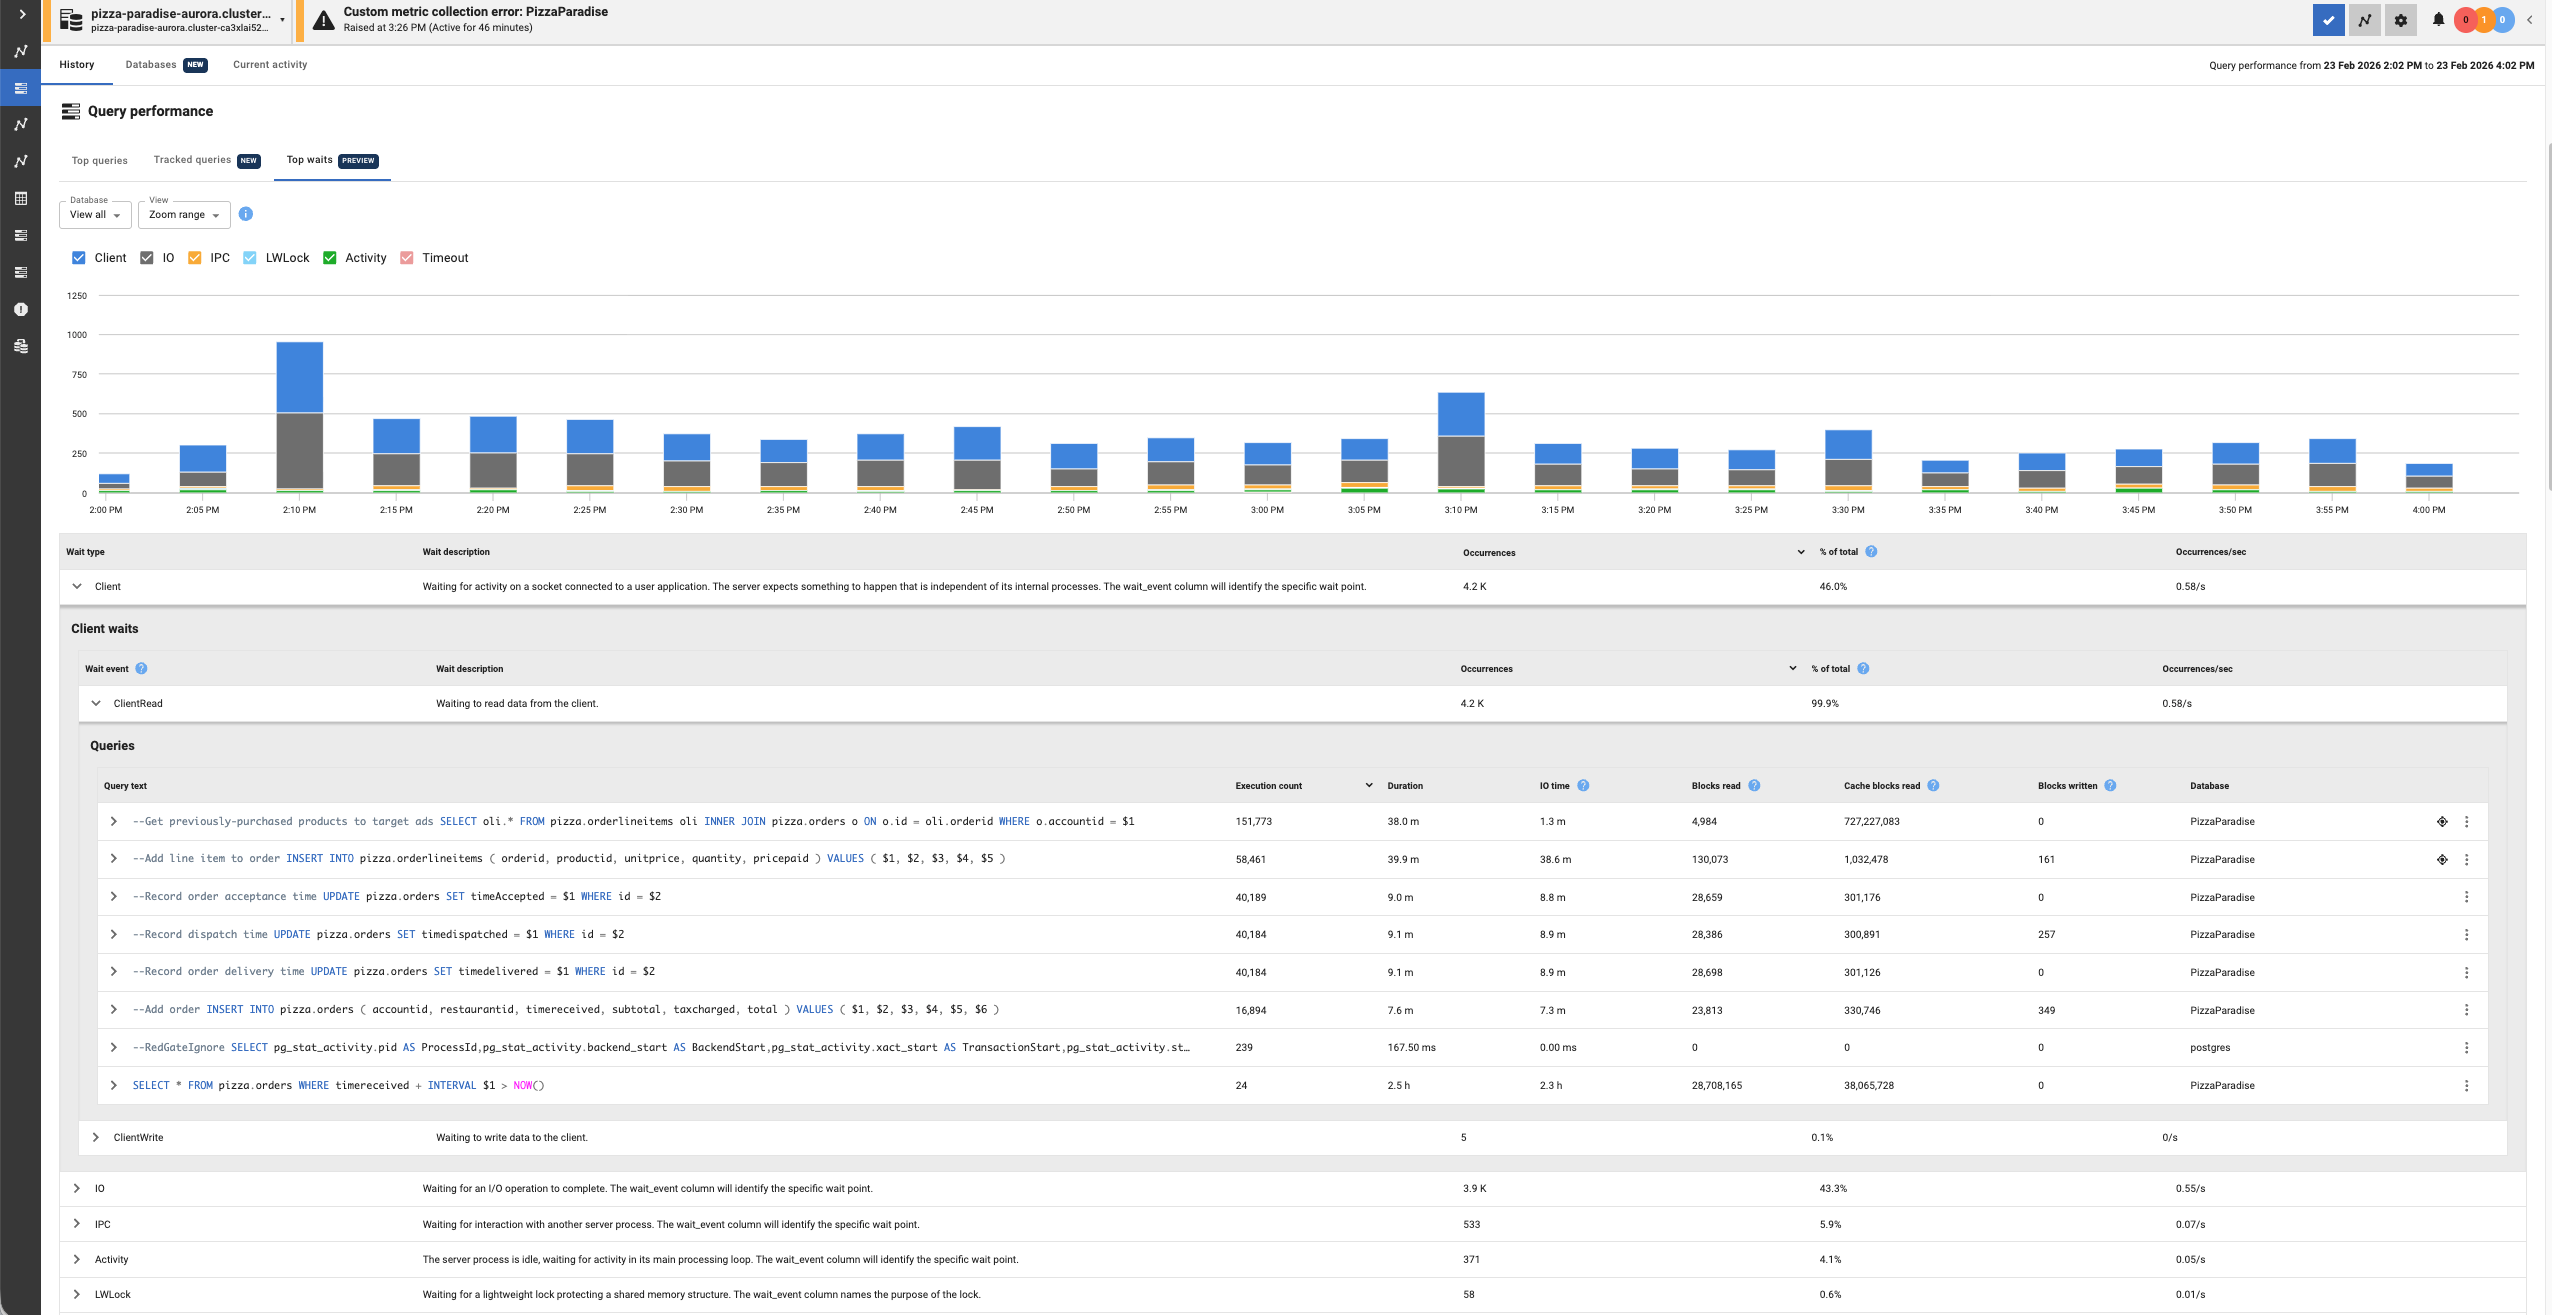
Figure 4: Example of Top Waits in a PostgreSQL Instance
You can filter the Top Waits view by time range and, where needed, narrow it to a specific database. Clicking into individual wait types and events then surfaces the related query data, making it easier to see which queries were associated with those waits and investigate what was driving the slowdown.
Top Waits is available in both the instance overview page and the Database section, where it can be filtered to a specific database.
Custom Metrics
Redgate Monitor covers many standard metrics out of the box, but every team has unique requirements they want to track. Using custom metrics for PostgreSQL you can now monitor your Postgres instances and databases for any 'signal' that you can express in a SQL query.
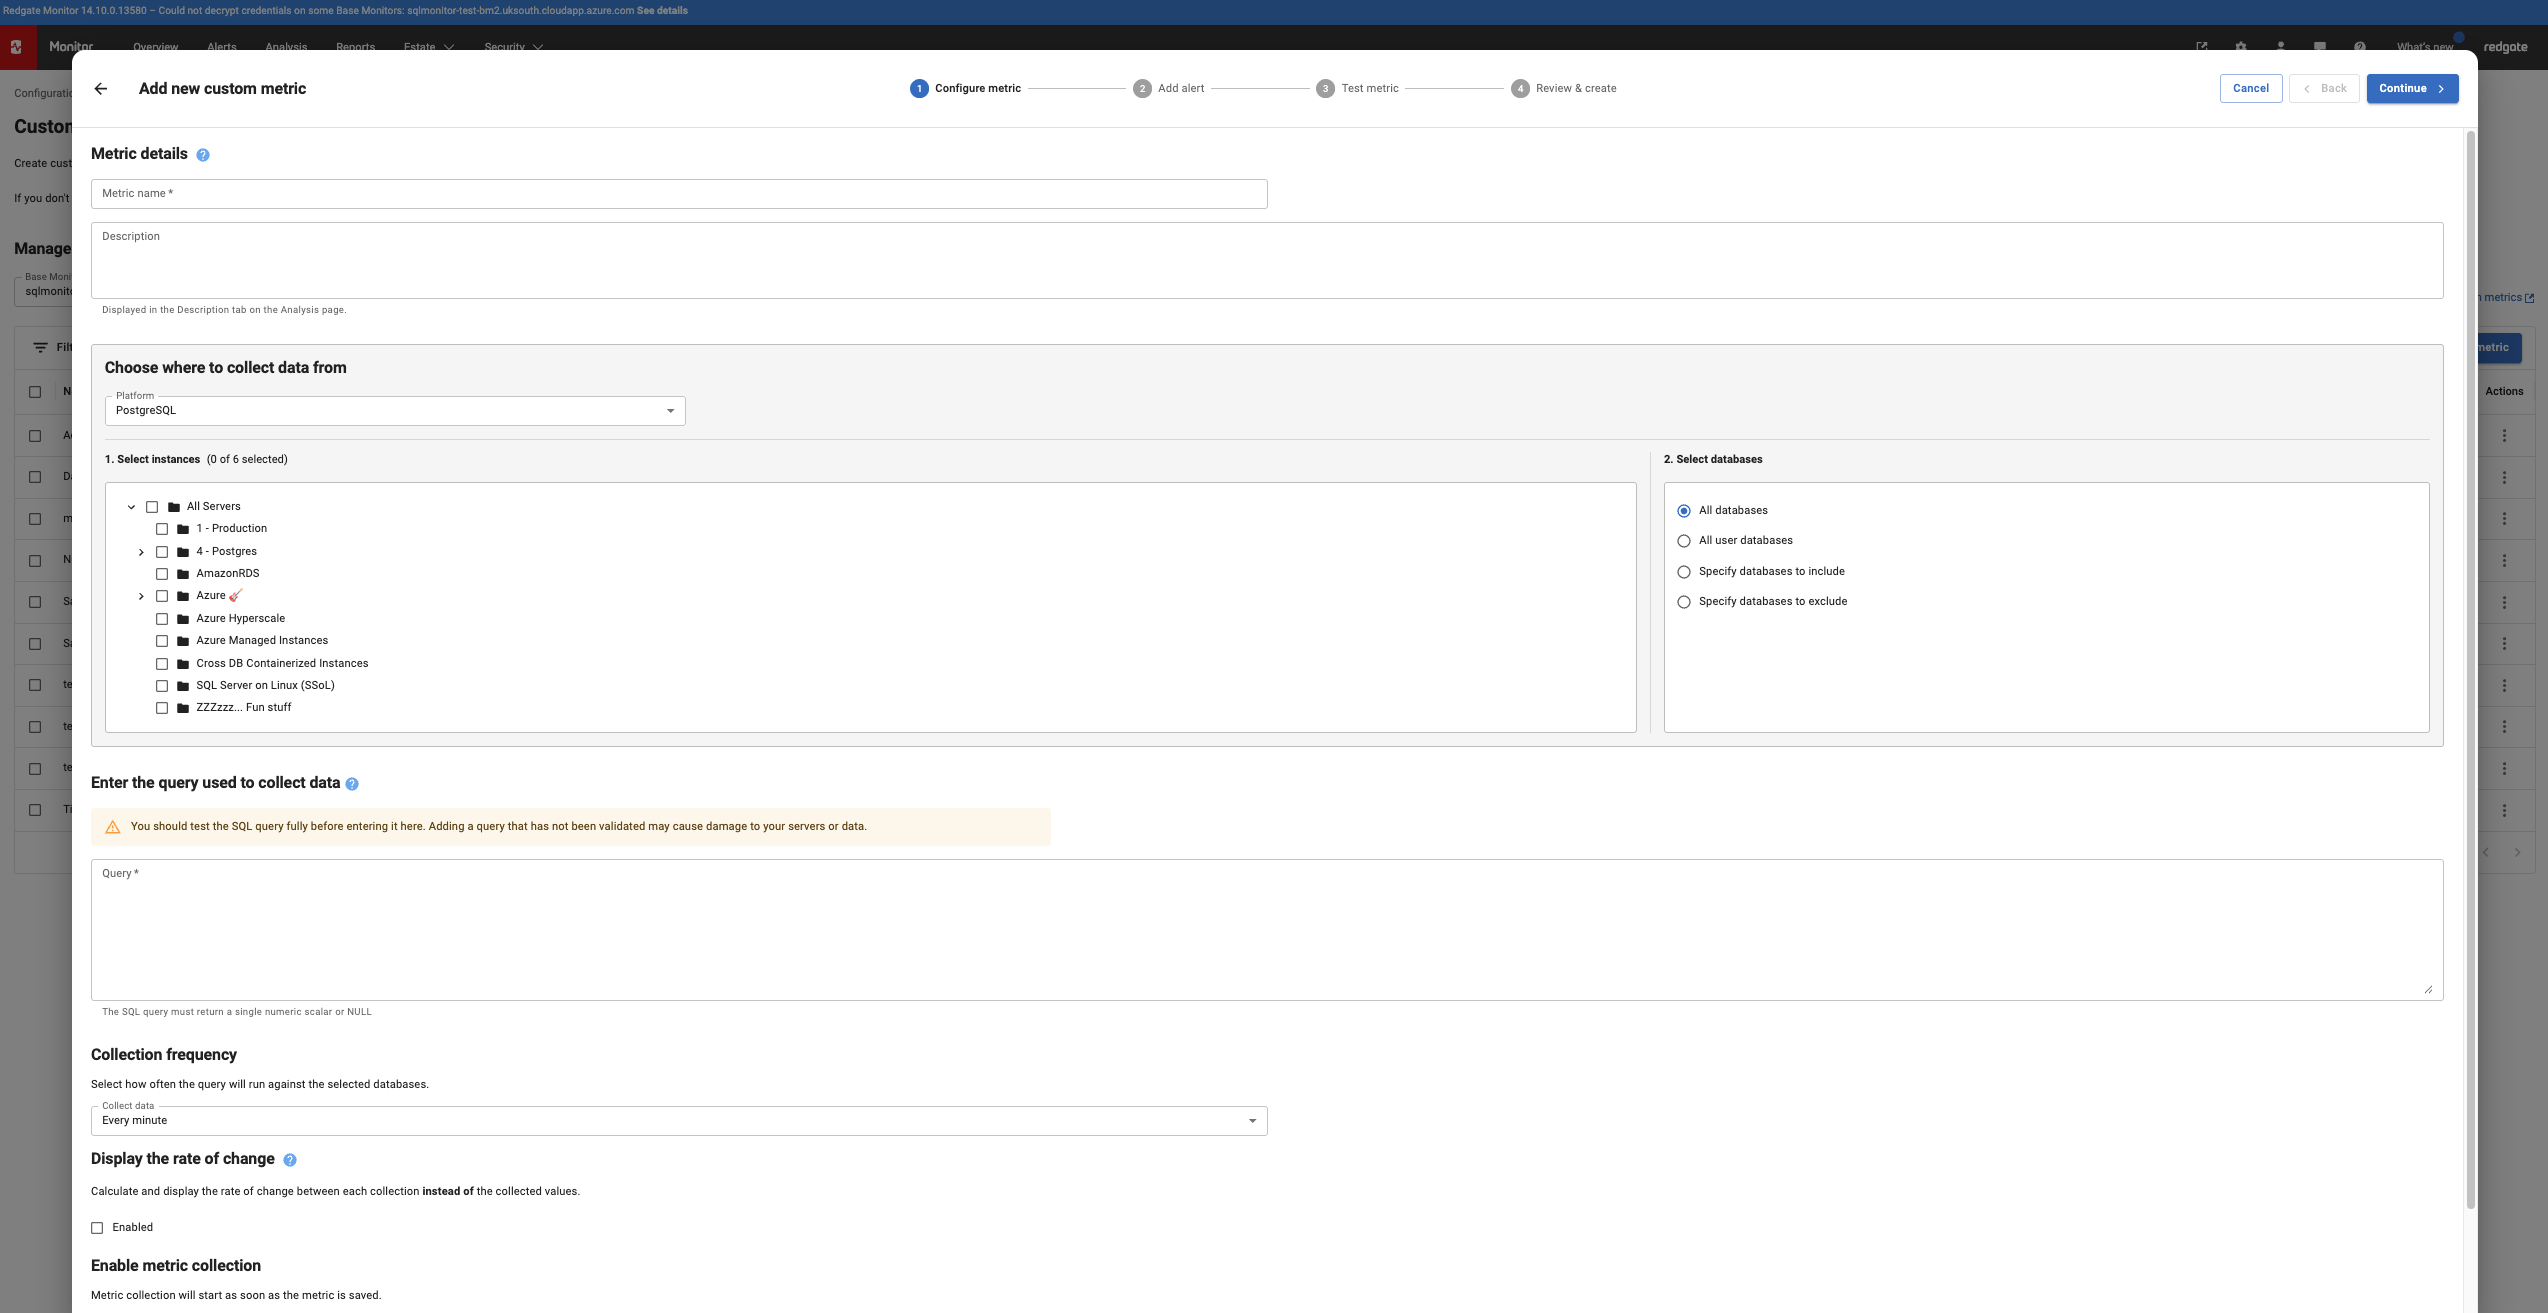
Figure 5: Custom metrics for PostgreSQL
To create a custom metric for PostgreSQL, select PostgreSQL in the platform dropdown when creating the metric. Enter the query for the custom metric and set it to run on a schedule against your target instances.
You can track these custom metrics using the same monitoring and alerting workflow as any built-in metric. The results appear on the Analysis page alongside standard metrics, and you can set custom alerts with Low, Medium, or High severity thresholds based on returned values and durations, much like standard alerts.
Looking Ahead
Together, these updates make Redgate Monitor simpler and faster to use for day-to-day investigation and tuning of PostgreSQL performance issues. They help users investigate slowdowns, compare query behavior, spot index waste, and extend monitoring to cover the additional metrics that matter in their own environments.
We’re continuing to invest in Postgres monitoring, with further improvements on the way, including enhancements to Aurora Replica monitoring and Configuration Parameters.
Watch this space!
This document contains proprietary information and is protected by copyright law.
Copyright © 2026 Red Gate Software Limited. All rights reserved
Tools in this post
Redgate Monitor
Real-time multi-platform performance monitoring, with alerts and diagnostics
You may also like

Blog
Redgate Flyway's Product Updates – July 2026

Blog
Loading comments...