Walkthroughs

Take a look at these walkthroughs for more detailed descriptions of some of SmartAssembly's capabilities, and how to make the most of them.

Download this article as a PDF

How to automate error reporting with SmartAssembly

As a developer, you have several options when collecting error reports for your programs.

For example, you can rely on end-users sending in their own reports by email, or you can code your own error-reporting system into your software. But these can be time-consuming and unreliable processes.

With email reporting, user response tends to be slow, and it can be hard to gather precise and accurate information – especially from end-users who are not technically literate. Writing your own error reporting system is a major undertaking and relies on your ability to forecast where errors will crop up.

The Automated Error Reporting in SmartAssembly offers an alternative.

The basics

SmartAssembly is a software protection and improvement tool for .NET developers. One of its key features is the option to add customizable Automated Error Reporting to your software.

SmartAssembly's error reports provide a complete stack trace, and the values of all the variables, when an exception occurs in your program. End-users need only click a button to send you the details.

As an example, we'll use SmartAssembly to improve one of Redgate's tools. We've been having trouble with the search function in this particular build of .NET Reflector. Let's see whether Automated Error Reporting can get to the bottom of things.

Step 1: Setting up the project

SmartAssembly uses projects to manage changes to our software, so we begin by starting a new project for Reflector. We're taken straight through to the Project Settings window, where we can configure the various additions we'd like to make to our software.

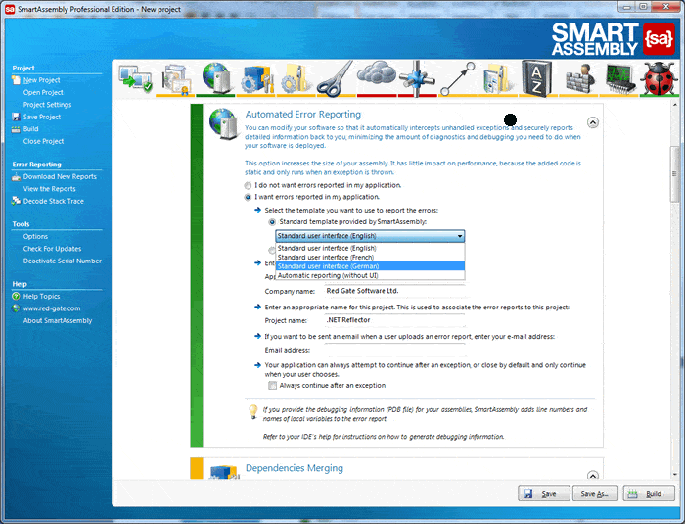
We move straight down to the Automated Error Reporting heading in the main window, and select I want errors reported in my application. This opens up further settings, as shown in Figure 1.

Figure 1: Automated Error Reporting options.

Step 2: Configuration and building

Here, we can configure our error reports. The most important decision is what information they should give us. This is handled with templates, and we have three choices: standard, automatic, or custom.

SmartAssembly's standard template gives us the stack trace and variable values. Automated Error Reporting gives us the same information but without any user interaction – the report is sent automatically whenever errors occur. Custom reporting lets us add extra information to our error reports.

Since the standard user interface should give us all we need, we'll stick with that. Here, we can also change the language our error reports will appear in, but we'll leave them in English.

Our company and application names will appear in our error reports, and are detected automatically, so Red Gate Software Ltd and .NET Reflector appear by default. We've got the settings we want, so we click the Build button to add error reporting
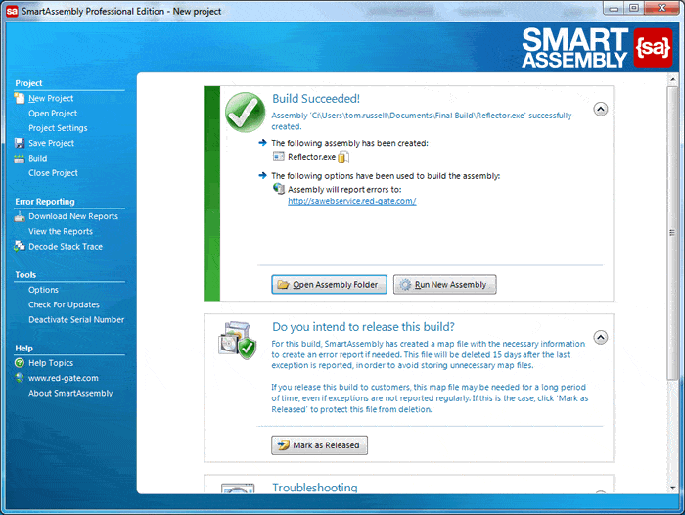
Figure 2: Building our assembly.

Step 3: Encountering an error

With the build complete, we can close SmartAssembly and begin playing with .NET Reflector to check for bugs.
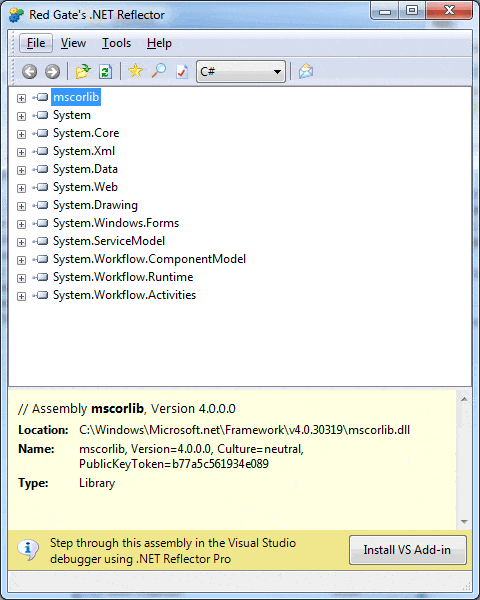
Figure 3: .NET Reflector.

The error reports are created automatically whenever .NET Reflector throws an exception, so we just need to keep working with Reflector until we hit one. We know there have been problems with the search function, so we begin there.

As we suspected, trouble strikes when we try to run a search, so we send in the error report to get the full picture.
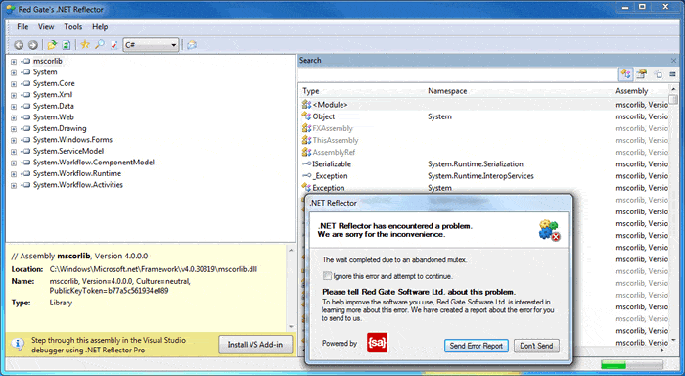
Figure 4: A SmartAssembly error notification.

Step 4: Investigating error reports

To see the details, we need to go back into SmartAssembly, get our new error report with the Download New Reports button, and then select View the Reports. Now we can check what went wrong with Reflector.
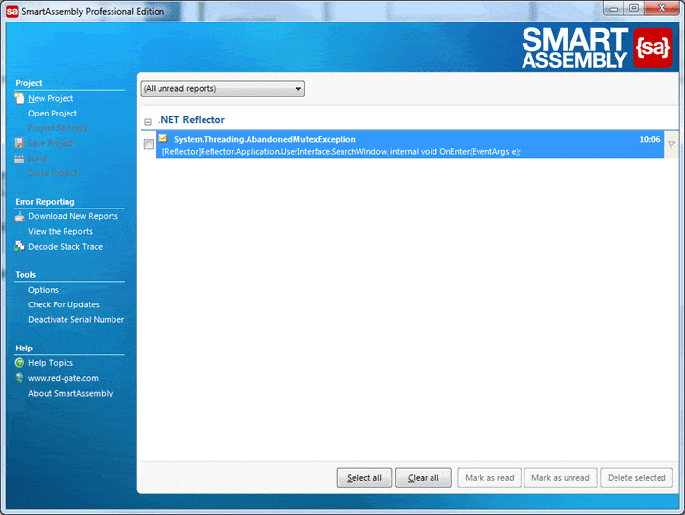
Figure 5: Checking our error reports.

When we open the report, we can instantly see details such as the product version and the operating system it was run on, but what we're really interested in is the stack trace. To check it out, we just need to expand this section.
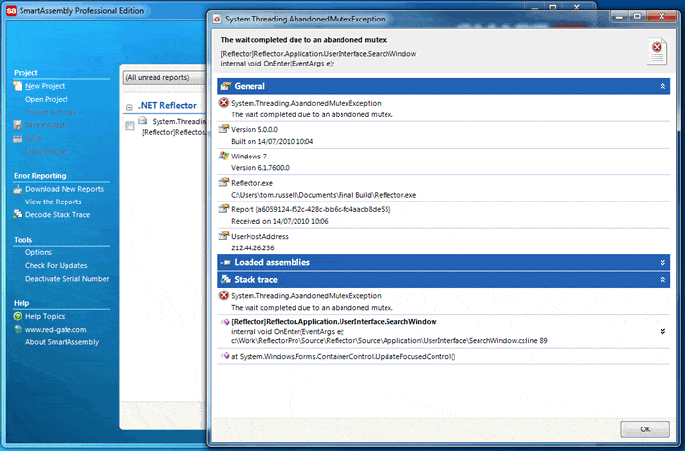
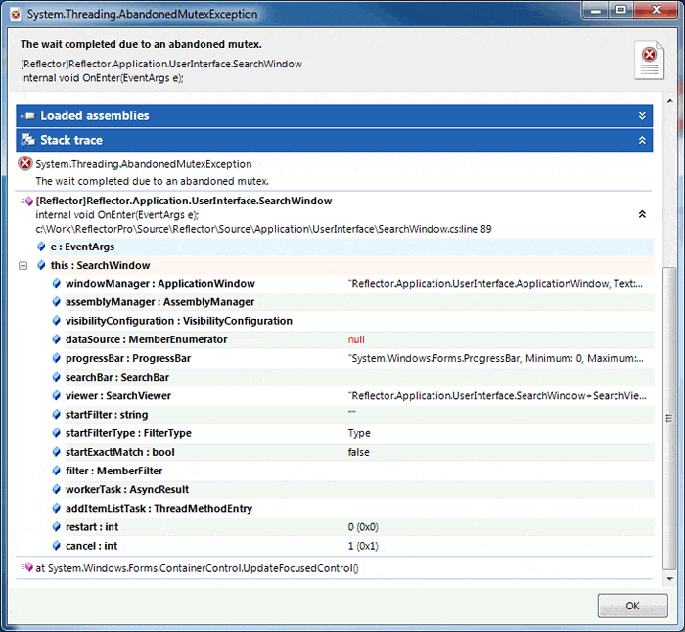
Figure 6: Opening the error report.
Figure 7: Examining the stack trace.

The stack trace gives us the values of all the local variables, enabling us to pin the problem down quickly.

By gathering all the data with SmartAssembly, we don't need to waste time emailing back and forth with the end-user, trying to get an accurate description of the problem, and we can focus on fixing the error straight away.


Get started with SmartAssembly

Download a 14-day free trial, and start improving your .NET releases.

Download free trial

Adding a customized Automated Error Reporting dialogue box

Please note that this walkthrough uses the SmartAssembly SDK, which is available only in SmartAssembly Pro.

Step 1: Locate the SDK sample code

The SDK samples are installed with SmartAssembly in Program Files\Red Gate\SmartAssembly 6\SDK\Exception Reporting\.

Figure 1: Locating the SDK Samples.

In this example, Sample 3 – Template with Custom UI is used.

Sample 3:

  • Is designed for easy customization.
  • Targets standard Windows desktop applications (not Silverlight).
  • Collects email addresses from users who submit error reports, but also allows them to submit error reports anonymously.
  • If you have different requirements, use the most appropriate sample instead.

Step 2: Open the SDK sample code in Visual Studio

The SDK sample code C# project file Sample 03 - Template with Custom UI.csproj is opened in Visual Studio.

Figure 2: Opening an SDK sample in Visual Studio.

Step 3: Design your exception reporting dialog box

Using the Visual Studio designer, edit the sample code to suit your requirements.

Figure 3: Editing the sample SDK code to meet your needs.

Step 4: Add extra information to the error report

If required, you can add extra parameters to error reports as custom properties. Call e.AddCustomProperty() inside the OnReportException() method.

You can also attach one or more files to the error reports. Call e.AttachFile() inside the OnReportException() method.

Figure 4: Instrumenting your code to attach additional information/files to your error reports.

Step 5: Add error reporting to your SmartAssembly project

Then you need to build the customized template as a DLL. Use SmartAssembly to enable Automated Error Reporting in your application, and select the DLL you built as the Custom Template.

Figure 5: Activating Automated Error Reporting in your SmartAssembly project.

Step 6: Set an email template to respond to your customers

If required, you can set an email template. The template opens in your email program, ready to send to your customer, when you receive their error report. This helps to reassure your customers that you take their feedback seriously. To set up a template email, see Collecting your customers' email addresses in a custom template on Error reporting with the SDK.

Figure 6: Creating an email template to automatically send back to users who have reported an error.

Step 7: Use SmartAssembly to build your application

When your application encounters an unhandled exception, the rebranded dialog box is displayed:

Figure 7: The customized dialog box your users see when an error occurs.

When you view the error report in SmartAssembly, the custom property, attached file, and the submitted email address are included with the stack trace:

Figure 8: An error report received by the developer, as viewed from within SmartAssembly.

Double-click on the Customer e-mail address to open the template email in your email client:

Figure 9: Opening up the pre-defined template for responding to your users.

Get started with SmartAssembly

Download a 14-day free trial, and start improving your .NET releases.

Download free trial