Testing the Performance of Individual SQL Statements within a Batch using SQL Prompt
With SQL Prompt and Phil Factor's chk code snippet, you can, with a few clicks, get a list of all the SQL statements executed within a batch, in SSMS, their execution plans, and their execution statistics, such as duration, CPU, logical reads and so on.
This article is all about using a SQL Prompt snippet to create and run a test harness on a batch of SQL code, to provide performance data. Behind the scenes, the snippet creates and starts an Extended Events event session, inserts and runs the text of the batch of SQL you’ve selected in SSMS, and uses XQuery on the XML event data, to return it in digestible, tabular form. With a few clicks to invoke and execute the snippet, we get the execution plan for any batch, along with the SQL text and query execution statistics for every SQL statement in the batch.
Why bother setting it up this way? When wrestling with XML and extended events, I sometimes feel like a goldfish staring at a television set. It’s hypnotic, and I know it is lovely, but I don’t pretend to understand it. As a developer, I’m more at home thinking of performance in simple terms, as being the lapsed time, from the perspective of the application. It is a solid metric that is the same as the experience of the user. However, when the elapsed time is longer than the users can tolerate, or is erratic, and I can’t find an obvious fault in the logic, then I like to see the server-based I/O metrics, and to check the execution plans.
To get these, I need to use Extended Events, and if I can keep the complexity at bay by means of snippets or templates, it is an easier decision to make. I’m not Billy Two-Brains, so I’m happy to get help where I can.
An example of using the snippet
Let’s say you have an aggregation query that is not performing as hoped. You’ve read Grant Fritchey’s account of the HASH | ORDER GROUP query hints, in his Execution Plans book, which forces SQL Server to choose a particular aggregation mechanism for all aggregations in the query that are caused by GROUP BY or DISTINCT. The HASH GROUP hint forces it to use a Hash Match aggregation (which is hash based), and ORDER GROUP a Stream Aggregate (which is order based).
You’re wondering whether these hints were worth pursuing, or whether it makes more sense to create an index. The only way to know for sure is to test all the alternatives. Listing 1 shows the code I used.
|
1 2 3 4 5 6 7 8 9 10 11 12 13 14 15 16 17 18 19 20 21 22 23 24 25 26 27 28 29 30 31 32 33 34 35 36 37 38 39 40 41 42 43 44 45 46 47 48 49 50 51 52 53 54 55 56 |
USE PhilFactor SET STATISTICS IO off --Test the value of using the HASH | ORDER GROUP query hints DECLARE @bucket TABLE (suffix VARCHAR(10) NOT NULL, quantity INT NOT NULL); INSERT --1/ no options, no suitable index INTO @bucket(suffix,quantity) SELECT Coalesce(p.Suffix,'(none)') , Count(*) AS SuffixUsageCount FROM AdventureWorks2016.Person.Person AS p GROUP BY p.Suffix INSERT --2/ order group option, no index INTO @bucket(suffix,quantity) SELECT Coalesce(p.Suffix,'(none)') , Count(*) AS TheSuffixUsageCount FROM AdventureWorks2016.Person.Person AS p GROUP BY p.Suffix OPTION ( ORDER GROUP ) INSERT --3/ Hash group option, no index INTO @bucket(suffix,quantity)SELECT -- hash group no index Coalesce(p.Suffix,'(none)') , Count(*) AS TheSuffixUsageCount FROM AdventureWorks2016.Person.Person AS p GROUP BY p.Suffix OPTION ( HASH group ) CREATE INDEX DeleteMePlease -- build an index ON AdventureWorks2016.person.person (Suffix) INSERT --4/ no option, suitable index INTO @bucket(suffix,quantity) SELECT -- re-execute the code Coalesce(p.Suffix,'(none)') , Count(*) AS TheSuffixUsageCount FROM AdventureWorks2016.Person.Person AS p GROUP BY p.Suffix INSERT --5/ order group option, suitable index INTO @bucket(suffix,quantity) SELECT -- order group with index Coalesce(p.Suffix,'(none)') , Count(*) AS TheSuffixUsageCount FROM AdventureWorks2016.Person.Person AS p GROUP BY p.Suffix OPTION ( ORDER GROUP ); INSERT --6/ hash group option, suitable index INTO @bucket(suffix,quantity) SELECT -- hash group with index Coalesce(p.Suffix,'(none)') , Count(*) AS TheSuffixUsageCount FROM AdventureWorks2016.Person.Person AS p GROUP BY p.Suffix OPTION ( HASH group ); USE AdventureWorks2016 DROP INDEX Person.Person.DeleteMePlease USE PhilFactor |
Listing 1
Which strategy performs best? In the SSMS query pane, I hit Ctrl-A to select the whole batch. With the code selected, I find that SQL Prompt’s little red action list icon appears at the left base of my selection. Its drop-down menu lists all the installed snippets, and I click on my chk snippet.
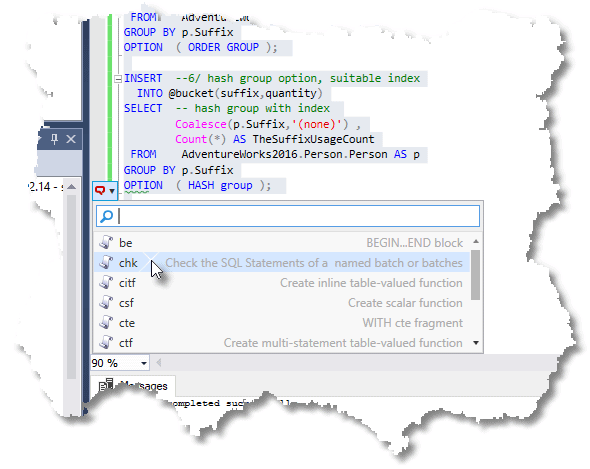
The chk snippet, which I’ll show you how to create shortly, will embed the selected code in a special extended events event session that will track the individual statements in a batch that starts with a particular string. This identifier is added by the snippet, in a comment. I’ll show you how to examine several batches later in the article.
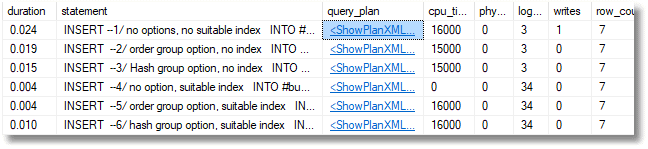
Quite a bit of code gets heaved into query pane, but I have steady nerves. I just hit ‘Execute’ and a second later I see the results, which includes the text of all the statements executed, their execution time, and links to the execution plan.
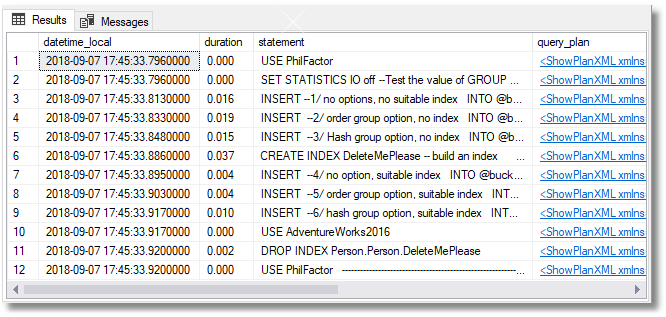
Scrolling across, there is more information, including the CPU time, the IO statistics, and number of rows returned, for each statement.
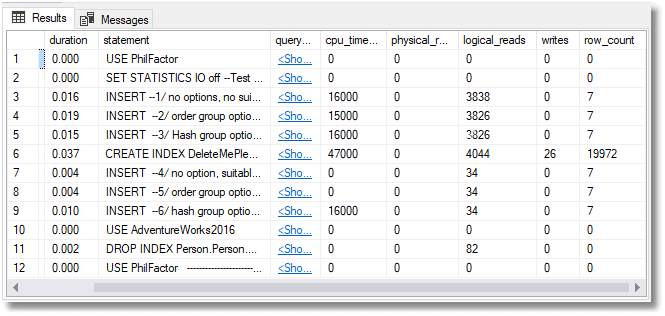
We can see straight away, from these execution statistics, that providing a suitable index is far better than messing with hints. By providing an index that’s logically ordered by the column on which we’re grouping, we instantly make the query run four times faster.
If we want to know why, we can look at the showplan. As we are, in this first example, examining just one batch, all the showplan links are to the same plan, which is the plan for the batch, and it contains the individual plans for every statement in the batch:
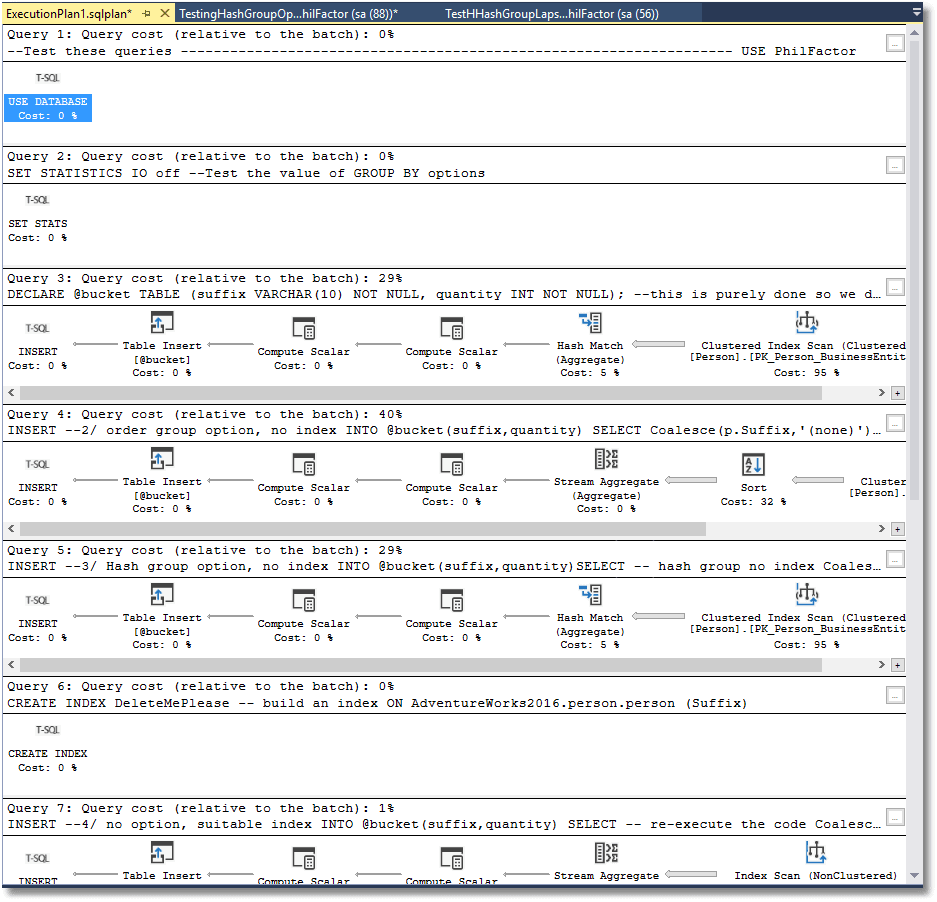
With no useful index, the optimizer can either use hash match aggregation, which has the overhead of building and populating a hash table in memory, or it can first sort the data emerging from the clustered index, and then use stream aggregation.
It deems the former strategy to be the cheapest one, in this case, but the ORDER GROUP hint forces the optimizer to adopt the latter. Our query execution statistics indicate that it makes little difference for a small table like this, but sort operations are expensive, and so the performance of this hinted query is likely to degrade as the number of rows in the source table grows. Instead, by providing an index ordered by the GROUP BY column, we enable the optimizer to choose the lower-overhead stream aggregation, without requiring an additional sort operation.
The reason I mention all this is not dissuade you from using hints, but to persuade you to measure things like this as accurately as possible, before deciding on a course of action. With this snippet, which we can use for any set of queries, we get to see very quickly if any one strategy is going to offer a ‘big win’.
The Snippet for checking SQL Statements in a batch
Listing 2 shows the code for creating the Prompt snippet.
|
1 2 3 4 5 6 7 8 9 10 11 12 13 14 15 16 17 18 19 20 21 22 23 24 25 26 27 28 29 30 31 32 33 34 35 36 37 38 39 40 41 42 43 44 45 46 47 48 49 50 51 52 53 54 55 56 57 58 59 60 |
IF EXISTS --if the session already exists, then delete it. We are assuming you've changed something ( SELECT * FROM sys.server_event_sessions WHERE server_event_sessions.name = 'CheckingSQLStatements' ) DROP EVENT SESSION CheckingSQLStatements ON SERVER; GO CREATE EVENT SESSION CheckingSQLStatements --call it what you wish, of course ON SERVER ADD EVENT sqlserver.sql_statement_completed --we just have one event (ACTION (sqlserver.database_name, sqlserver.sql_text, sqlserver.plan_handle)-- and these global vars WHERE (sqlserver.like_i_sql_unicode_string(sqlserver.sql_text, N'--Test these queries%')) --we just want the batch and nothing else so we put an identifying string at the start ) ADD TARGET package0.ring_buffer --we don't need a more permanent record or a bucket count WITH (STARTUP_STATE = OFF); GO ALTER EVENT SESSION CheckingSQLStatements ON SERVER STATE = START; --V-----The Batch being tested starts here ------V GO --Don't change the next line without also changing the WHERE clause above --Test these queries ------------------------------------------------------------------- $SELECTEDTEXT$ ------------------------------------------------------------------ go DECLARE @Target_Data XML = ( SELECT TOP 1 Cast(xet.target_data AS XML) AS targetdata FROM sys.dm_xe_session_targets AS xet INNER JOIN sys.dm_xe_sessions AS xes ON xes.address = xet.event_session_address WHERE xes.name = 'CheckingSQLStatements' AND xet.target_name = 'ring_buffer' ); SELECT CONVERT(datetime2, SwitchOffset(CONVERT(datetimeoffset,the.event_data.value('(@timestamp)[1]', 'datetime2')), DateName(TzOffset, SYSDATETIMEOFFSET()))) AS datetime_local, CONVERT(DECIMAL(6,3),round(the.event_data.value('(data[@name="duration"]/value)[1]', 'bigint')/1000000.0,3,1)) AS duration, the.event_data.value('(data[@name="statement"]/value)[1]', 'nvarchar(max)') AS [statement], --the.event_data.value('(action[@name="sql_text"]/value)[1]', 'nvarchar(max)') AS sql_text, --the.event_data.value('(action[@name="database_name"]/value)[1]', 'nvarchar(80)') AS [database_name], qp.query_plan, the.event_data.value('(data[@name="cpu_time"]/value)[1]', 'bigint') AS [cpu_time(microsSecs)], the.event_data.value('(data[@name="physical_reads"]/value)[1]', 'bigint') AS physical_reads, the.event_data.value('(data[@name="logical_reads"]/value)[1]', 'bigint') AS logical_reads, the.event_data.value('(data[@name="writes"]/value)[1]', 'bigint') AS writes, the.event_data.value('(data[@name="row_count"]/value)[1]', 'bigint') AS row_count --the.event_data.value('(data[@name="last_row_count"]/value)[1]', 'int') AS last_row_count, --the.event_data.value('(data[@name="line_number"]/value)[1]', 'int') AS line_number, --the.event_data.value('(data[@name="offset"]/value)[1]', 'int') AS offset, --the.event_data.value('(data[@name="offset_end"]/value)[1]', 'int') AS offset_end, FROM @Target_Data.nodes('//RingBufferTarget/event') AS the (event_data) OUTER APPLY sys.dm_exec_query_plan( Convert(varbinary(64),--convert to valid plan handle '0x' + the.event_data.value('(action[@name="plan_handle"]/value)[1]', 'nvarchar(max)') ,1)) as qp ALTER EVENT SESSION CheckingSQLStatements ON SERVER STATE = STOP; |
Listing 2
That $SELECTEDTEXT$ placeholder allows you to put the code from the snippet either side of the selected code. As you see, we create the session, execute the code and immediately stop the session. We take the XML document that represents the contents of the ring buffer and shred it into a relational table that appears in the results. The event session filters out everything but the batch that starts with the string, '--Test these queries'.
Simply paste the code in Listing 2 into an SSMS query pane, use Ctrl-A to highlight the code, then right-click and select Create Snippet. Decide the characters you want to enter to invoke the snippet (I chose chk), give the snippet a description, and hit save.
Checking more than one batch
This snippet is set up for just one batch. It inserts the following line at the start of the batch;
|
1 |
--Test these queries |
However, the event session is set up to report on any number of batches that start with that string. It is possible to provide a separate execution plan for each statement in a series of separate batches. To demonstrate this, we’ll repeat the test but put each statement into its own batch.
|
1 2 3 4 5 6 7 8 9 10 11 12 13 14 15 16 17 18 19 20 21 22 23 24 25 26 27 28 29 30 31 32 33 34 35 36 37 38 39 40 41 42 43 44 45 46 47 48 49 50 51 52 53 54 55 56 57 58 59 60 61 62 63 64 65 66 67 68 69 70 71 |
USE PhilFactor SET STATISTICS IO off --Test the value of using the HASH | ORDER GROUP query hints CREATE table #bucket (suffix VARCHAR(10) NOT NULL, quantity INT NOT NULL); GO --Test these queries. First one is no options, no suitable index INSERT --1/ no options, no suitable index INTO #bucket(suffix,quantity) SELECT Coalesce(p.Suffix,'(none)') , Count(*) AS SuffixUsageCount FROM AdventureWorks2016.Person.Person AS p GROUP BY p.Suffix GO --Test these queries. Second is order group option, no index INSERT --2/ order group option, no index INTO #bucket(suffix,quantity) SELECT Coalesce(p.Suffix,'(none)') , Count(*) AS TheSuffixUsageCount FROM AdventureWorks2016.Person.Person AS p GROUP BY p.Suffix OPTION ( ORDER GROUP ) GO --Test these queries. Third is Hash group option, no index INSERT --3/ Hash group option, no index INTO #bucket(suffix,quantity)SELECT -- hash group no index Coalesce(p.Suffix,'(none)') , Count(*) AS TheSuffixUsageCount FROM AdventureWorks2016.Person.Person AS p GROUP BY p.Suffix OPTION ( HASH group ) GO CREATE INDEX DeleteMePlease -- build an index ON AdventureWorks2016.person.person (Suffix) GO --Test these queries. Fourth is no option, suitable index INSERT --4/ no option, suitable index INTO #bucket(suffix,quantity) SELECT -- re-execute the code Coalesce(p.Suffix,'(none)') , Count(*) AS TheSuffixUsageCount FROM AdventureWorks2016.Person.Person AS p GROUP BY p.Suffix GO --Test these queries. Fifth is order group option, suitable index INSERT --5/ order group option, suitable index INTO #bucket(suffix,quantity) SELECT -- order group with index Coalesce(p.Suffix,'(none)') , Count(*) AS TheSuffixUsageCount FROM AdventureWorks2016.Person.Person AS p GROUP BY p.Suffix OPTION ( ORDER GROUP ); GO --Test these queries. Last is hash group option, suitable index INSERT --6/ hash group option, suitable index INTO #bucket(suffix,quantity) SELECT -- hash group with index Coalesce(p.Suffix,'(none)') , Count(*) AS TheSuffixUsageCount FROM AdventureWorks2016.Person.Person AS p GROUP BY p.Suffix OPTION ( HASH group ); GO USE AdventureWorks2016 DROP INDEX Person.Person.DeleteMePlease USE PhilFactor DROP TABLE #bucket |
Listing 3
Notice the string, --Test these queries, at the start of each batch. Notice too that we’ve replaced the table variable with a temporary table, because it is visible across batches. Now put this in the test harness using Prompt, and you get a neater result with only the queries you are interested in, and each one has its own Execution plan.
I put only one query in a batch but if there is more than one they will appear and will share the execution plan with the others in the same batch.
A Snippet for checking statements within a stored procedure or function
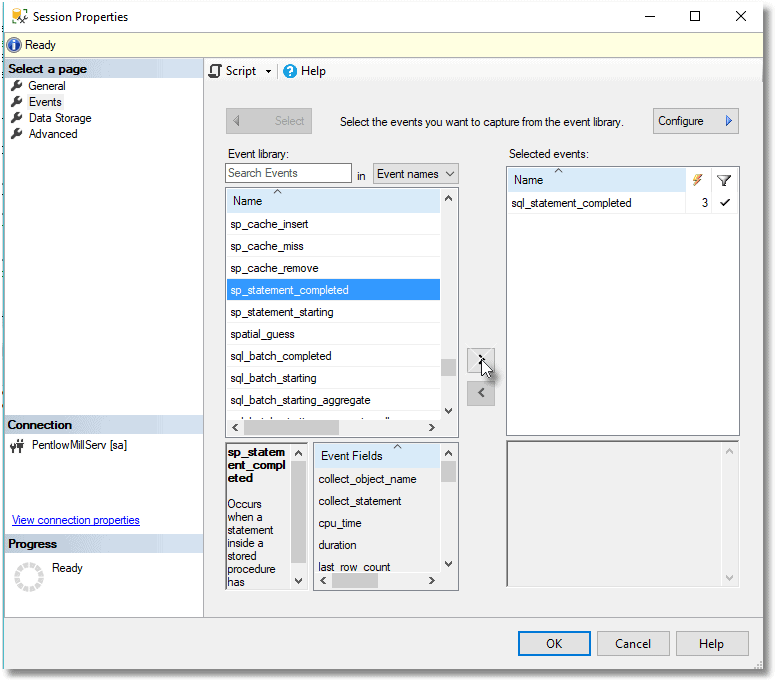
It is very easy to extend the basic snippet to also show, for example, the statements executed within stored procedures and functions. Simply execute the CREATE EVENT portion of Listing 2, and then navigate the event session in the SSMS object explorer and choose Properties from its right-click context menu.
We can add whatever events, fields and filters we need. Here, I am adding the sp_statement_completed event to the event session.
Having made your changes, you can script out the DDL to create the event session and use it in your Prompt snippet. Remember to add the preliminary code to delete any existing session with that name.
It is worth getting more familiar with Extended Events, by changing event sessions. via the property window, to see what detail you can get from them. However, be warned that you will need to be able to stare at raw XML without flinching until you have been able to shred the XML into relational form. Fortunately, there are similarities between the TSQL events, so a snippet that records all such events is reasonably easy.
Listing 4 shows the code for a snippet that will return the execution statistics and plans for all statements in a stored procedure, or batch. It will work for functions as well as procedures. It great as a secondary investigation, but the level of detail can soon get overwhelming.
|
1 2 3 4 5 6 7 8 9 10 11 12 13 14 15 16 17 18 19 20 21 22 23 24 25 26 27 28 29 30 31 32 33 34 35 36 37 38 39 40 41 42 43 44 45 46 47 48 49 50 51 52 53 54 55 56 57 58 59 60 61 62 63 |
IF EXISTS --if the session already exists, then delete it. We are assuming you've changed something ( SELECT * FROM sys.server_event_sessions WHERE server_event_sessions.name = 'CheckingSPsAndSQLStatements' ) DROP EVENT SESSION CheckingSPsAndSQLStatements ON SERVER; GO CREATE EVENT SESSION CheckingSPsAndSQLStatements --call it what you wish, of course ON SERVER ADD EVENT sqlserver.sql_statement_completed --we just have one event (ACTION (sqlserver.database_name, sqlserver.sql_text, sqlserver.plan_handle)-- and these global vars WHERE (sqlserver.like_i_sql_unicode_string(sqlserver.sql_text, N'--Test these queries%')) --we just want the batch and nothing else so we put an identifying string at the start ), ADD EVENT sqlserver.sp_statement_completed( ACTION (sqlserver.database_name, sqlserver.sql_text, sqlserver.plan_handle) WHERE (sqlserver.like_i_sql_unicode_string(sqlserver.sql_text, N'--Test these queries%')) ), ADD EVENT sqlserver.sql_batch_completed( ACTION (sqlserver.database_name, sqlserver.sql_text, sqlserver.plan_handle) WHERE (sqlserver.like_i_sql_unicode_string(sqlserver.sql_text, N'--Test these queries%')) ) ADD TARGET package0.ring_buffer --we don't need a more permanent record or a bucket count WITH (STARTUP_STATE = OFF); GO ALTER EVENT SESSION CheckingSPsAndSQLStatements ON SERVER STATE = START; --V-----The Batch being tested starts here ------V GO --don't change this next line without changing the WHERE clause above --Test these queries ------------------------------------------------------------------- $SELECTEDTEXT$ ------------------------------------------------------------------ go DECLARE @Target_Data XML = ( SELECT TOP 1 Cast(xet.target_data AS XML) AS targetdata FROM sys.dm_xe_session_targets AS xet INNER JOIN sys.dm_xe_sessions AS xes ON xes.address = xet.event_session_address WHERE xes.name = 'CheckingSPsAndSQLStatements' AND xet.target_name = 'ring_buffer' ); SELECT the.event_data.value('(@name)[1]', 'varchar(80)'), CONVERT(datetime2, SwitchOffset(CONVERT(datetimeoffset,the.event_data.value('(@timestamp)[1]', 'datetime2')), DateName(TzOffset, SYSDATETIMEOFFSET()))) AS datetime_local, CONVERT(DECIMAL(6,3),round(the.event_data.value('(data[@name="duration"]/value)[1]', 'bigint')/1000000.0,3,1)) AS duration, Coalesce(the.event_data.value('(data[@name="statement"]/value)[1]', 'nvarchar(max)'), the.event_data.value('(data[@name="batch_text"]/value)[1]', 'nvarchar(max)')) AS [SQL], Coalesce(qp.query_plan,'') AS [Query PLAN], the.event_data.value('(data[@name="cpu_time"]/value)[1]', 'bigint') AS [cpu_time(microsSecs)], the.event_data.value('(data[@name="physical_reads"]/value)[1]', 'bigint') AS physical_reads, the.event_data.value('(data[@name="logical_reads"]/value)[1]', 'bigint') AS logical_reads, the.event_data.value('(data[@name="writes"]/value)[1]', 'bigint') AS writes, the.event_data.value('(data[@name="row_count"]/value)[1]', 'bigint') AS row_count FROM @Target_Data.nodes('//RingBufferTarget/event') AS the (event_data) outer APPLY sys.dm_exec_query_plan( Convert(varbinary(64),--convert to valid plan handle '0x' + the.event_data.value('(action[@name="plan_handle"]/value)[1]', 'nvarchar(max)') ,1)) as qp ALTER EVENT SESSION CheckingSPsAndSQLStatements ON SERVER STATE = STOP; |
Listing 4
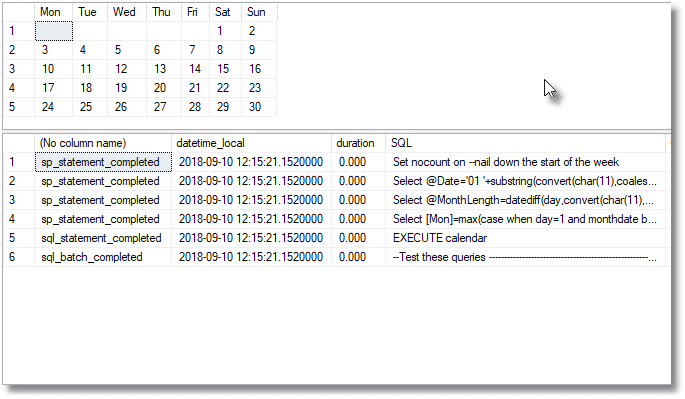
As an example, I’ve used it here to check on an old stored procedure of mine which lays out a calendar of the current month, or any month you specify.
Conclusion
If you want to use Extended Events for developing code, it is well worth stepping back for a moment to create snippets or templates, so that you can reuse these test harnesses as you develop.
They save a great deal of time spent trying to work out what exactly is making the code run slowly. You don’t always need a great level of detail when tackling performance problems, and I will generally time whole sections of code before focusing at the SQL Statement level. However, when you want to get to the detail, there is nothing else to compare with a test harness that is based on Extended Events.
Tools in this post
You may also like
-

Article
Exploring New SQL Prompt Features in SQL Toolbelt and SQL Toolbelt Essentials
Roseanna Whitelegg explores new SQL Prompt functionality that has been added to SQL Toolbelt and SQL Toolbelt Essentials to help teams increase their productivity, improve code quality, and make collaboration easier.
-
Article
SQL Prompt Snippets to Drop Columns and Tables and Handle Associated Dependencies
Louis Davidson provides a pair of SQL Prompt snippets that will help you deal with dependencies, whenever you need to drop columns or tables.
-
Article
SQL Prompt ALT S Magic
Use the SQL Prompt Command Palette to find and execute 'hidden' SQL Prompt functionality, plus any of the common SSMS commands, as well as search for database objects.
-
Article
Problems with adding NOT NULL columns or making nullable columns NOT NULL (EI028)
Phil Factor explains the problems you might encounter when adding a non-nullable column to an existing table or altering a column that contains NULL values to be non-nullable. He demos a migration script that can deploy such changes safely. You might also learn that in an archaic form of the Scots language, used in Cumberland, the number 17 is "tiny bumfit"; I think the tiny bumfit bus goes from Penrith to Carlisle.
-
Article
SQL Prompt Tip: how to control when the suggestion box pops up
By default, SQL Prompt shows code auto-completion suggestions automatically, and continuously. Phil Factor shows how to control this behavior, for the times when you need it to be a little less intrusive, such as when working through more intricate coding problems that require careful thought.