


Integrating SQL Monitor into a Tier-1 Alert and Notification System
SQL Monitor provides detail-level diagnostic data that will allow an expert to drill down to establish the cause of, and a fix for, any database problem. However, with support for webhooks, it can also contribute alerts to the sort of "Tier 1" alerting and paging system that an operations team might use to get an immediate notification of an urgent problem, anywhere on the network, and then coordinate a timely response.
Database monitoring is just one part of a broader system of monitoring that allows an organization to respond in a timely and appropriate fashion to any cause of disruption to their services. Whereas a database developer will likely see the database as being the main focus of attention, an operations team will know that any component in the system can cause down-time. I’ve explained in previous articles both why it makes sense to provide a tiered approach to keeping a production database application in good shape, and how this tiered system would need to be implemented, to allow an effective, department-wide response to any database alert.
SQL Monitor’s base monitoring stations are installed on servers and will already be monitoring the system, firing alerts where necessary, and establishing baselines. Using webhooks, it can feed alert notifications into a tier 1 alerting system for the databases. Of course, it is important to be able to tweak the notification system so that only the appropriate alerts are sent to the tier 1 system, and the Ops team receive a manageable number of alerts on which they can always act.
With this sort of system in place, SQL Monitor can also play a useful part in coordinating the work of the whole team, in maintaining the required service level for any database system that uses SQL Server or PostgreSQL. When supplemented by custom monitors that can check the specific database application, this should provide everything required for a tier 1 alerting system.
Understanding how SQL Monitor collects monitoring data
The simplest approach is to use SQL Monitor and webhooks to provide database alerts for any notification system, pager, or a team-coordination software such as Slack. If you are lucky, and SQL Monitor supports your choice of notification system, you just use the web interface of SQL Monitor to instruct the base monitor service to send notifications to the Webhook interface of your notification system. Having done that, it can then be a simple matter of selecting what alerts should or shouldn’t go to the notification system via webhook messages.
If you’re not so lucky, and you aren’t able or willing to change to a supported notification system, it is still possible to connect monitor alerts, but you’ll need to do some scripting. It’s not such bad news as you’d think because it gives you more flexibility in the way that you can filter the alerts. For this task, it helps to understand a little bit about how SQL Monitor’s component parts fit together.
SQL Monitor has three main components, a Base Monitor (usually referred to as the SQL Monitor monitoring service), a SQL Monitor database, or ‘data repository’, for all the monitoring data it collects, and a website. Each component can, if necessary, be hosted on a different server.
The Base Monitor runs as a service within the operating system, and it continuously monitors the servers, instances and databases assigned to it, wherever they are located. It gathers information about them and stores it in the database, where it can analyze the data, creates baselines, aggregations, reports and so on. It then transmits the monitoring data (metrics and alerts) to the website. All you see when you run SQL Monitor is the website, which you can navigate to check on your databases.
A single base monitor will generally be able to monitor both remote and local servers, of various types. If you have only one Base Monitor and you can put a webhook interface on the same network, this is probably all the background you need. However, when monitoring a large estate of servers, spread across different network domains, it is often better to install one base monitor per network. This could be necessary when monitoring both cloud-based and on-premises servers, when servers are geographically dispersed, or when you are monitoring very large estates (SQL Monitor can cope with monitoring about 250 servers per Base Monitor).
In multiple base monitor installations, one of the base monitors is designated as the primary base monitor and will handle all user authentication. Each base monitor sends the metric and alert data, for its network of servers, to a single Web Server service. Webhook notifications are sent by the base monitor responsible for monitoring the server against which the alert was raised. Therefore, where an installation has more than one base monitor, the webhook destination, normally the team’s notification system, will need to be accessible across the network rather than just to the primary base monitor.

SQL Monitor connects to remote servers using WMI for Windows and SSH for Linux, and it interrogates the SQL Server service running on them conventionally via TDS. The WMI protocol used by SQL Monitor can either use DCOM or WinRM for transport.
Using SQL Monitor Alerts in a Tier 1 alerting system
SQL Monitor’s base monitor will raise alerts when it detects problems in any of the database servers assigned to it. These will warn you of impending problems and also provide the supporting details that you would need to diagnose the cause and understand how to act. The different alert types range widely in their importance and their potential impact on the service.
In a Tier 1 notification system, these alerts need to be very carefully selected. Many SQL Monitor alerts provide a ‘Tier 3’ level of detail, intended for use in investigations once a problem has been established. They will either be of only marginal use or will swamp the first tier of the notification system. No on-call DBA would appreciate being tipped out of bed to respond to a CPU Underutilization alert, for example. Of course, all this ‘tier 3’ level of detail is still available for the DBAs or database developers, where necessary, for an investigation.
SQL Monitor alerts have default settings but are easily configurable, either by PowerShell scripts or via the website. It is certainly possible to manage Alert Settings in SQL Monitor to turn off webhook notifications for any types of alerts that aren’t part of tier 1 alerting, but you might prefer a cruder system that filters out every alert except for those that have been escalated to high severity.
From my own experience, I’d suggest a system that passes all alerts that, when severe, constitute a Tier 1 alert, and then do further filtering of these within the interface, passing on only those that your team judges to be significant. I’ll show how to do this in this article.
How SQL Monitor notifies a paging or workflow system of an alert
SQL Monitor will send notifications of ‘event’ and ‘continuous’ alerts, by whatever means you specify. As I explained in Supporting a Production Database: What’s Required, any alerting system used by an organisation must be designed to support a tiered response, where the development team, service desk personnel or on-call expert are notified, as appropriate, by whichever means they find most suitable.
SQL Monitor will notify when alerts are raised, an alert level increases (e.g., from Medium to High) or when an alert ends. It can, ‘out of the box’, send these alert notifications directly to email systems, SNMPV2C, or to a messaging platform such as Slack.
Handily, for our purpose of integrating SQL Montor into a tier 1 alerting system, it can also use webhooks to send alert notifications, for example to Enterprise-level Service Management Systems such as ServiceNow, Webex, Microsoft Teams, Jira or ZenDesk. We can also create custom webhooks to send notifications to other alerting systems such as Prometheus, Alertmanager, Synology Chat or Grafana.
When an alert triggers the webhook, SQL Monitor’s base monitor sends the notifications to the URL endpoint specified by the receiving system, with all the alert information included in the request payload (usually JSON format). Webhook notification messages can be sent whenever any alert begins, escalates, de-escalates, or ends. You can set up SQL Monitor to push alert notifications to whatever Webhook URL you choose. You can customize the format of the message sent, including the use of custom parameters.
Using Webhooks to send alerts to other notification systems
The SQL Monitor Webhook payload is a fairly complicated JSON document. By default, it looks something like this:
|
1 2 3 4 5 6 7 8 9 10 11 12 13 14 15 16 17 18 19 20 21 22 23 24 25 26 27 28 29 30 31 32 33 |
{ "messageType": "AlertNotification", "id": 1234, "name": "Example Alert", "description": "this is the description for the alert being generated", "eventDateTime": "2023-09-05T09:04:22.5688268Z", "raisedDateTime": "2023-09-05T09:03:22.5688268Z", "statusChange": "Escalated", "severity": "High", "previousSeverity": "Medium", "monitoredEntity": { "cir": "Root[].[Cluster][[Name]=localhost].[SqlServer][[Name]=sql2017].[SqlProcess][[LoginTime]=27/11/2019 11:22:08;[SessionId]=64]", "groupName": "Group", "name": "localhost", "clusterName": "Cluster", "machineName": "localhost", "sqlInstance": { "name": "sql2017", "displayName": "sql2017", "alias": "PROD-0001-2017" }, "tags": [ { "name": "TestTag1" }, { "name": "TestTag2" } ] }, "baseMonitorGuid": "04b2899e-8551-4002-9b7e-f56671b81841", "detailsUrl": "https://example.com/to-sql-monitor-installation/alert/details/1234" } |
In the webhook setup in SQL Monitor (Configuration | Notification settings), you can select Custom message and, using a collection of customer message parameters, change the content to suit the requirements of your notification system.
Unfortunately, because there is no standardization for a webhook payload, there still are occasions when SQL Monitor cannot send a message that is acceptable to the receiving message system. For example, I like to use Synology Chat for alerts, for all my automated processes. It will happily receive and use webhooks, but it insists that the JSON message must be wrapped as a value in a ‘payload’ key. It can only actually use a text string …
|
1 2 3 |
payload={ "text": "This should work" } |
While we can change the content of the message in SQL Monitor, we can’t change the format of the webhook itself. For example, it is impossible to change the name of the SQL Monitor webhook payload to ‘payload’.
As such, we’ll need a different approach. Rather than send the webhooks directly to the endpoint designated for our notification system, instead we’ll send them to an endpoint on the base monitor server, where we’ll have a PowerShell-based “webhook converter” listening for incoming webhook requests. It will process them, get the notification into the right format, and then forward on to the notification system any messages that meet the criteria for tier 1 alerting.
This Webhook interface can either run as a process on the base monitor server itself, or any other local server that the base monitor can access. Any external system, including SQL Monitor, can then send webhook notifications to the port on which this process is listening.
The webhook converter process
The webhook converter process performs the following tasks:
- Listens for incoming webhook requests on a selected port on thew base monitor server
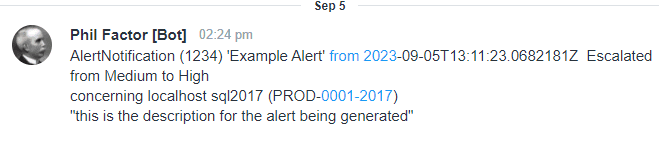
- Processes the webhook data – select the bits of information from the alert payload that we need to include and compose it into a notification message. This will filter out some of the verbosity in SQL Monitor’s default payload so that we end up sending a simple, easy-to-digest message like this:

- Filters out any alerts that aren’t sufficiently relevant to a tier 1 notification system
- Sends the release messages to specified URL endpoint, in the right format for that notification system
The webhook converter will be a PowerShell script, which performs each of the steps outlined above. If we create a scheduled task, we can run this script at system startup. All we need to do is:
- Open the Task Scheduler
- In the right-hand panel, click “Create Basic Task“
- Follow the wizard to set the task name and description.
- Choose “When the computer starts” as the trigger.
- Select “Start a program” as the action.
- Browse and select your PowerShell script.
- Complete the wizard, review the settings, and click “Finish“
This will schedule your script to run each time the system starts. Hopefully, it will keep running, but it will need to report any problems in a log. If it were for any reason to stop working, SQL Monitor’s UI will inform you of the fact.
Let’s see how this process accepts and process the alerts and sends the alert notifications, using Synology Chat as an example.
Sending notifications to the Synology Chat
We’ll start with the final step outlined above, making sure that we can reliably send a message, in the right format for our favorite notification system. In my case, this is Synology Chat, so we need a simple text message wrapped in a “payload” key:
|
1 2 3 4 5 6 7 8 9 10 11 12 13 14 15 16 17 18 19 |
function Send-SynologyChatMessage { [CmdletBinding()] param ( [Parameter(Mandatory = $true)] [string]$webhookUrl, [Parameter(Mandatory = $true)] [string]$message ) # Create a PowerShell object with the message content $messageObject = @{ text = "$message" } # Convert the payload object to JSON $messageJson = $messageObject | ConvertTo-Json $postParams = @{ payload = $messagejson } Invoke-RestMethod -Uri $webhookUrl -Method POST -ContentType "application/json" -Body $postParams } |
In this case, you need to get a URL from Synology Chat with a token that authenticates you. It took me a while to find out how; so here goes if you use Synology for Development work…
- Open up the DSM of the Synology NAS.
- Open the Main Menu and click on the icon for Synology Chat.
- When this opens, Click on your round user icon in the top right corner.
- Click on the ‘Integration’ link.
- Click on ‘Incoming Webhooks’.
- Click on the ‘Create‘ button.
- Finish the dialog and copy the Webhook URL.
Now we can send notifications from any automated process to Synology Chat. Although logs are still nice to have, it is really useful to have centralized access for alerts that will give you an alert on your mobile, when required.
Processing the alert data
The main body of the webhook converter process is the PowerShell that performs the first three steps outlines earlier. It listens for incoming webhook requests on port 8083 and processes any incoming webhook data (from SQL Monitor in this case). This involves composing the notification message into the right format, including all the required bits of information such as ID, name, host, database server, status change, severity, description. It then calls the Send-SynologyChatMessage to send the notification messages to Synology, in this case only if the severity of the current message is “High” or, purely for an example of alert de-escalation, if the severity of the previous message was “High”. In reality, you will add filters to suit your team, but this seems to give a reasonable protection from the stream of alerts.
Here is the barebones version. You will need, of course, to include the code to send the notification to your particular notification system that is equivalent to my sample code Send-SynologyChatMessage. You can add to the script to provide suitable destinations for other webhook messages.
|
1 2 3 4 5 6 7 8 9 10 11 12 13 14 15 16 17 18 19 20 21 22 23 24 25 26 27 28 29 30 31 32 33 34 35 36 37 38 39 40 41 42 43 44 45 46 47 48 49 50 51 52 53 54 55 56 57 58 59 |
$TheSynologyChatWebhook=<MyWebhookForTheDestination>'; $ThisWebhook='http://localhost:8083/' $listener = New-Object System.Net.HttpListener $listener.Prefixes.Add($ThisWebhook) # Set the URL and port you want to listen on $listener.Start() $NotAskedToStop=$true; Write-Host "Listening for incoming requests..." while ($listener.IsListening -and $NotAskedToStop ) { $context = $listener.GetContext() $request = $context.Request # Handle the incoming webhook request here $webhookData = $request.InputStream $reader = [System.IO.StreamReader]::new($webhookData) $webhookContent = $reader.ReadToEnd() $reader.Close() #$SQLMonitorMessage=[System.Web.HttpUtility]::UrlDecode($WebHookContent) $SQLMonitorMessage=convertfrom-json $WebHookContent # Process the webhook content as needed (e.g., standardizing the format) # Send notifications to your alerting system # Send a response (optional) $response = $context.Response $response.StatusCode = 200 $response.StatusDescription = "OK" $response.Close() # now assemble our text-based message from the SQL Monitor structured JSON message # $NotAskedToStop=$false; $MessageType=$SQLMonitorMessage.MessageType if ($MessageType -eq 'Stop') { write-output "Obeying a command to stop" $NotAskedToStop=$false; # so we ought to stop } else { $id=$SQLMonitorMessage.ID $Name=$SQLMonitorMessage.name $TheHost=$SQLMonitorMessage.monitoredEntity.Name $DbServer=$SQLMonitorMessage.monitoredEntity.sqlInstance.displayName $Alias=$SQLMonitorMessage.monitoredEntity.sqlInstance.Alias $statusChange=$SQLMonitorMessage.statusChange $raisedDateTime=$SQLMonitorMessage.raisedDateTime $Severity=$SQLMonitorMessage.Severity $PreviousSeverity=$SQLMonitorMessage.PreviousSeverity $Description=$SQLMonitorMessage.Description $Message=@" $MessageType ($ID) '$Name' from $raisedDateTime $statusChange from $PreviousSeverity to $Severity concerning $TheHost $DbServer ($alias) "$Description`" "@ if ($Severity -eq 'High' -or $PreviousSeverity -eq 'High') { [Net.ServicePointManager]::SecurityProtocol = "Tls12, Tls11, Tls, Ssl3" <a id="post-6953763-_Hlk146456900"></a>Send-SynologyChatMessage $TheSynologyChatWebhook $Message } } } # Stop the listener when requested $listener.Stop() $NotAskedToStop=$true |
Testing the webhook converter
You can test and fine-tune this script simply by running it in a PowerShell window and stopping it with the Stop-ScheduledWebhookTranslator cmdlet shown below. Here, we are running it from the server (hence the ‘localhost’), but it could be run from anywhere on the network.
|
1 2 3 4 5 6 7 8 9 10 11 12 13 14 15 16 17 18 19 |
$ThisWebhook='http://localhost:8083/' function Stop-ScheduledWebhookTranslator { [CmdletBinding()] param ( [Parameter(Mandatory = $true)] [string]$webhookUrl ) Try { Invoke-RestMethod -Uri $ThisWebhook -Method POST -ContentType "application/json" -Body '{"messageType":"Stop"}' } Catch [System.Net.WebException] { "The listener at $ThisWebhook isn't running" } Catch { write-error Error[0] } } Stop-ScheduledWebhookTranslator $ThisWebhook |
Configuring the webhook notification in SQL Monitor.
We assign SQL Monitor to use this local URL endpoint as the target of webhooks, rather than the final Synology Chat URL endpoint. The PowerShell process can examine every webhook and decide which are important enough for a tier 1 alerting system.
In SQL Monitor, you’d set up the webhook notification like this (in Configuration | Notification settings):

The notifications are sent to ‘http://localhost:8083/’, or whatever URL is appropriate (you may want to add an identifier to check against), whenever alerts are raised, escalated, de-escalated or ended. If your converter is working, and you have the right port number, it will check out when you hit the ‘Preview and Test’ button. There will, if all goes well, be a ‘chirrup’ sound from your desktop chat application, or phone.
Conclusions
When SQL Monitor introduced Webhooks, it became much easier to delegate the management of SQL Server or PostgreSQL databases, for a “tier 1” monitoring system, to SQL Monitor. This is because SQL Monitor will already be doing all the work to provide the data. When you have a large number of databases to maintain, it is simple to use all the data that is already being collected in the base monitors in order to feed selected alerts into an IT department’s existing notification system, so that the right people get the right alerts at the right time.
Tools in this post
Redgate Monitor
Real-time SQL Server and PostgreSQL performance monitoring, with alerts and diagnostics
You may also like
-

Article
How to monitor backups and other SQL Agent jobs using SQL Monitor
How to monitor any SQL job that runs on the SQL Server Agent so that you're alerted quickly if SQL Agent goes offline, or if a job fails, or fails to start, or is running slow.
-

Webinar
Wie geht es meiner Datenbank in der Cloud: Die Bedeutung von Monitoring von Datenbanksystemen in heterogenen Hostumgebungen
Mit den Möglichkeiten, welche das immer größer werdende Cloud Ökosystem bietet, überlegen mehr und mehr Firmen, wie ihre IT-Systeme gehostet und gemanagt werden sollten. Wir möchten die verschiedenen Aspekte des Hostings von Datenbankdiensten bei einem Cloud Provider diskutieren mit einem besonderen Augenmerk auf das Monitoring dieser Dienste.
-
Article
Introduction to Analyzing Waits using SQL Monitor
Phil Factor sets out with the modest aim of giving you enough of an introduction to waits to better understand the wait information you get from a SQL Server monitoring tool like SQL Monitor, and the rather overwhelming amount of information available in the underlying DMVs and Extended Events.
-
Article
SQL Server Licensing and SQL Monitor
How well do the SQL Server licenses you own match up with what you need for your current use? William Durkin explains how to use SQL Monitor to find out.
-
Forums
Redgate Monitor Forum
Real-time performance monitoring for SQL Server and PostgreSQL, with alerts and diagnostics


