


Cut SQL Server Licensing and Cloud Costs by Monitoring CPU Overallocation
If you're licensing your virtual SQL Servers by core, you may be missing out on a significant opportunity to reduce costs. By reviewing and potentially reducing the number of CPU cores allocated to over-provisioned servers, you can better align resources with actual workload demands. This applies whether you're running SQL Server workloads on-premises or in the cloud on IaaS platforms such as Azure VMs, AWS EC2, or Google Compute Engine, where you're likely to incur both unnecessary licensing costs and cloud compute charges.
In this article, I'll demonstrate how to use Redgate Monitor to assess whether a SQL Server VM is over-provisioned, allowing you to take steps to safely reduce its core count and ensure performance remains stable after the change.
The cost of over-provisioning CPU cores
When provisioning servers for SQL Server, it's not always obvious how many cores are needed to support the workload. As a result, it's common for DBAs (and vendors) to over-specify servers, only to discover much later that not all the cores were required, or that fewer cores would now suffice due to changes in the workload.
On-prem/data center over-provisioning
In on-premises datacenters, where hardware scaling isn't quick or easy, servers are often deliberately over-provisioned from the outset, unlike in the cloud, where resources can be scaled on demand.
If you're licensing on-prem SQL Server by core, particularly Enterprise Edition, then this over-provisioning can lead to significant and recurring costs. Let's say we have a 16-core VM running SQL Server Enterprise Edition, but monitoring shows that we only ever needed, or now only need, 4 cores to support the workload. Right-sizing CPU cores to match actual usage could save around $90,000 annually:
| Cores | Annual SQL Server Licensing Cost (list pricing, Aug 2025) |
| 16 | $120K+ |
| 4 | $30K+ |
Cloud VM over-provisioning
The same principle applies in the cloud. If VMs are over-provisioned in Azure, AWS, or another IaaS platform, you incur not just excess licensing costs but also additional compute charges, typically billed per vCPU. Using Azure SQL VM (license-included) pricing as an example:
| Cores | Monthly operating cost (Aug 2025) |
| 16 | $4600+ |
| 4 | $1150+ |
That’s a potential saving of over $41K per year for a single VM, illustrating the importance of monitoring to reassess resource requirements, once you lift and shift existing workloads into cloud VMs.
Note, though, that reducing the size of the VM to get a lower vCPU count will also reduce the amount of memory allocated. Check carefully that the downsized VM still meets both CPU and memory requirements. Conversely, cloud VMs are sometimes over-provisioned in cores specifically to get the required I/O and memory capabilities. In such cases, consider other measures to mitigate licensing costs, such as disabling hyper-threading or deactivating some processor cores.
Are you paying for too many CPU cores?
To safely reduce the number of CPU cores on a server, you must first review the CPU usage profile for the workload. This means:
- Monitoring general CPU usage levels
- Establishing baselines for other CPU-related waits and metrics
- Assessing the behavior of CPU-intensive queries – when they run, and how the server responds.
These metrics need to be tracked over a time frame that reflects the full range of workload activity so you can understand the resources required to maintain performance during both normal and peak periods. A server might appear underutilized right now, but what happens during month-end reporting, maintenance tasks, or other periods of peak demands, such as those triggered by seasonal activity or promotional campaigns?
Reducing cores affects parallelism, thread scheduling, and how SQL Server handles spikes in workload. If the reduction is too aggressive, it can degrade the performance of your applications and any other services hosted on the same VM.
The following sections demonstrate the steps I'd recommend you take, using Redgate Monitor and other tools, to assess whether you can safely 'downscale' a VM, reducing the CPU core count.
Review current core allocation using SQL Server licensing dashboard
The Licensing dashboard in Redgate Monitor (Estate | SQL Server licensing) provides a summary of core usage across your SQL Server estate. It shows the total number of cores allocated, grouped by SQL Server version and edition, for both physical and virtual servers. You can then drill into a Licensing information table to see how those cores are allocated across individual SQL Server instances.
You might choose to focus on VMs with more than the minimum allocation of four cores (Microsoft enforces a minimum of four core licenses per VM), or on specific servers with high allocations.
For example, the screenshot below shows five virtual servers running SQL Server 2019 Enterprise Edition, using a combined total of 80 virtual cores. By filtering the dashboard by SQL Server version and edition, the licensing table reveals core allocations per SQL instance, and you can review the CPU usage profile for each one. 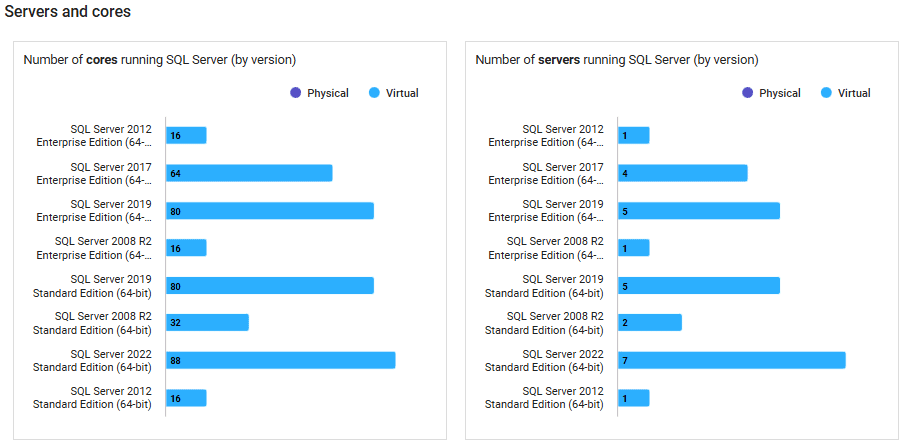
Review general CPU usage levels
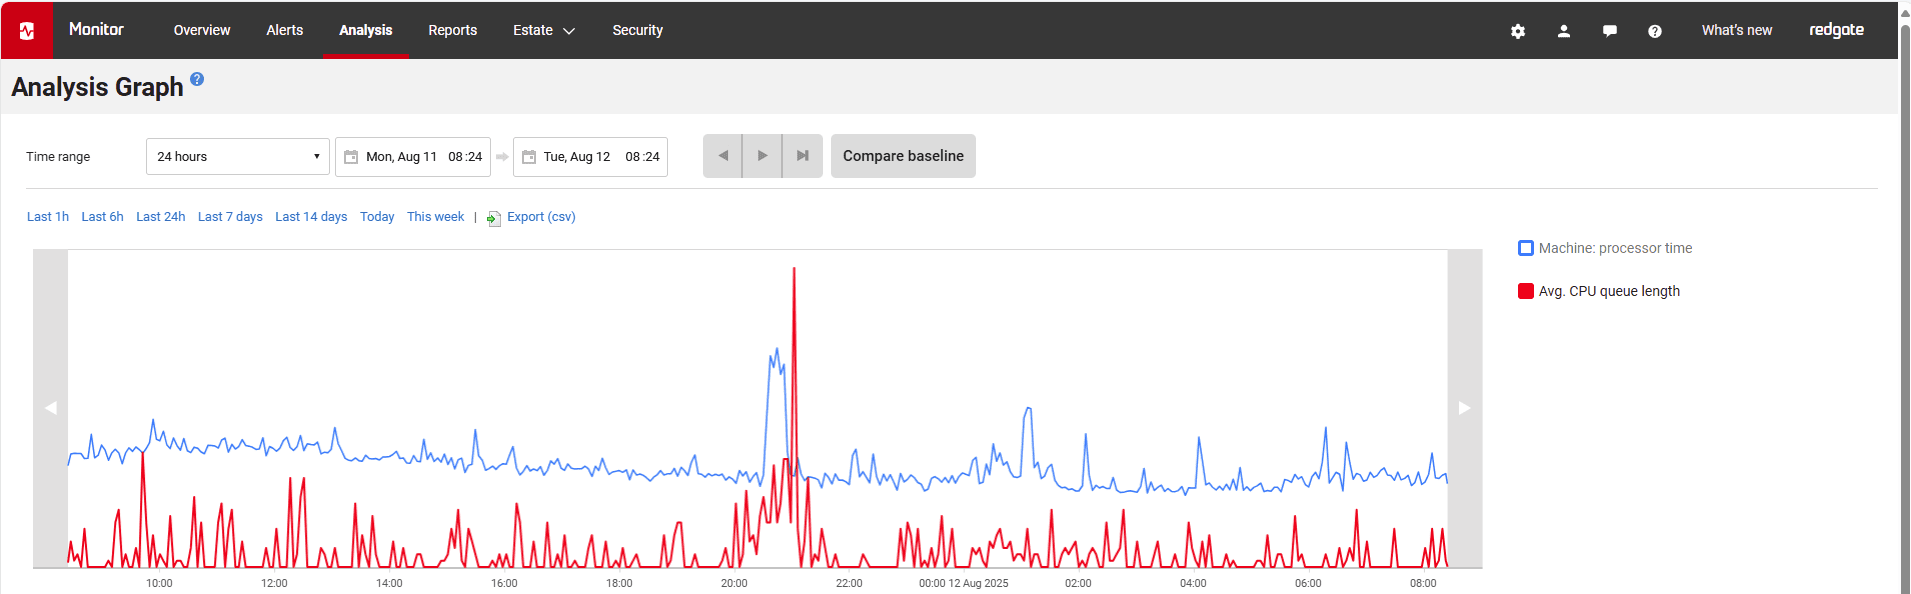
Redgate Monitor tracks both Machine: Processor Time and SQL Server: Processor Time as standard metrics and displays them on the Overview page for each monitored instance. Clicking either graph takes you to the Analysis section, where you can review baseline CPU usage over a longer period.
![]()
The servers best suited for core reduction are those where all the following are true:
- Sustained low CPU usage: Average CPU load remains consistently below 50% for at least a month
- Low usage during known peaks: CPU usage remains comfortably below saturation (e.g., under 70%) even during expected burst periods, such as month-end or quarter-end reporting.
- No strict performance requirements: the server doesn't have strict response-time requirements or time-sensitive queries in the workload.
If CPU usage is typically low but spikes at certain times, downsizing may still be viable, but it requires a closer look at what’s happening on the server during those peaks.
Examine the CPU workload in more detail
When CPU usage rises, especially during peak or busy periods, it's important to understand which parts of the workload are consuming CPU and whether those demands are sustained, critical, or avoidable.
Identify CPU-intensive queries
One of my favorite DMV-based queries comes from Glenn Berry's Diagnostic queries. It lists the most CPU-intensive queries on the instance and flags any that have missing index recommendations. You can correlate the results with Redgate Monitor's Top queries table to investigate what's running over periods of high CPU usage, and its Indexes table to review the most heavily used existing indexes.
|
1
2
3
4
5
6
7
8
9
10
11
12
13
14
15
16
17
18
19
20
|
-- Get top total worker time queries for entire instance (Query 44) (Top Worker Time Queries)
SELECT TOP(50) DB_NAME(t.[dbid]) AS [Database Name],
REPLACE(REPLACE(LEFT(t.[text], 255), CHAR(10),''), CHAR(13),'') AS [Short Query Text],
qs.total_worker_time AS [Total Worker Time], qs.min_worker_time AS [Min Worker Time],
qs.total_worker_time/qs.execution_count AS [Avg Worker Time],
qs.max_worker_time AS [Max Worker Time],
qs.min_elapsed_time AS [Min Elapsed Time],
qs.total_elapsed_time/qs.execution_count AS [Avg Elapsed Time],
qs.max_elapsed_time AS [Max Elapsed Time],
qs.min_logical_reads AS [Min Logical Reads],
qs.total_logical_reads/qs.execution_count AS [Avg Logical Reads],
qs.max_logical_reads AS [Max Logical Reads],
qs.execution_count AS [Execution Count],
CASE WHEN CONVERT(nvarchar(max), qp.query_plan) COLLATE Latin1_General_BIN2 LIKE N'%<MissingIndexes>%' THEN 1 ELSE 0 END AS [Has Missing Index],
qs.creation_time AS [Creation Time]
,t.[text] AS [Query Text], qp.query_plan AS [Query Plan] -- uncomment out these columns if not copying results to Excel
FROM sys.dm_exec_query_stats AS qs WITH (NOLOCK)
CROSS APPLY sys.dm_exec_sql_text(plan_handle) AS t
CROSS APPLY sys.dm_exec_query_plan(plan_handle) AS qp
ORDER BY qs.total_worker_time DESC OPTION (RECOMPILE);
|
Check for signs of CPU pressure in peak periods
Having identified the CPU-intensive queries running on an instance, you can investigate in more detail which ones are running over any period of high CPU usage and how the server coped.
In a server that is a candidate for downsizing, you'll want to rule out any signs of significant CPU pressure over these periods. For example, in Redgate Monitor, you can:
- Check the Waits chart on the Server overview page for the period – you are looking for low overall Signal wait times/sec, indicating that tasks are getting back onto the CPU quickly after the resources that they were waiting for became available, rather than waiting for longer periods in the 'runnable' queue (an indicator of CPU pressure)
- Check the Analysis page for consistently high values for these metrics:
- Machine: processor time – ideally, CPU usage is comfortably below threshold levels even during peak periods
- Avg. CPU queue length - ideally, you will see a low number of threads in the processor queue waiting to be executed (<10 per processor)
 What looks like a CPU bottleneck is often caused by something else — such as inefficient queries, poor indexing, or I/O and memory issues — so it's important to confirm whether the CPU is truly the limiting factor during peak periods
Often, a query or index tuning exercise to reduce unnecessary CPU cycles can resolve the problem. As just one example, if Redgate Monitor indicates high compilation rates (SQL Compilations/sec) relative to batch requests (Batch Requests/sec), it may indicate excessive ad hoc querying or poor plan reuse, both of which will inflate CPU usage. Tuning the workload may reduce pressure significantly and make downsizing feasible. You might also explore the use of the optimize for ad hoc workloads option to reduce CPU and memory wasted on single-use plans.
You can also investigate what other resource waits are observed while the CPU-intensive queries are running and assess worker thread availability and query parallelism behavior.
Monitor worker thread availability (especially for clusters)
When assessing whether a server is over-provisioned with CPU cores, it’s important to monitor available worker threads. This becomes especially critical when considering downsizing cores on an Always On cluster.
Tracking worker threads
Worker threads are a finite resource that SQL Server uses to process tasks. If too few threads are available, the server may appear CPU-bound even if the CPU usage looks reasonable. Of course, this is one of the risks we need to assess when considering a core count reduction. Fewer cores mean fewer schedulers and fewer total threads.
There is no 'out-of-the-box' metric in Redgate Monitor for tracking available worker threads, but we can easily create a custom metric for this, as follows:
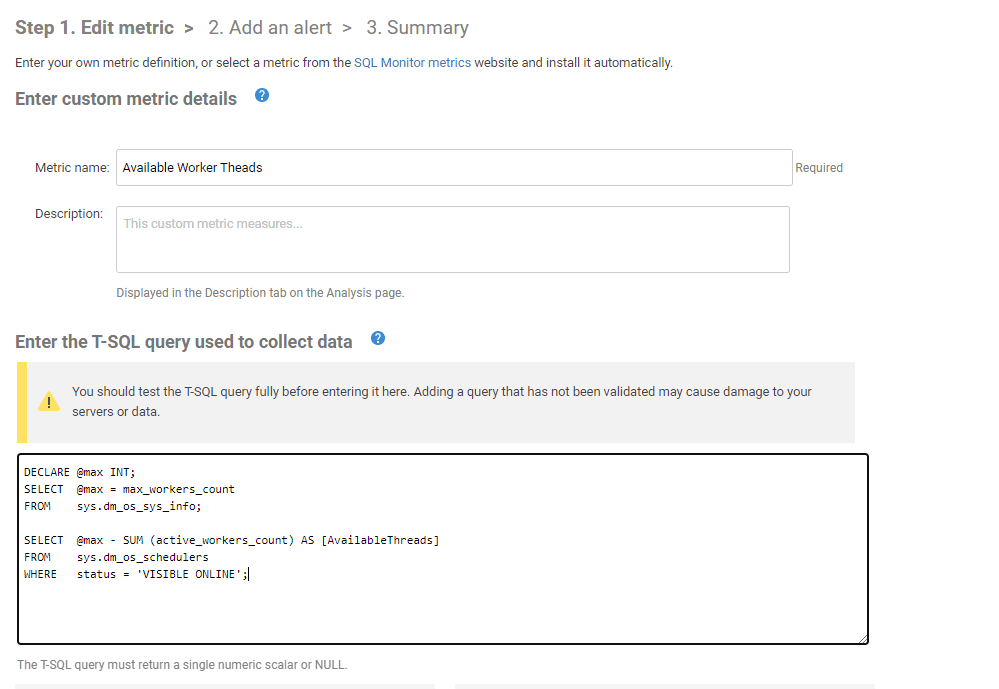
Using the same DMV, you may also want to track the length of the scheduler queue, especially if Redgate Monitor reports any significant scheduler-related waits like SOS_SCHEDULER_YIELD while CPU-intensive queries are running.
|
1
2
3
4
5
|
SELECT scheduler_id ,
current_tasks_count ,
runnable_tasks_count
FROM sys.dm_os_schedulers
WHERE scheduler_id < 255
|
A very high number of runnable tasks, like high signal wait time, might indicate insufficient CPU capacity to handle the workload during peak periods. That would be a clear red flag for downsizing without further investigation.
THREADPOOL waits during busy periods
If Redgate Monitor reports THREADPOOL waits during busy periods, it means a lot of tasks have to wait to be assigned a worker thread before starting execution. It usually occurs during highly-parallelized workloads and, observed on the current server, it would be another 'downsizing red flag'. A common cause is blocking, with many parallel tasks consuming the worker threads for long periods (see the Blocking processes report on the Server's Overview page).
Special considerations for clustered environments
Worker thread availability becomes even more critical in clustered environments, particularly those using Always On availability groups, which:
- Consume more threads than standalone servers, due to additional background tasks such as replica syncing and health checks. See this article for a good overview
- Experience sudden shifts in workload during failover, where one node may need to absorb the load from others
When assessing whether to reduce cores on a clustered server, we need to assess the workload on all nodes and ensure the primary node will have enough threads to handle the combined workload, in the event of loss of cluster nodes and failover. Reducing cores without considering thread availability could lead to performance degradation under pressure, even if average CPU usage looks acceptable.
Understand parallelism behavior
When SQL Server encounters a large query where the estimated cost of executing the plan serially exceeds the Cost Threshold for Parallelism, it may divide the work across multiple cores. The degree of parallelism (DOP) used depends on the number of logical processors, the Max Degree of Parallelism (MAXDOP) setting, and the number of available worker threads.
If a query previously utilized a high DOP (e.g., 8 threads) and you reduce the number of available cores to 4, SQL Server will limit that parallelism accordingly. This can lead to significantly longer execution times for those queries, especially if they run during peak periods or perform large scans.
Before downsizing, it's important to:
- Assess large parallel queries during peak activity – In Redgate Monitor, you can often retrieve the actual execution plan for these queries, where the Degree of Parallelism property shows how many threads were used.
- Review current MAXDOP and Cost Threshold for Parallelism settings – Redgate Monitor tracks these across your servers in the SQL Server configuration report. It will also let you compare two or more servers to spot differences in settings such as optimize for ad hoc workloads, MAXDOP, or cost threshold for parallelism. Do you have any that have strayed from best practice? Consider regular health checks to review these settings.
- Watch for signs of pressure – Look for parallelism-related waits (e.g.,
CXPACKET) or thread exhaustion (THREADPOOL) during busy periods.
On SQL Server 2016 SP2 and later, CXPACKET waits specifically indicate slowness caused by parallelism, while CXCONSUMER waits record the normal, expected parallel worker activity. While CXPACKET waits are not necessarily a problem, you'll want to investigate what other waits they appear alongside. If CXPACKET waits consistently occur with PAGEIOLATCH_XX, for example, it often points to inefficient queries causing unnecessary parallelism, something that could be addressed through query tuning or by increasing the cost threshold. If Redgate Monitors reports CXPACKET in combination with waits like LATCH_* or SOS_SCHEDULER_YIELD it may indicate that parallelism itself is causing contention. These patterns are important to monitor in a downsized system and may require adjustments to MAXDOP or the cost threshold for parallelism.
Making the change: reducing CPU cores
Once you've confirmed through monitoring that it's safe to reduce core count on a server, plan the change carefully with your infrastructure or VM team. Here are some of the important considerations:
Task checklist for CPU core downsizing
- Review the vendor's performance best practices – for example, Microsoft's Azure SQL VM checklist. Virtual machines have limits on IOPS, throughput, memory, and storage capacity based on their type, size, and configuration. Downsizing could inadvertently lower these limits and affect performance.
- Verify the VM family and features – check the cloud vendor documentation. If you're downsizing from E16bdsV5 to E8sV5, for example, make sure you understand all the other differences too.
- Review SQL Server parallelism settings – adjust in line with Microsoft's recommendations, as these are sensitive to CPU configuration. Reducing cores may mean there's less CPU available for parallel processing, so your existing settings might no longer be optimal.
- Plan the rollout – can cores be removed hot, or will the server require a reboot?
- Plan the rollback – if performance drops post-change, what's the plan? If a rollback is needed, how easy and fast is it to "resize up"?
Post-change monitoring
I've tried to demonstrate how you can use Redgate Monitor's long-term performance and configuration data to assess whether your current SQL Server workload, including peak periods, can be supported reliably with a lower CPU core count. If so, you may be able to reduce SQL Server licensing costs significantly.
However, reducing the CPU core count is not just a licensing or infrastructure change; it is likely to affect how SQL Server behaves. For example:
- Execution plans may be recompiled, as SQL Server adapts to the new CPU configuration.
- Memory grants may shrink, potentially affecting query performance.
- Queries that previously ran in parallel may now execute differently, or slower, because there's less CPU allocation available for parallel processing.
It's important to continue to monitor the server closely after the change:
- Track CPU usage and wait stats, especially during peak periods.
- Review performance and parallelism behavior of any CPU-intensive queries.
- Check in with business users to ensure performance remains acceptable.
- Implement your rollback plan if the change introduces unexpected contention or slowdowns.
Redgate Monitor provides the visibility you need, not only to plan core reductions safely, but to validate the results and act quickly if performance issues emerge.
Tools in this post
Redgate Monitor
Real-time multi-platform performance monitoring, with alerts and diagnostics
You may also like

Webinar
Inside a DBA’s Day: What Really Happens (and How to Stay Ahead)
Join database experts Hugo (an ex-DBA who’s lived the role) and Chris as they walk through a real-world day in the life of a DBA, using Redgate Monitor to stay in control.

Article
Monitoring the Application with Redgate Monitor: Website Activity
Using a PowerShell script that collects log data from a web server, plus a Redgate Monitor custom metric, Phil Factor offers a way to check for suspicious website errors and unusual patterns of activity, right alongside your database monitoring.

Article
Picking over the Bones of a SQL Injection Attack
The best way to learn how to protect your databases from SQL Injection is to to see it in action and confront its consequences. This article tells the story of an attack on a vulnerable SQL Server REST interface, explaining how the attack unfolds, the mistakes that made it possible, and Redgate Monitor's role as the 'canary in the mine'.

Live training session
Basic Tips for using SQL Monitor Successfully
In this 30 minute training session Kathi Kellenberger walks you through some of her best tips for using SQL Monitor successfully. Whether you are just starting out with the Redgate monitoring solution or use it on a daily basis you can get a demo of some of the basic functionalities and see what’s available within the dashboard menus. Some of the features Kathi will be demonstrating are: Adding Servers How to view alerts and drill down to more details How to zero in on a time period where there is a lot of activity Drilling down into top queries and
Article
Monitoring Azure SQL Database with Redgate Monitor
Grant Fritchey explains the Azure-tailored metrics and alerts that you need to diagnose performance problems with your Azure SQL Databases, and let you know which resource (CPU, data IO or log IO) is the bottleneck.
Article
Finding Inactive SQL Server Databases
Phil Factor demonstrates how to identify objects in a database that are not being used. The technique uses Extended Events to detect acquisition of Intent locks, and so determine which databases are active or apparently 'dormant', and then drills down to investigate on which tables data has been modified recently, and which views and stored procedures have been run.
Loading comments...