


Wait Class Monitoring for Oracle in Redgate Monitor
Why Wait Class Monitoring Matters
For seasoned Oracle DBAs and performance engineers, wait events and classes are the language of troubleshooting. They provide the "why" behind bottlenecks, immediately revealing the resources sessions are waiting on, rather than actively processing. Is it because they've stalled on CPU, are blocked by IO, or are constrained by memory or latching? By identifying what's holding things up, DBAs can focus their tuning efforts on removing the underlying cause of contention.
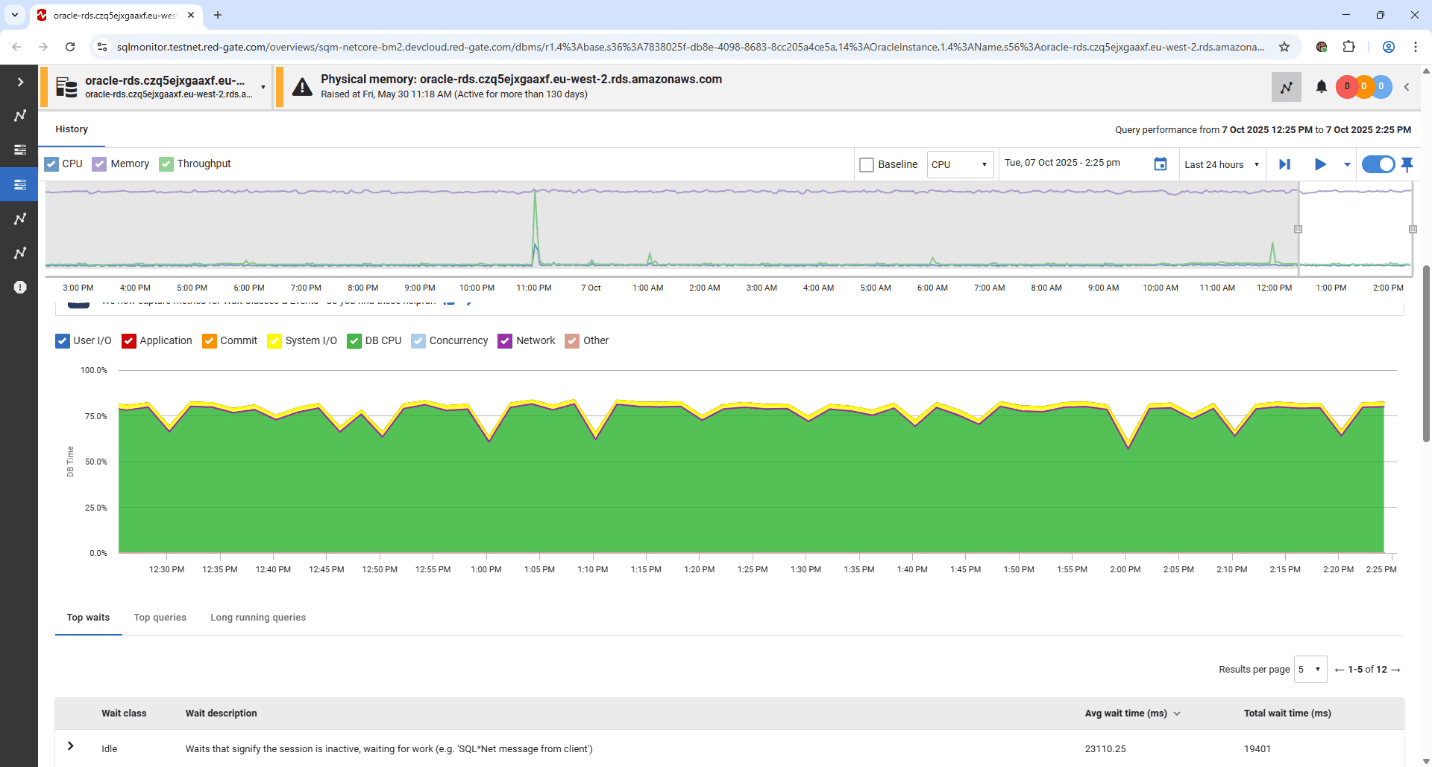
Fig 1: Wait Classes and Event chart and table
Oracle Wait classes and events
Wait events themselves can be many and granular, which makes them difficult to interpret at a glance. That's where wait classes come in. These categories (such as CPU, IO, Concurrency, Network, Commit, etc.) group events into meaningful buckets that give you an immediate, high-level picture of what’s slowing down your database.
Redgate Monitor displays stacked graphs of these wait classes (Fig.1, above), allowing us to see quickly if CPU is being used effectively, or if time is being lost waiting for resources to become available. We can filter wait classes, as shown in Fig. 2, in this case focusing in on the user I/O wait class (waits for data to be read from, or written to, disk):
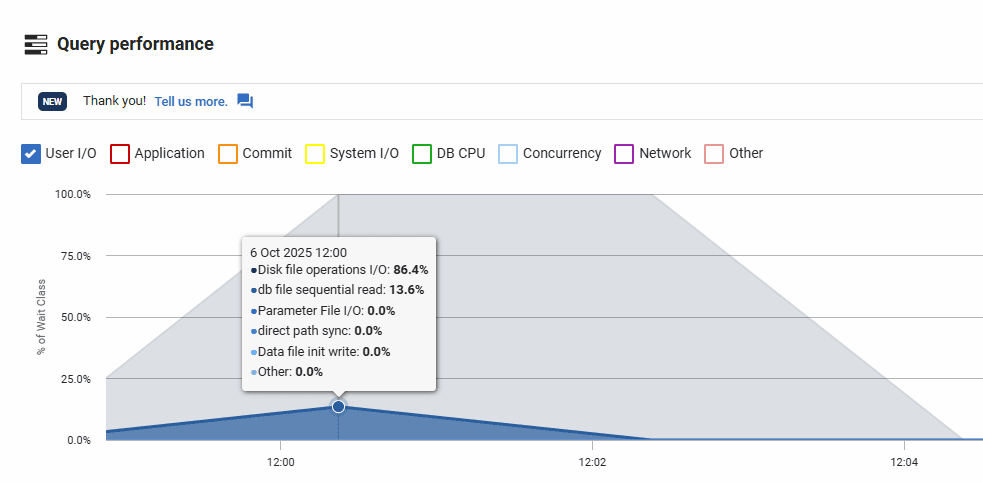
Fig 2: Filtering Wait Classes Chart to display only User I/O
We can then drill in and examine the total and average wait times for specific events within the wait class. In this example, the most prevalent user I/O wait event is db file sequential read (waits for Oracle to read a single block of data into memory):
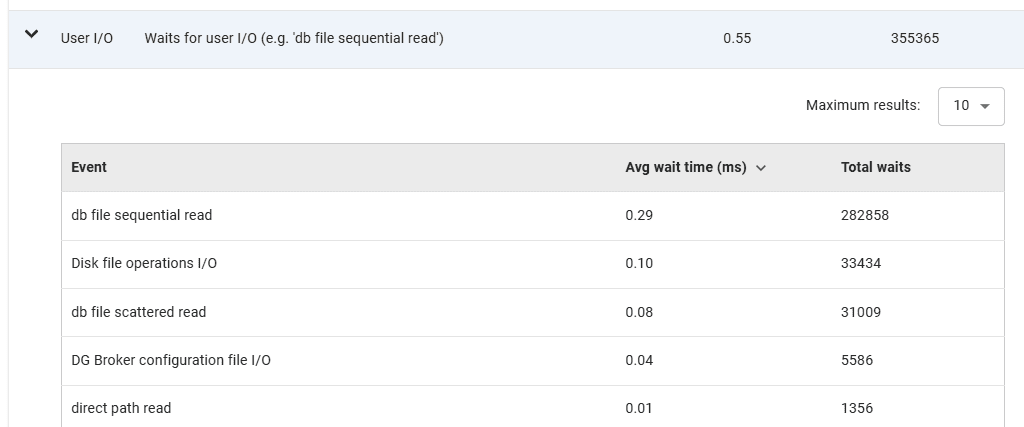
Fig 3: Wait Events nestled under a Wait Class
Visualizing the root cause of contention
With stacked graphs of wait classes now visualized in Redgate Monitor, it’s easier than ever to spot trends, find anomalies, and drill into the root cause of an issue. For example:
- Pinpoint when IO latency suddenly spikes and which PDB or single instance when it's most impacted.
- See whether CPU waits align with short or extended workload peaks.
- This information helps to identify when concurrency or lock-related issues begin stacking up across multiple sessions.
- It uses distinct color contrasts, making it easier to distinguish than in other vendors’ graphs.
This ability to visualize waits by class helps DBAs cut through the noise and focus their attention where it matters most.
A Single Pane of Glass for Oracle Performance
While wait class monitoring is the new star of this release, for Oracle, we've retained Redgate Monitor's renowned single pane of glass experience. At the very top of the Oracle dashboard, you'll still find the familiar overview of the top resource usage for CPU, IO, and memory.
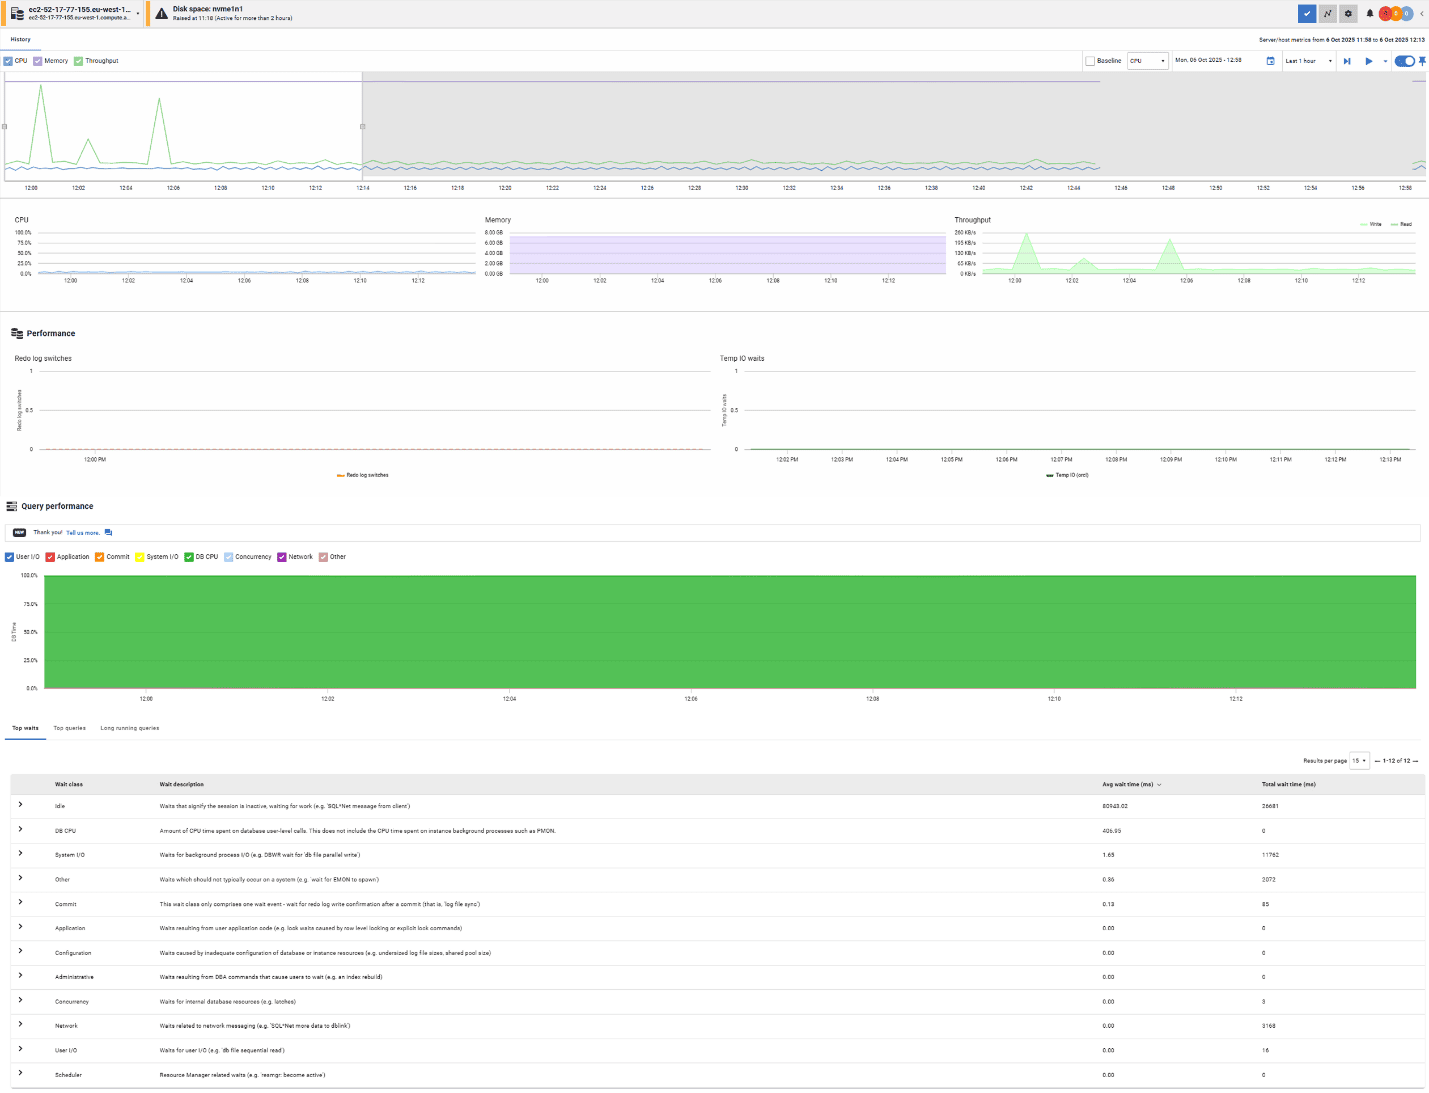
Fig 4: Example of an Oracle Server with high CPU DB Time
This combination of high-level resource usage alongside deep wait class insights offers a holistic performance view, perfect for both quick checks and in-depth troubleshooting.
Supporting the Full Oracle Landscape
Redgate Monitor now brings wait class visibility across all these architectures, whether you are running:
- A single instance Oracle database,
- A multitenant environment with multiple PDBs, or
- A Data Guard configured with standby databases,
This ensures consistent monitoring and actionable insights, no matter how your Oracle fleet is deployed.
A Milestone for Oracle Monitoring
This release gives Oracle database professionals clearer visibility into what’s really slowing down their databases. By surfacing wait classes visually in Redgate Monitor, it turns a traditionally deep-dive diagnostic into something DBAs can see, and act on, in seconds.
With performance issues easier to interpret at a glance, DBAs can quickly pinpoint the underlying bottleneck and respond faster when problems arise.
Try out wait class monitoring in Redgate Monitor and see how it transforms Oracle performance troubleshooting.
This document contains proprietary information and is protected by copyright law.
Copyright © 2026 Red Gate Software Limited. All rights reserved
Tools in this post
Redgate Monitor
Real-time multi-platform performance monitoring, with alerts and diagnostics
You may also like

Blog
Redgate Monitor Product Updates - July 2026

Blog
Loading comments...