


Smarter Custom Metrics for Redgate Monitor: Additional Alert Text Query
Redgate Monitor's built-in metrics cover the most common database pressure points out of the box. However, every estate has a few KPIs and metrics that are specific to the business, and users can create custom metrics to track those signals and receive an alert when they cross a threshold.
Redgate Monitor 14.10 extends these custom metrics to support an additional alert text query, so that the associated alerts already include the diagnostic context you'd normally need to gather after the fact.
Adding diagnostic context to custom metrics
Custom metrics are driven by a SQL query that returns a single numeric value. This makes them lightweight and ideal for threshold-based alerting. However, you may then need to run additional diagnostic queries manually to collect the information that explains what has changed or where to look first.
For example, let's say a user has installed a custom metric to track the number of failed SQL Server login attempts in the last 10 mins. When the alert triggers, they will need to switch to their SQL client and run follow-up queries to answer the next obvious question: which logins failed?
An additional alert text query removes this extra step. It is simply an optional query you attach to a custom metric. Redgate Monitor runs it during metric collection and saves the output (in this case the identity of the failed logins), alongside the metric value. When the alert fires or escalates, that output appears in the alert details page and is included in email notifications.
The result is a custom metric alert that not only warns you that a threshold was breached but also provides the key details you need to start troubleshooting straight away, such as which database file grew (data vs. log), which login failed, or which database user was added. This helps DBAs triage faster and focus their investigation on fixing the problem, which often leads to faster resolution.
Let's look at a couple of examples.
Unexpected database growth: which file is growing?
In a well-monitored database estate, database file growth shouldn't come as a nasty surprise. For example, if you’re tracking Redgate Monitor's built-in metrics for Free disk space and Unallocated space in a database file, you can plan capacity requirements well in advance of any trouble.
However, you still want to track total database size as a safety net, because unexpected growth events can and do happen. Redgate Monitor's custom metric library contains the custom metric you need:
|
1
2
|
SELECT SUM(size) * 8.0 / 1024.0 / 1024.0 AS SizeInGB
FROM sys.database_files;
|
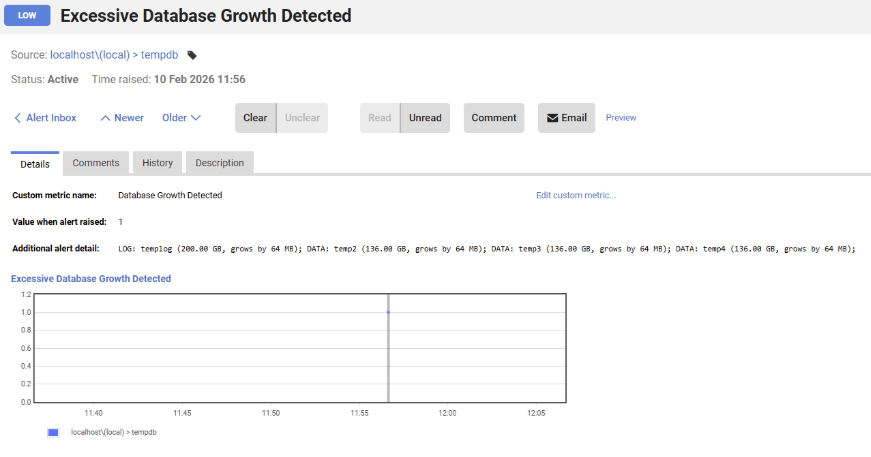
Now, if your Sales database grows unexpectedly, you'll be warned with an alert. However, before you can dig into why, you’ll need the next layer of detail: which file grew (data or log)? And by how much?
This is where the additional alert text query helps. During custom metric setup, we can add an optional query that lists the biggest database files and their settings, so the alert tells you which file grew, whether it’s data or log, its current size, and whether it grows by MB or %:
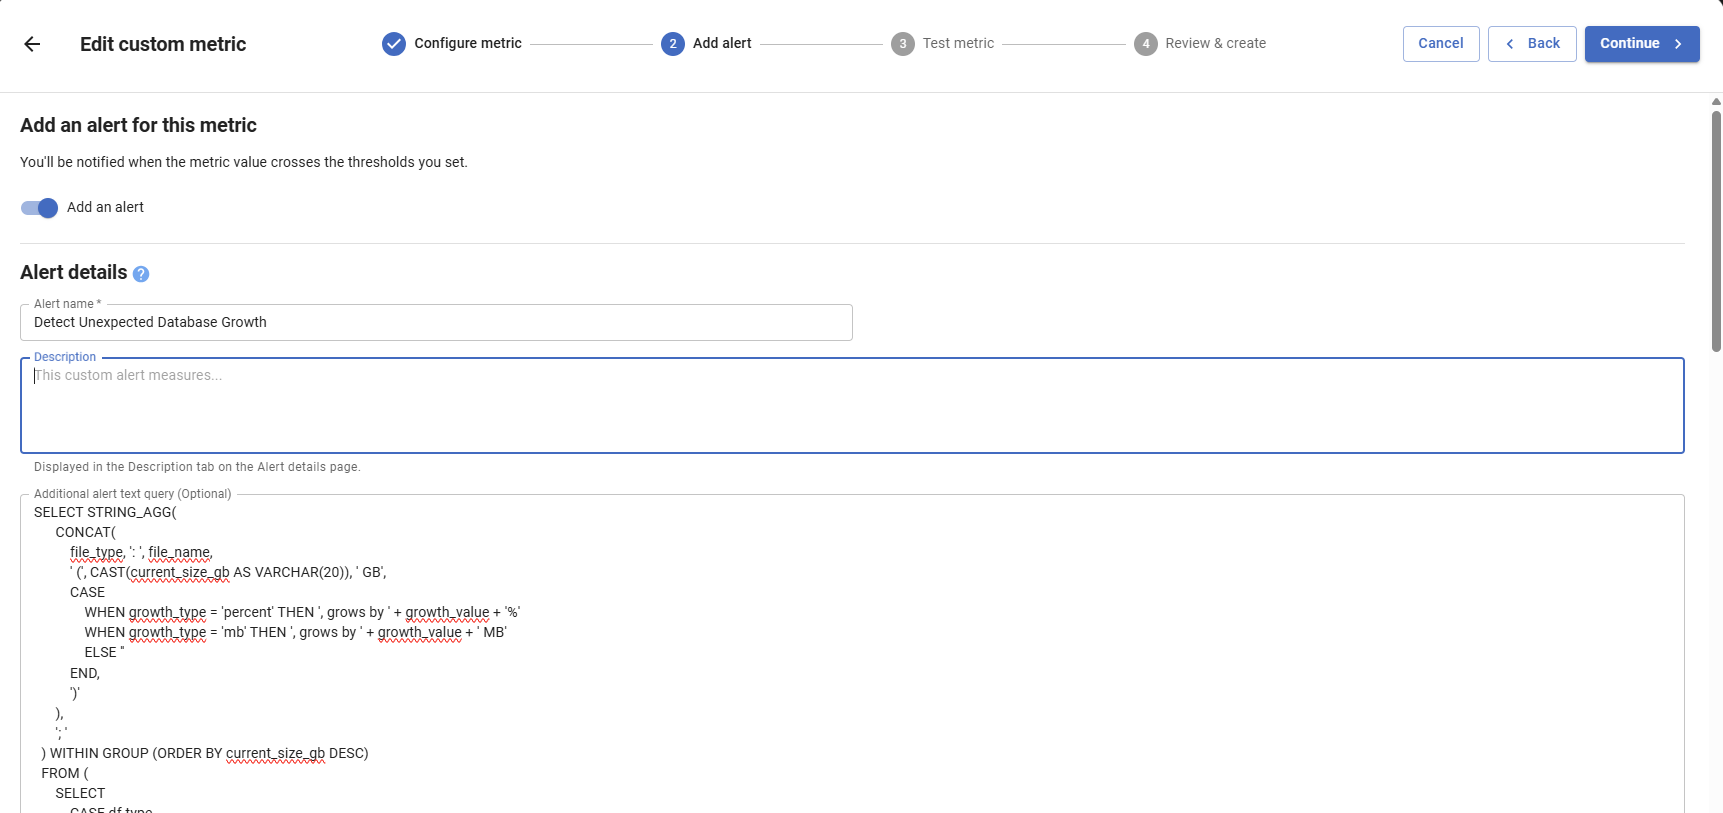
Now, when the "total database size" alert fires or escalates, you'll see immediately whether you’re dealing with explosive log growth, data file growth, or just an unsuitable autogrowth setting.
This will speed up triage and can help you get ahead of the problem before it degrades database performance and end users feel its impact.
Database user added: who was added and where?
DBAs often need visibility into database user creation to maintain security and spot unauthorized access. Without monitoring, unexpected users can appear, and permission changes can go unnoticed.
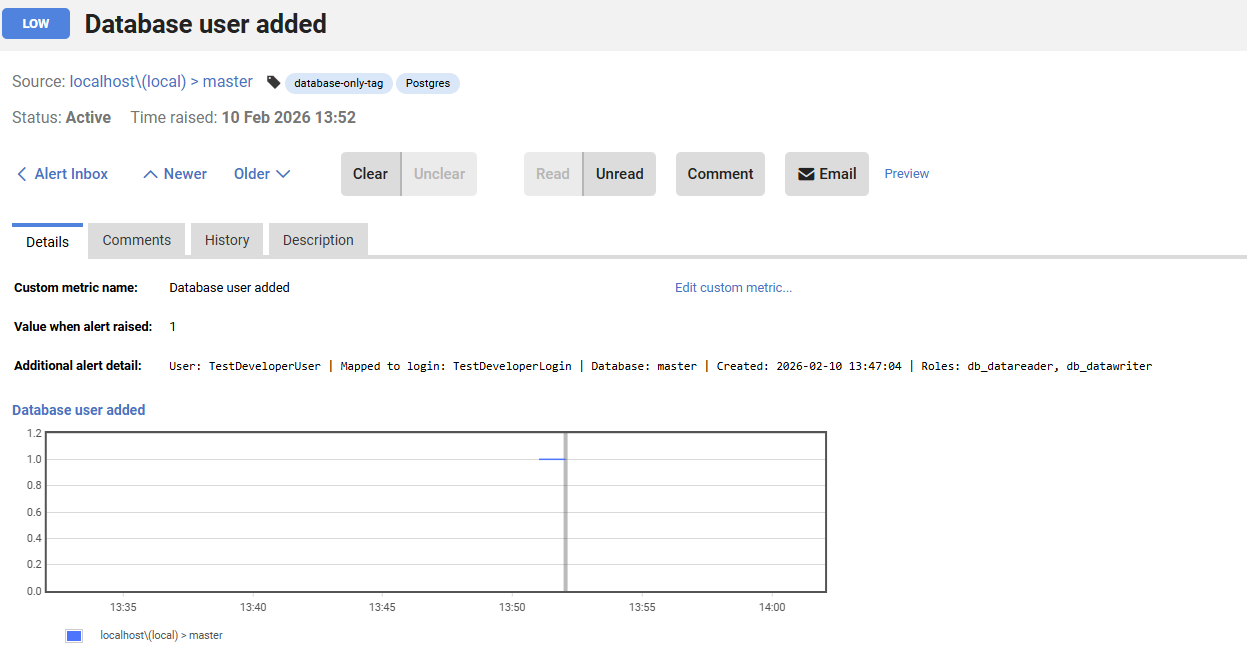
Now, imagine you have a custom metric monitoring database user creation, and an alert is raised. You need quick answers to questions such as: which user was added? On which database? Which login is it mapped to, if any? What roles or permissions did they get?
With an additional alert text query that gathers this information, it's included directly in the alert details and notifications, so you can immediately assess the risk and decide what to do next, without running follow-up queries.
|
1
2
3
4
5
6
7
8
9
10
11
12
13
14
15
16
17
|
SELECT TOP 1
'User: ' + dp.name +
' | Mapped to login: ' + ISNULL(SUSER_SNAME(dp.sid), 'No login mapping') +
' | Database: ' + DB_NAME() +
' | Created: ' + CONVERT(VARCHAR, dp.create_date, 120) +
' | Roles: ' + ISNULL((
SELECT STRING_AGG(roles.name, ', ')
FROM sys.database_role_members rm
INNER JOIN sys.database_principals roles
ON rm.role_principal_id = roles.principal_id
WHERE rm.member_principal_id = dp.principal_id
), 'None') AS AlertDetails
FROM sys.database_principals dp
WHERE dp.type IN ('S', 'U', 'G')
AND dp.create_date >= DATEADD(HOUR, -1, GETDATE())
AND dp.name NOT LIKE '##%'
ORDER BY dp.create_date DESC;
|
Summary
Redgate Monitor 14.10 now supports additional alert text query for Custom Metrics, so the associated alert details and notifications will include the supporting context you normally have to query manually. Whether you’re using custom metrics to track unexpected database growth, suspicious user activity, or some other estate-specific KPI, this extra alert detail helps you triage faster by showing you where to look first. DBAs spend less time collecting evidence and more time fixing problems.
This document contains proprietary information and is protected by copyright law.
Copyright © 2026 Red Gate Software Limited. All rights reserved
Tools in this post
Redgate Monitor
Real-time multi-platform performance monitoring, with alerts and diagnostics
You may also like

Blog
Redgate Monitor Product Updates - July 2026

Blog
Loading comments...