The key to understanding and improving .NET code performance is examining as many aspects of code performance as possible. Performance bottlenecks sometimes lie in the way your code calls methods in third-party or framework assemblies but, without the source code, problems like this can be hard to identify.
ANTS Performance Profiler is a .NET code performance profiler, used to identify .NET code performance issues. With integrated decompilation, it lets you explore .NET code performance bottlenecks even in assemblies for which source code isn't available.
Integrated decompilation is powered by .NET Reflector, an assembly browser and decompiler. This technology is incorporated into the profiler, so even if you're working on a legacy application, or your application references third-party code, you can get right to the root of the performance issue. You won't even need to leave the .NET code performance profiler. Integrated decompilation can also highlight ways in which you aren't using third-party controls efficiently, or where those controls aren't performing as well as expected.
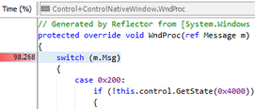
When you're profiling methods and assemblies with no source code file, you can generate source code from the profiler interface. Begin profiling, and select an area on the timeline where you want to investigate .NET code performance. In the Call Tree View, select the method that you would like to explore and click the Decompile button in the Source Code View:

This generates source code for the method. You can then browse and navigate the automatically generated code as if it were your own. The first line of the method body is highlighted:

If you have the assembly's .pdb file, you can even view line-level timings for the decompiled code, letting you identify the exact line that caused the bottleneck. The heat map alongside the vertical scroll bar helps you jump directly to the lines of code that account for the greatest execution time:

So, do the performance problems in your applications lie in your own code or elsewhere? With ANTS Performance Profiler, you can pin down .NET code performance problems wherever they lie.
To learn more, simply help yourself to a 14-day free trial of ANTS Performance Profiler.