Peering into and Parsing Application Log Files
How to use PowerShell cmdlets, such as Select-String, to glance at the contents of the application logs, or use them in conjunction with Regular Expressions to sift through log files in detail looking for particular types of error.
When you are using any application or tool regularly, you need to know if the logs are showing up any problems. This is particularly handy if you are hitting configuration difficulties. The log can become essential with the tools that use a service because the information it provides gives you your best chance of tackling tricky installation tasks. The logs also help with checking for warnings, errors and critical issues in any automated process.
None of us enjoy looking through log files. We prefer to be alerted only if an application is hitting issues, for example because it can’t connect to a server, or a required file is missing. Often, in an automated process, receiving an alert based on errors reported in the log is the only way we can be warned. I’ll show you how to peer into application log files, and dissect their contents in detail, using the logs for various Redgate tools as examples.
The location and format of Redgate logs
Redgate products produce several log files. There is good news and bad news about this.
The good news is that the logs for tools with a user interface are stored consistently, in a subdirectory for each tool. This is the $env:localappdata\Red Gate\Logs directory. You can see what is in your user area by executing
|
1 |
dir "$env:localappdata\Red Gate\Logs" |
The tools that run as a service, such as Redgate Monitor and SQL Clone, can’t guarantee to have an associated user area and so are often in a different directory. For example, the Redgate Monitor service logs are in %programdata%\Red Gate\Logs\Redgate Monitor.
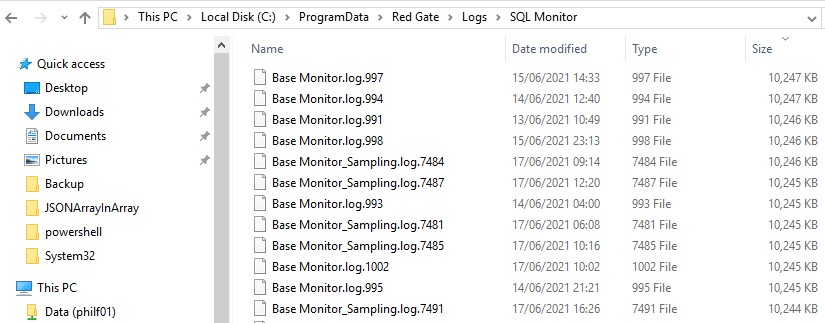
The Redgate documentation site maintains a list of the location of the log files for all the products. It is reasonably easy to inspect the log with a text editor and you can search the logs easily for problems. SQL Clone and Redgate Monitor will even zip them up and download them to you. By having a consistent location, it is easy to scan through the logs looking for possibly significant words such as ‘Warning’ or ‘Error’.
The bad news is that almost every tool uses a different format. For accurate monitoring of problems, you need to parse a log file to separate out each separate record, where each record may extend to several lines, and then select according to the contents of a particular column such as error-severity. This gives you the problem of having to create a different parsing system for each tool. I’ll be showing how to get around this sort of problem, but before I do so, I’ll look at some of the traditional ways of inspecting logs.
Peering at log files at arm’s length
In PowerShell, the Get-content and Select-String cmdlets are your friend when you are looking for something in application logs. They will tackle almost any sort of complex search, especially if you find Regex strings relatively easy. For Windows system event logs you don’t need them because you have Get-WinEvent.
Searching through a single log file
For our purposes, we’ll start by choosing a single file. To play along, you’d need to replace this with an existing log file on your workstation. For the time being I’ll just show simple searches as you’d use in any text file
|
1 2 |
$TheLog="$($env:localappdata)\Red Gate\Logs\SQL Doc 5\SQL Doc 5-2020_12_22.log" get-content $TheLog |
You can page through a long file (but not in the IDE).
|
1 |
get-content $TheLog |Out-Host –Paging |
The last line prompts you to page through the file:

You can just view the last five lines, or whatever you specify, as these will usually be the most recent.
|
1 |
get-content $TheLog -Tail 5 |
This technique becomes much more useful with an application such as SQL Clone Service or Redgate Monitor at a time that it is actively writing to the log, if you open up a new PowerShell window and execute
|
1 |
get-content $TheLog -Tail 5 -Wait |
Get-Content checks the file once each second and outputs new lines if present. You can just keep it going to see how the service is running.
You can look at the lines that have ‘error’ on the line by executing this:
|
1 |
Select-String -Path $TheLog -SimpleMatch 'Error' |
Or you can specify several alternatives…
|
1 |
Select-String -Path $TheLog -SimpleMatch @('Error','Warning','critical') |
You can just get the five last lines
|
1 |
Select-String -Path $TheLog -SimpleMatch 'Error' | Select-Object -Last 5 |
Even better, you can see more of the record that contained the word ‘error’ by displaying the lines before and after the line. This has specified one line before, and three after:
|
1 |
Select-String -Path $TheLog -SimpleMatch 'Error' -Context 1,3 | Select-Object -Last 5 |
If you know that your record is on a particular line, say line 45, you can display it, guessing that it will be 30 lines long.
|
1 |
Get-Content $TheLog |Select-Object -First 30 -Skip 45 |
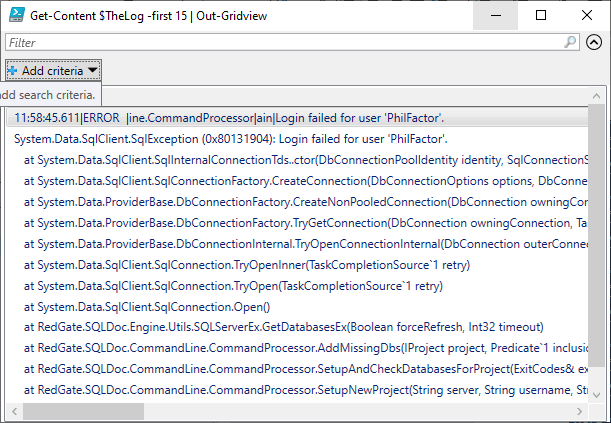
Naturally, you can use Out-Gridview to display the lines:
|
1 |
Get-Content $TheLog -first 15 | Out-Gridview |
Scanning several log files
Some logs are extraordinarily garrulous, whereas others only report an emergency. Normally, you need to scan several files to identify the log file that holds the information you need. The path can be a wildcard, so you can look through several files within a directory. You can then use Select-String cmdlet, which is designed to do as much as possible of the searches that GREP does, to scan for a string:
|
1 |
dir "$env:localappdata\Red Gate\Logs\SQL Prompt*\*.log" | Select-String -SimpleMatch 'Error' -Context 3 |
This gives you the line before and after, as well as the line that contained the word ‘error’. You get a MatchInfo object for each match which is displayed as the filename and line.
You can use this to provide a slightly easier layout:
|
1 2 3 |
dir "$env:localappdata\Red Gate\Logs\SQL Prompt*\*.log" | Select-String -SimpleMatch 'Error' | foreach{@{$($_.filename)=$_.Line}} |
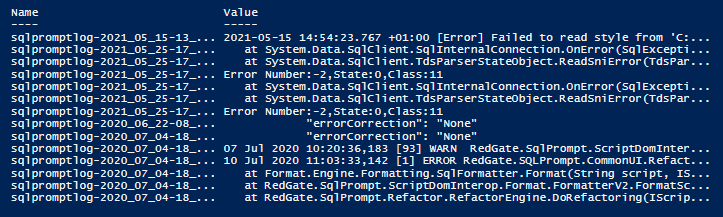
You’ll notice that you get false positives in our example because the word ‘Error’ appears rather a lot. What you need is to do instead is search for an error category in the ‘Type’ field. In this particular log, you could do this by looking for the '[Error]' string

However, even if you specify a context of preceding and following lines, you are a bit stuck if the value for the field stretches over several lines.
Parsing a log
To query logs, you need to be able to tease out specific fields. You might, for example, choose to select only those records at the Warning or Error log level. These are generally indicated as follows:
| Log Level | Value | Description |
| Trace | 0 | These are only used in development work to chase bugs and investigate performance problems. These messages may contain sensitive data such as passwords so are disabled outside development |
| Debug | 1 | For debugging and development. |
| Information | 2 | This tracks the application’s flow of processes (equivalent to ‘Verbose’ in PowerShell |
| Warning | 3 | For abnormal, odd or unexpected events and conditions that don’t actually cause the app to fail. |
| Error | 4 | For errors and exceptions that cannot be handled but indicate just a failure in the current operation or request, rather than an app-wide failure. |
| Critical | 5 | failures that stop the application dead. |
| None | 6 | Specifies that no messages should be written. |
You may want to look at just specific events by name or by ID. You generally use a filter to inspect just the message or details field that you need to see, because log entries can be long, especially when the details field often dumps an exception of unpredictable length.
The way you can parse a log depends on the way that the date is written, and the delimiters used between fields. There is no standard format for ‘structured logging’. The Redgate tools use a rich variety of formats, so a consistent way of listing recent errors in any of the installed Redgate products is just about impossible. For example, some logs are used for just one day, which makes retention periods easier to manage, but the downside is that they only record the time in the log and not the date.
Using Select-String with Regex Named Capturing Groups
The technique I use to deal with the variety of formats is to use the same way of parsing the logs, whatever tool produced it. I just vary the regex that I use to split the text of the log into columns and rows.
The Import-Log PowerShell function that we’ll use to parse the logs is provided below. It supplies the Select-string cmdlet with two mandatory parameters: the path the log file(s) and a regex ‘string splitter’, which varies by tool. This regex uses a named “capture group” to extract each part of the log record that we need, such as the date, the error number, log level, error details and so on. The last and most troublesome part of the log entry is the one that contains the details. It can run to several lines. I look for either the start of the next record (usually a date field) or the end of the file.
There is a third optional parameter, a scriptblock filter that assumes that you want only the Warning, Error or Critical log entries. However, you can change that to whatever you want by providing the scriptblock as a parameter, as I’ll be showing later in this article.
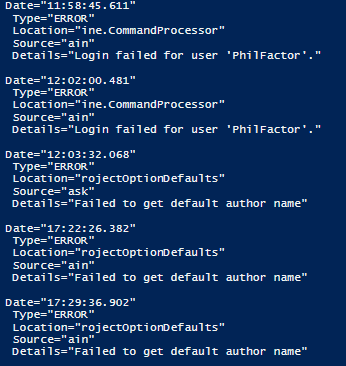
Having imported the contents of the log files, Import-Log uses the regex splitter we provide to parse it into columns and rows. It displays a record only if it matches our scriptblock filter. In the example cmdlet, I just output a string because it is easier to demonstrate, but the cmdlet can easily output an object, containing an array of log records, in the same way that Get-WinEvent does.
|
1 2 3 4 5 6 7 8 9 10 11 12 13 14 15 16 17 18 19 20 21 22 23 24 25 26 27 28 29 30 31 32 33 34 35 36 37 38 39 40 41 42 43 44 45 46 47 48 49 50 51 52 53 54 55 56 57 58 59 60 61 62 63 64 65 66 67 68 69 70 71 |
<# .SYNOPSIS imports a log and splits it according to a regex that has named capturing groups for each field .DESCRIPTION This is a way of selecting log entries that are of a particular type, such as Warning, error or critical. It can filter on any type of record if you do a custom filter. .PARAMETER TheLog the path to the log file .PARAMETER FilterScript #the regex for splitting .PARAMETER SplitRegex The Filter scriptblock .EXAMPLE $Prompt = [regex]'(?m:^)(?<Date>\d\d \w\w\w \d\d\d\d \d\d\:\d\d\:\d\d\,\d\d\d) \[(?<Number>\d+?)] (?<Level>.{1,20}) (?<Source>.{1,100}?) - (?<details>(?s:.*?))(?=\d\d \w\w\w \d\d\d\d|$)' #Search for all error, warning or critical log records in Prompt logs dir "$env:localappdata\Red Gate\Logs\SQL Prompt*\*.log" | foreach{ Import-Log $_.FullName $Prompt } #Search the details section of all log records for 'stringactiveStyleName' dir "$env:localappdata\Red Gate\Logs\SQL Prompt*\*.log" | foreach{ Import-Log $_.FullName $Prompt { $_.Name -ieq 'Details' -and $_.Value.Trim() -like '*StringactiveStyleName*' } } #> function Import-Log { [CmdletBinding()] param ( [Parameter(Mandatory = $true, #the path to the log file Position = 1)] [String[]]$TheLogFile, [Parameter(Mandatory = $true, #the regex for splitting Position = 2)] [regex]$SplitRegex, [Parameter(Mandatory = $false, #the filter script Position = 3)] [scriptblock]$FilterScript = <a id="post-5986390-_Hlk74906652"></a>{ $_.Name -ieq 'Level' -and $_.Value.Trim() -in @('Warning','Critical', 'Error') } <# this allows you to query on whatever fields you want. You specify the fields in the Regex query and so you can simply write the query that returns true or false for whether you display it. #> ) Select-String -Path $TheLogFile -pattern $SplitRegex -AllMatches | #slice into columns and rows Foreach { # row $_.Matches | foreach{ $include=$false; # only include if it meets our search criteria $CurrentMatch = ''; # put each column in its own line $CurrentMatch += $_.Groups | where { $_.Name -ne '0' } | foreach{ if (&$FilterScript) {$include=$true}; "$($_.Name)=`"$($_.Value.Trim())`"`n" } if ($include) { $CurrentMatch}; } } } |
The Regex strings to slice and dice log entries
There is a different regex string for every Redate product. In a similar way, you can parse or any other long semi-structured text files. Here the regexes required for a few different Redgate tools:
|
1 2 3 4 5 |
$SQLDoc= [regex]'(?m:^)(?<Date>\d\d\:\d\d:\d\d\.\d\d\d)\|(?<Level>.*?)\|(?<Location>.*?)\|(?<Source>.*?)\|(?<Details>(?s:.*?))(?=\d\d\:\d\d:\d\d\.\d\d\d|$)' $Prompt= [regex]'(?m:^)(?<Date>\d\d \w\w\w \d\d\d\d \d\d\:\d\d\:\d\d\,\d\d\d) \[(?<Number>\d+?)] (?<Level>.{1,20}) (?<Source>.{1,100}?) - (?<Details>(?s:.*?))(?=\d\d \w\w\w \d\d\d\d|$)' $Installation=[regex]'(?m:^)(?<Date>\d\d\d\d\-\d\d-\d\d \d\d\:\d\d:\d\d\.\d\d\d \+\d\d\:\d\d) \[(?<Level>.{1,20})\] (?<Details>(?s:.*?))(?=\d\d\d\d\-\d\d-\d\d \d\d\:\d\d:\d\d\.\d\d\d|$)' $SQLMonitor= [regex]'(?m:^)(?<Date>\d\d\d\d\-\d\d-\d\d \d\d\:\d\d:\d\d\,\d\d\d?) \[ {0,20}(?<Number>\d{1,10})\] (?<Level>\w{1,20}) (?<Source>.*?) - (?<details>(?s:.*?))(?=\d\d\d\d\-\d\d-\d\d \d\d\:\d\d:\d\d|$)' $SQLDataCatalog='(?m:^)(?<Date>\d\d\d\d\-\d\d-\d\d \d\d\:\d\d:\d\d\.\d\d\d \+\d\d:\d\d?) \[(?<Level>\w{1,20})\](?<Details>(?s:.*?))(?=\d\d\d\d|$)' |
These regexes are similar because they look for a date at the start of a line, as the start of a record. It must be picky as to what constitutes the date because dates can turn up in the stack-dumps from an exception, or in a description. Each field value is captured in a named capturing group. Notice that with the names of the capturing groups that you choose, you specify the keys. The body of the log can be several lines long and so we pick up everything until we either hit another date or the end of the string. For this, we use a positive lookahead.
Filtering for just the entries you want
The filter for the cmdlet is passed to it as a scriptblock (in the same way it’s done in the Where-object cmdlet). It can be changed to allow for other queries. By default, it looks for only those records of the Warning, Error or Critical Level, but you can edit it to make it specify whatever you like.
|
1 2 |
{ $_.Name -ieq 'Level' -and $_.Value.Trim() -in @('Warning','Critical', 'Error') } |
You can also override this default by providing your own scriptblock filter as a parameter. Here, you want to search all log record but return those where the string 'StringActiveStyleName' is mentioned in the details section of the record. Yes, I did once, when searching through the SQL Prompt logs, but it is a long story that would appeal only to geeks.
|
1 2 3 |
{ $_.Name -ieq 'Details' -and $_.Value.Trim() -like '*StringactiveStyleName*' } |
All you need to do is to specify what you need to filter. To filter on two conditions, you add an -or condition between two Boolean expressions.
Here is code to look through the current Redgate Monitor Logs for a specific network error reported in the details. You’ll need to set it to the right path for your Redgate Monitor logs.
|
1 2 3 4 |
dir 'PathToThe\Redgate Monitor\*.log' | foreach{ Import-Log $_.FullName $SQLMonitor { $_.Name -ieq 'details' -and $_.Value.Trim() -like '*Error Locating Server/Instance Specified*'} } |
Normally, you’ll only want to look through recent logs because this type of ‘brute-force’ search is never quick. It can also pay to do a quick search through the contents of a file for the specific string you are looking for (a -Like search is quicker than a regex search) before you go through the labor of parsing the file into records.
Conclusions
Like fire-extinguishers, parachutes or seatbelts, one only appreciates application logs when things go wrong. With GUI-based applications, there are plenty of ways to alert the user when things go wrong. However, in networks where there are many scripted processes such as a DevOps Database development, it pays to have ways of being alerted quickly to warnings or errors, that are below the obvious level of the email or Slack message. Here, a PowerShell process is ideal. When you are installing a complex tool into an unusual setting, the log can save a lot of time.
Tools in this post
Redgate Monitor
Real-time multi-platform performance monitoring, with alerts and diagnostics
You may also like
-

Article
Scaling Redgate Monitor to Large SQL Server Estates
Tony Davis describes the features and capabilities of Redgate Monitor that allow it to scale smoothly to monitor a growing estate of servers and databases, while still providing a single, simple dashboard that gives the team all of the essential SQL Server metrics and alerts, establishes baselines, and detects trends in behavior.
-

Article
Build and fill a database using JSON and SQL Change Automation
Phil Factor demonstrates how to export data from a database, as JSON files, validate it using JSON Schema, then build a fresh development copy of the database using SQL Change Automation, and import all the test data from the JSON files.
-
Article
Monitoring and Troubleshooting Deadlocks with Redgate Monitor
This article explains what SQL Server deadlocks are, why they occur, why they require immediate investigation, and the diagnostic data required to troubleshoot them. It then demonstrates an "Update Order" deadlock condition and shows how to find the cause quickly, in Redgate Monitor, using the Extended Events deadlock graph provided by the deadlock alert.
-

Article
Sharing SQL Prompt Code Snippets and Styles via the Redgate Platform
SQL Prompt users can now share formatting style or code snippets in designated Team spaces on the Redgate Platform. Louis Davidson explains how it works.
-

Webinar
Warum Datenbank-Monitoring unverzichtbar ist
Nimm an unserem Webinar teil und erfahre durch William Durkin (Mitgründer von Data Masterminds), wie er Datenbankmonitoring einsetzt, um kritische Systeme zu betreuen. Dabei wird er aus seiner jahrzehntelangen Erfahrung berichten, um echte Einsatzfälle zu beschreiben


