Spotting Unauthorized Configuration Settings in SQL Server
If someone makes unauthorized changes to SQL Server configuration settings, it could compromise the availability, performance or security of your servers. Using using Extended Events, and a custom metric, in Redgate Monitor, Phil Factor offers a way to get an immediate notification of such changes, and investigate their cause.
An attacker of SQL Server likes to be able to change the SQL Server configuration settings. In an ideal world, you will have left everything open for the intruder, but generally, every DBA reduces the surface of attack as much as possible.
Why would the attacker want to change these settings? You might think there’s limited risk in, for example, enabling ‘cross database ownership chaining’, or setting certain databases to ‘Trustworthy’, for a small number of databases, but intruders can exploit some of these settings to enable features that gain access to objects in other databases, or even take control of the whole server. They can use them to ship your data off to a remote server.
If you’ve disabled these, and other sensitive settings, you might think that your SQL Server is well locked-down, but it is surprising many attackers feel that they aren’t really trying hard enough if they don’t manage to escalate their permissions sufficiently to gain ALTER SETTINGS server-level permission, at which point they can alter server and database configuration settings at will. The sysadmin and serveradmin fixed server roles already have this permission, and sometimes more staff than necessary, within the organisation, are members of these roles. You really need to know when a change happens, and who did it.
It may not be the sign of an attack when the configuration changes. More generally, it is disconcerting to discover how often configuration items can get changed: For example, I’ve experienced times when a developer has done a legitimate ad-hoc data extraction via xp_cmdshell and forgotten to lock down its use afterwards.
In this article, I’ll explain how to detect any changes in server or database configuration settings, using Extended Events, and a custom metric, in Redgate Monitor. I’ll then refine the technique to report on unauthorized drift in the value of these settings, by storing the officially agreed values in an extended property and comparing them to the current values.
Sensitive Server and Database Configuration Settings
Certain Server configuration options only have a use in development. For a release candidate, these are generally closed off, to reduce the attack surface. Certain of these are particularly useful for an attacker, and so in a corporate setting your security specialist will generally check these settings before signing off a release.
- Ad Hoc Distributed Queries – if you were to set this on, users can then query data and execute statements on external data sources. It can be used to remotely access and exploit vulnerabilities on remote SQL Server instances.
- CLR Enabled – setting this on may be essential if you are running CLR but it introduces a risk, from both poorly-secured and malicious assemblies
- Cross DB Ownership Chaining – this should never be turned on at the server level, but rather enabled for specific databases only, using the
SETDB_CHAININGON. By enabling this, any member of thedb_ownerrole in a database can gain access to objects owned by a login in any other database. - Database Mail XPs – finding this enabled is ideal for the attacker because it allows them to exfiltrate data from the database server to a remote host, as an attachment to an email.
- OLE Automation Procedures – this is used by attackers to execute functions within the server that hosts SQL Server, within the security context of SQL Server.
- Remote Access – this can be used to launch a Denial-of-Service (DoS) attack on remote servers by off-loading query processing to a target.
- Remote Admin Connections – this only needs to be enabled for SQL Server failover clusters;
- Scan For Startup Procs – if this is enabled, SQL Server will automatically run all stored procedures that are configured to execute upon service start up. This allows an attacker a convenient way to maintain control of a server.
- xp_cmdshell – this setting is one of the most popular for the attacker, because it allows the authenticated SQL Server user to execute any operating-system command shell commands and return results as rows within the SQL client. This would include being able to exfiltrate data out of SQL Server to a remote host
There are two other sensitive, security options, which are not in the group of server configuration settings:
- Trustworthy – this is a database-level external-access option. It allows CLR assemblies or extended procedures to access objects in other databases, under certain circumstances. A user who is a member of the
db_ownerdatabase role can exploit this to include themselves in the System Administrators server role, and so take control of the server. See ‘Careful with Trustworthy Setting‘ - SA Account Status – this is a login setting. If you don’t need to use this, because Windows Authentication is available, then it should be disabled. An attacker may try to enable it, in order to do a brute force attack.
How to detect server and database configuration changes
SQL Server Audit will track changes to these configuration and security settings, but I need something more lightweight. Since one or two of the database settings can pose security issues, as well as many of the server settings, I decided on a single metric that covered both.
I describe a very simple approach to monitoring changes in the server and database configuration settings, but if you are just concerned with being alerted when a change is being made, it is sufficient. It relies on the fact that if you change any of these settings, an informational system message is sent, at severity level 10, which will tell you when an important configuration change was made along with the ID of the session.
Messages with levels below 10 (currently they are all set to severity 0) are classed as purely informational messages. They are sent to the user whose session made a change, but they aren’t logged as errors. However, changes to database and server configuration settings trigger a Level 10 informational message, sometimes returned to applications as error-level 0, and some of these are logged as errors. This only happens with less than a quarter of these level 10 messages. Curiously, no messages of 11, 12, or 13 are logged as errors and only one of the severity level 14 and 15. Even some severe errors aren’t logged. Basically, your error logs aren’t telling you about everything that is going on, whereas Extended events will, if you want.
So, whenever a user executes sp_configure, to change a server configuration setting, a level 10 message is sent, with error number 15457. Similarly, a message with error number 5084 is triggered every time a user issues ALTER DATABASE…SET…, to change a database configuration setting.
Since these messages do appear in the error log, we can use SQL Server’s alerts. They are also easy to pick up in an Extended Events event session, by capturing the sqlserver.error_reported event. It comes as a relief to find that we only need to filter on two error numbers because Information messages, in general, are emitted from a working system at an alarming rate.
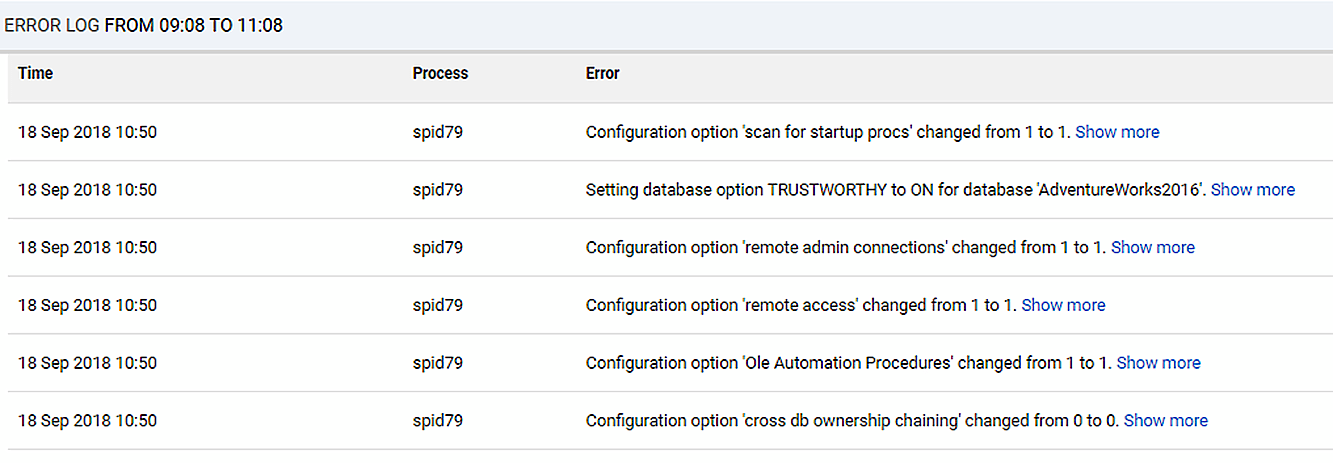
Using Extended Events to capture the two errors of interest is quicker than using the error log and gives you more information. It also allows you to add them to your security panel in Redgate Monitor, as a custom metric. If you are quick, you’ll also see them in Redgate Monitor’s display of the error log.

Setting up the extended events event session
To get this running, you need to create an Extended Events session. In this case, we can reuse the code from our last custom monitor, which I described when looking for SQL Injection-related errors, in the article ‘How to Detect SQL Injection Attacks using Extended Events and Redgate Monitor‘. The same principle can be used here.
We’ll collect all events that deal with server and database configuration changes, but no others.
|
1 2 3 4 5 6 7 8 9 10 11 12 13 14 15 16 17 18 19 20 21 22 23 24 25 26 27 28 29 |
IF EXISTS --if the session already exists, then delete it. We are assuming you've changed something ( SELECT * FROM sys.server_event_sessions WHERE server_event_sessions.name = 'ConfigurationItemsChanged' ) DROP EVENT SESSION ConfigurationItemsChanged ON SERVER; GO CREATE EVENT SESSION ConfigurationItemsChanged -- the name of the session ON SERVER ADD EVENT sqlserver.error_reported --just the one event (ACTION ( sqlserver.client_app_name, sqlserver.client_connection_id, sqlserver.database_name, sqlserver.nt_username, sqlserver.sql_text, sqlserver.username --all these are useful for tracking an error ) WHERE (([error_number]=(15457)) OR ([error_number]=(5084))) ) ADD TARGET package0.ring_buffer --we will rwrite it to a ring buffer targwet only (SET max_memory = (4096)) WITH ( MAX_MEMORY = 4096KB, EVENT_RETENTION_MODE = ALLOW_SINGLE_EVENT_LOSS, MAX_DISPATCH_LATENCY = 30 SECONDS, MAX_EVENT_SIZE = 0KB, MEMORY_PARTITION_MODE = NONE, TRACK_CAUSALITY = OFF, STARTUP_STATE = on ); GO ALTER EVENT SESSION ConfigurationItemsChanged ON SERVER STATE = START; GO |
Listing 1
Once you have this in place, a ring buffer will store a list of configuration changes made since the session has started. We can then access the contents of the ring buffer for reporting, and the custom metric is a single SQL Query.
Detecting the config changes in Redgate Monitor
For Redgate Monitor, we only need to return an integer number that tells us how many configuration changes have happened in the past five minutes. Listing 2 shows the query to get that number from the ring buffer target of our ConfigurationItemsChanged event session.
|
1 2 3 4 5 6 7 8 9 10 11 12 13 14 15 16 17 18 |
SELECT Count(*) AS ErrorCount FROM sys.dm_xe_session_targets AS xet INNER JOIN sys.dm_xe_sessions AS xes ON xes.address = xet.event_session_address CROSS APPLY (SELECT Cast(xet.target_data AS XML)) AS target_data_xml(xml) CROSS APPLY target_data_xml.xml.nodes('//RingBufferTarget/event') AS xed(event_data) WHERE xes.name = 'ConfigurationItemsChanged' AND xet.target_name = 'ring_buffer' AND DateDiff (MINUTE, Convert(DATETIME2, SwitchOffset( Convert(DATETIMEOFFSET, xed.event_data.value('(@timestamp)[1]', 'datetime2')), DateName(TzOffset, SysDateTimeOffset()) ) ), GetDate()) < 5; |
Listing 2
Create this as a custom metric, in Redgate Monitor, as described in my previous article (referenced above), configure it to collect data on master, and set it running to watch for changes! When errors are detected, the user can drill into the detail by looking in the error log or by using SQL to get more detailed information out of the ring buffer (I’ll show this query shortly).
Making some configuration changes
To check that all is well, we can twiddle some knobs and switches to change configuration settings (but only on a development server please!)
|
1 2 3 4 5 6 7 8 9 10 11 12 13 14 |
/* this code turns ON some of the configuration items with security issues */ EXEC sp_configure 'show advanced options',1 reconfigure GO EXEC sp_configure 'CLR Enabled',1 EXEC sp_configure 'Ad Hoc Distributed Queries',1 EXEC sp_configure 'Cross DB Ownership Chaining',1 EXEC sp_configure 'Database Mail XPs',1 EXEC sp_configure 'Ole Automation Procedures',1 EXEC sp_configure 'Remote ACCESS',1 EXEC sp_configure 'Remote Admin Connections',1 EXEC sp_configure 'Scan for Startup Procs',1 RECONFIGURE -- To update the currently configured value for advanced options. GO |
Listing 3
And this code turns them all off:
|
1 2 3 4 5 6 7 8 9 10 11 12 13 14 15 |
/* this code turns OFF some of the configuration items with security issues */ EXEC sp_configure 'show advanced options',1 reconfigure GO EXEC sp_configure 'Ad Hoc Distributed Queries',0 EXEC sp_configure 'CLR ENABLED',0 EXEC sp_configure 'Cross DB Ownership Chaining',0 EXEC sp_configure 'Database Mail XPs',0 EXEC sp_configure 'Ole Automation Procedures',0 EXEC sp_configure 'Remote ACCESS',0 EXEC sp_configure 'Remote Admin Connections',0 EXEC sp_configure 'Scan for Startup Procs',0 EXEC sp_configure 'show advanced options',0 RECONFIGURE-- To update the currently configured value for advanced options. GO |
Listing 4
Viewing the metric and alerts
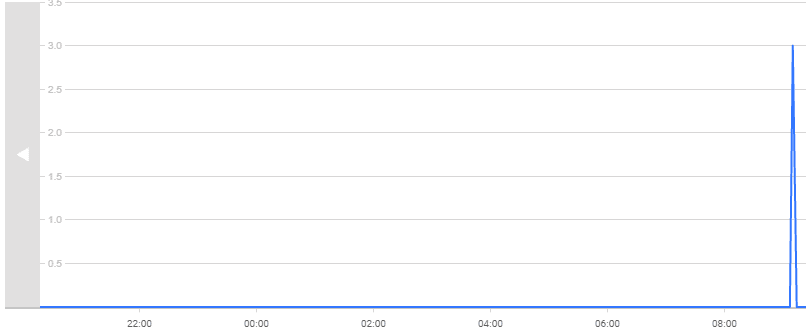
Here’s an analysis graph, plotting values for the configuration changed metric, while I was testing! 
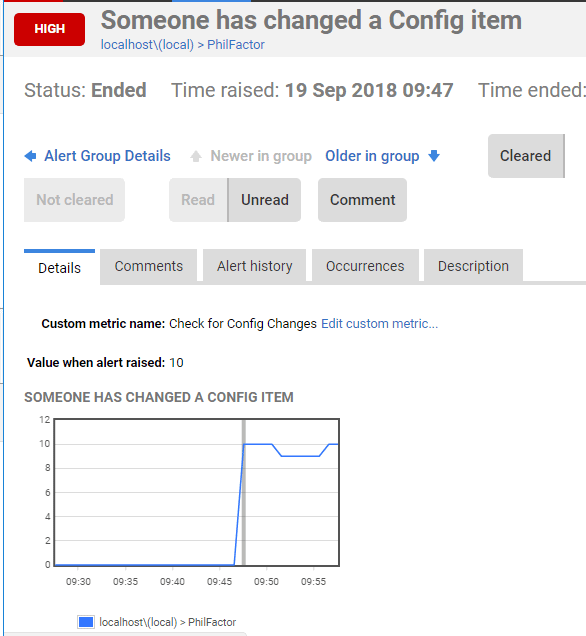
If it spots a change, and you’ve set it to fire an alert, you get this:

So, every time you make a config change, it will appear on the graph and fire an alert.

If you see something like this spike, which is just before the end at 9:45 AM, then you can drill down to see what is happening.
Retrieving the details of the configuration changes
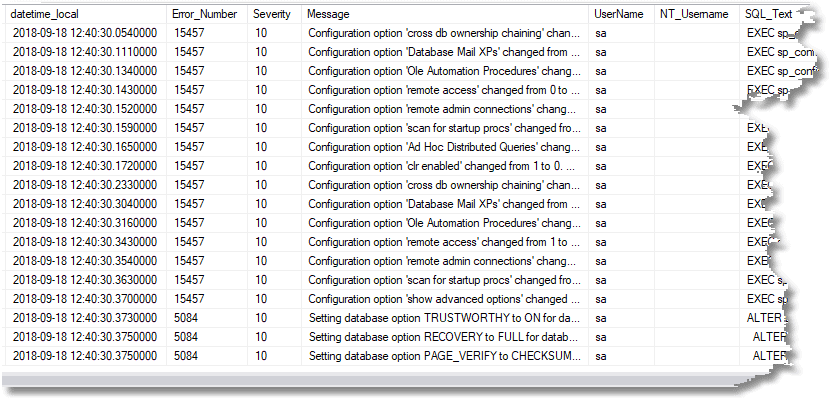
Now we can see what happened and when, using a more detailed query on our collected event data. We get more information than is in the error log because we can specify extra parameters, such as the identity of the client application.
|
1 2 3 4 5 6 7 8 9 10 11 12 13 14 15 16 17 18 19 20 21 22 23 24 |
/* now see what we have caught */ DECLARE @Target_Data XML = ( SELECT TOP 1 Cast(xet.target_data AS XML) AS targetdata FROM sys.dm_xe_session_targets AS xet INNER JOIN sys.dm_xe_sessions AS xes ON xes.address = xet.event_session_address WHERE xes.name = 'ConfigurationItemsChanged' AND xet.target_name = 'ring_buffer' ); SELECT CONVERT(datetime2, SwitchOffset(CONVERT(datetimeoffset,xed.event_data.value('(@timestamp)[1]', 'datetime2')), DateName(TzOffset, SYSDATETIMEOFFSET()))) AS datetime_local, xed.event_data.value('(data[@name="error_number"]/value)[1]', 'int') AS [Error_Number], xed.event_data.value('(data[@name="severity"]/value)[1]', 'int') AS Severity, xed.event_data.value('(data[@name="message"]/value)[1]', 'varchar(255)') AS [Message], xed.event_data.value('(action[@name="username"]/value)[1]', 'varchar(255)') AS UserName, xed.event_data.value('(action[@name="nt_username"]/value)[1]', 'varchar(255)') AS NT_Username, xed.event_data.value('(action[@name="sql_text"]/value)[1]', 'nvarchar(max)') AS SQL_Text, xed.event_data.value('(action[@name="database_name"]/value)[1]', 'varchar(255)') AS [Database_Name], xed.event_data.value('(action[@name="client_connection_id"]/value)[1]', 'varchar(255)') AS client_conn, xed.event_data.value('(action[@name="client_app_name"]/value)[1]', 'varchar(255)') AS client_app_name FROM @Target_Data.nodes('//RingBufferTarget/event') AS xed (event_data) |
Listing 5
Which, in this case, gives the following:

Checking for unauthorized ‘drift’ in the configuration settings
We’ve done our monitoring the simple way so far, and it satisfies the basic requirement for alerting us about a change and gives us a baseline for how many changes are going on to the server and database configuration settings. The problem is that we get a false alert when the configuration is changed to what it should be, or if it is changed from 1 to 1 or 0 to 0. Also, if we somehow miss a change, we don’t have a lasting account that the configuration is not what the team agreed it should be.
What we really want to know is “Have the configuration settings deviated in an unauthorized, or uncontrolled, way from what went through the deployment pipeline?”. Beware that some database settings change for entirely benign system reasons so it is just useful to be alerted when they happen, so you can check.
All you need to do is just store a JSON document what the server configuration settings should be and compare them to their current values. You can, of course, add a table with the default/agreed settings but I prefer something less intrusive. I store them in a JSON table in an extended property. It won’t store a lot of data, but there is plenty of space in an extended property for this sort of task. Of course, if you are running an old version of SQL Server, then you’ll have to use a table to store this information or use XML instead of JSON.
Drift in server configuration using a ServerConfig extended property
For the server configuration settings, we’ll add an extended property, called ServerConfig, which registers what the server properties should be. This code takes the current settings from the configuration system table (sys.configurations).
|
1 2 3 4 5 6 7 8 9 10 11 12 13 14 15 16 17 18 19 20 21 22 23 24 25 |
USE master IF NOT EXISTS --if the record of the settings doesn't exist .... (SELECT * FROM ::fn_listextendedproperty (N'ServerConfig', DEFAULT, DEFAULT, DEFAULT, DEFAULT, DEFAULT, DEFAULT) ) BEGIN --if no record -- all we can do is insert initial configuration data -- so we create a JSON document that includes the date and time of insertion. DECLARE @ThisConfig SQL_VARIANT = (SELECT Convert(VARCHAR(7500), (SELECT Json_Query(g.r)AS r FROM (SELECT Convert(VARCHAR(7500),(SELECT f.date, f.configuration FROM (VALUES (GetDate(), -- put the current date and time in there --and the current configuration settings as a json array (SELECT cfg.configuration_id AS id, cfg.value AS v FROM sys.configurations cfg FOR JSON AUTO)--and the array ) )f(date,configuration) FOR JSON AUTO, WITHOUT_ARRAY_WRAPPER)) )g(r) FOR JSON AUTO )) )--now write it into the extended property EXEC sp_addextendedproperty @name = N'ServerConfig',@value = @ThisConfig END |
Listing 6
Then, at any time, you can check to see the extent of deviation from the signed-off configuration.
|
1 2 3 4 5 6 7 8 9 10 11 12 13 14 15 16 |
USE master SELECT id, Convert(BIGINT,old.value) AS CorrectValue, Convert(BIGINT,live.value) AS CurrentValue, live.name, live.description+ CASE WHEN is_advanced=1 THEN ' (advanced)' ELSE '' end AS description FROM OpenJson((SELECT TOP 1 Convert(VARCHAR(MAX),value) FROM ::fn_listextendedproperty ('ServerConfig', DEFAult, DEFAULT, DEFAULT, DEFAULT, DEFAULT, DEFAULT))) AS f --base array OUTER APPLY OpenJson(f.Value)r --value of the R variable OUTER APPLY OpenJson(r.Value)s --separate objects within r variable OUTER APPLY OpenJson(s.Value ) WITH (id INT '$.id',value INT '$.v') old INNER JOIN sys.configurations live ON old.id=live.configuration_id WHERE old.value<>live.value AND s.[Key]='configuration' -- there is also the date object. AND f.[Key] =0 |
Listing 7
To test it out, run Listing 6 to create ServerConfig, then Listing 3 to change some settings, then Listing 7, then finally Listing 4 to return all the settings to what they were.

Drift in a database’s configuration using a DBConfig extended property
Database configuration settings are stored at the database level, and again we grab the registered values from sys.databases, and pop them into JSON table in an extended property, DBConfig, in the same way as server settings. We will need to do it for separately for every database on which we want to check on for changes to configuration.
|
1 2 3 4 5 6 7 8 9 10 11 12 13 |
USE PhilFactor IF NOT EXISTS --if the record of the settings doesn't exist .... (SELECT * FROM ::fn_listextendedproperty (N'DBConfig', DEFAULT, DEFAULT, DEFAULT, DEFAULT, DEFAULT, DEFAULT) ) BEGIN --if no record -- all we can do is insert initial configuration data -- so we create a JSON document that includes the date and time of insertion. DECLARE @ThisConfig VARCHAR(7500) = (SELECT json_query((SELECT * FROM sys.databases WHERE name LIKE Db_Name() FOR JSON AUTO))) --now write it into the extended property EXEC sp_addextendedproperty @name = N'DBConfig',@value = @ThisConfig END |
Listing 8
Let’s now make a dangerous change to the PhilFactor database settings.
|
1 2 3 |
ALTER DATABASE philFactor SET trustworthy on; GO |
Listing 9
Our Redgate Monitor custom metric will immediately detect the problem and we’ll see a blip on the analysis graph for the metric, and an alert. We can then investigate the changes by running this SQL Query.
|
1 2 3 4 5 6 7 8 9 10 11 12 13 14 |
SELECT [then].[key],[then].[value] AS Should_Be,[now].[value]AS [is] FROM OpenJson((SELECT Json_Query(Convert(VARCHAR(max), ( SELECT value FROM::fn_listextendedproperty( N'DBConfig', DEFAULT, DEFAULT, DEFAULT, DEFAULT, DEFAULT, DEFAULT)) )) ))OriginalArray OUTER APPLY OpenJson(OriginalArray.Value)[then] LEFT OUTER JOIN OpenJson ((SELECT * FROM sys.databases WHERE name LIKE Db_Name() FOR JSON AUTO))CurrentArray OUTER APPLY OpenJson(CurrentArray.Value)[now] ON [now].[Key]=[then].[Key] WHERE [then].[value]<>[now].[value] |
Listing 10
And see that we have a drift from what should be there.

Detecting drift in database settings across all databases
Listing 11 shows how to get a single report for all your databases. I would advise a complete check across all databases, because the ‘Trustworthy’ exploit can work, regardless of which database is set to be trustworthy.
Assuming you simply don’t create the DBConfig extended property on any database you don’t want to monitor, then the query won’t report drift for those databases. Neat, eh? This will report before and after configuration changes for all databases on which you’ve installed DBConfig.
Beware that your database compatibility version needs to be 130 or above, whatever version of SQL Server you are running; the code will run but return a syntax error involving OpenJson error for any databases of lower compatibility level.
|
1 2 3 4 5 6 7 8 9 10 11 12 13 14 15 16 17 18 19 20 21 22 23 |
DECLARE @DriftedSettings TABLE ([KEY] sysname, ShouldBe VARCHAR(400), [Is] VARCHAR(400), [Database] sysname); INSERT INTO @DriftedSettings ([KEY], ShouldBe, [Is], [Database]) EXEC sys.sp_MSforeachdb 'USE ? SELECT [then].[key],[then].[value] AS Should_Be,[now].[value]AS [is] , Db_Name() AS [Database] FROM OpenJson((SELECT Json_Query(Convert(VARCHAR(max), ( SELECT value FROM::fn_listextendedproperty( N''DBConfig'', DEFAULT, DEFAULT, DEFAULT, DEFAULT, DEFAULT, DEFAULT)) )) ))OriginalArray OUTER APPLY OpenJson(OriginalArray.Value)[then] LEFT OUTER JOIN OpenJson ((SELECT * FROM sys.databases WHERE name LIKE Db_Name() FOR JSON AUTO))CurrentArray OUTER APPLY OpenJson(CurrentArray.Value)[now] ON [now].[Key]=[then].[Key] WHERE [then].[value]<>[now].[value] '; SELECT drift.[KEY], drift.ShouldBe, drift.[Is], drift.[Database] FROM @DriftedSettings AS drift; |
Listing 11
And here’s the report:

Conclusion
We now have a solution now that gives us an alert when a server or database configuration changes on the server. When you notice activity, you can then see all the alterations, how it happened, when it happened and who did it. You can then check to see whether it has resulted in the server or database configuration drifting from what it should be.
As with my previous article on spotting intrusion, I’m showing you enough code to inspire your own ideas; Please don’t consider it a complete solution; intrusion detection is a moving target and you will be more than one step ahead of the villains.
Tools in this post
Redgate Monitor
Real-time multi-platform performance monitoring, with alerts and diagnostics


