How to Identify and Fix Slow Queries in PostgreSQL
Struggling with slow queries in PostgreSQL? Learn how to spot and fix them fast, using a simple diagnostic process and the free tool pgNow.
When an application slows down, the blame often falls on the database. In most cases, though, the problem isn’t PostgreSQL itself; it’s the queries we ask of it.
PostgreSQL is a powerful engine, but small mistakes in SQL can lead to big performance problems, as can poor indexing, insufficient or outdated statistics, and many other subtle issues. Even well-written queries can suddenly “go bad” as data volumes grow, usage patterns shift, or server conditions change.
In this article, we’ll walk through a fast, focused way to spot and fix slow queries that are running on your PostgreSQL instance right now, illustrating the diagnostic process using Redgate pgNow, a free tool that gives you a clear, live view of what PostgreSQL is running right now. You’ll learn how to:
- Find queries that are slow, overly frequent, or resource-intensive
- Investigate possible causes in the underlying query plan
- Apply simple, effective fixes, such as indexing the right columns
Finding slow queries using pgNow
Fixing poor PostgreSQL query performance can feel like a big task, especially if you’re not a SQL expert and can’t hire expensive consultants to help you. A tool like pgNow can speed up the process of spotting problem queries and understanding why they’re slow, so you can fix them quickly and with confidence.
Investigating the current workload
To improve query performance, the first thing you need to know is what’s running, and what’s slowing things down. pgNow gives you a live view of the sessions currently accessing your server, and the queries they are running.
The Sessions tab in pgNow is worth reviewing if you are dealing with I/O or CPU bottlenecks caused by high usage from one or more sessions, especially if you’re using PostgreSQL 18 or later, where pgNow surfaces detailed per-session I/O stats.
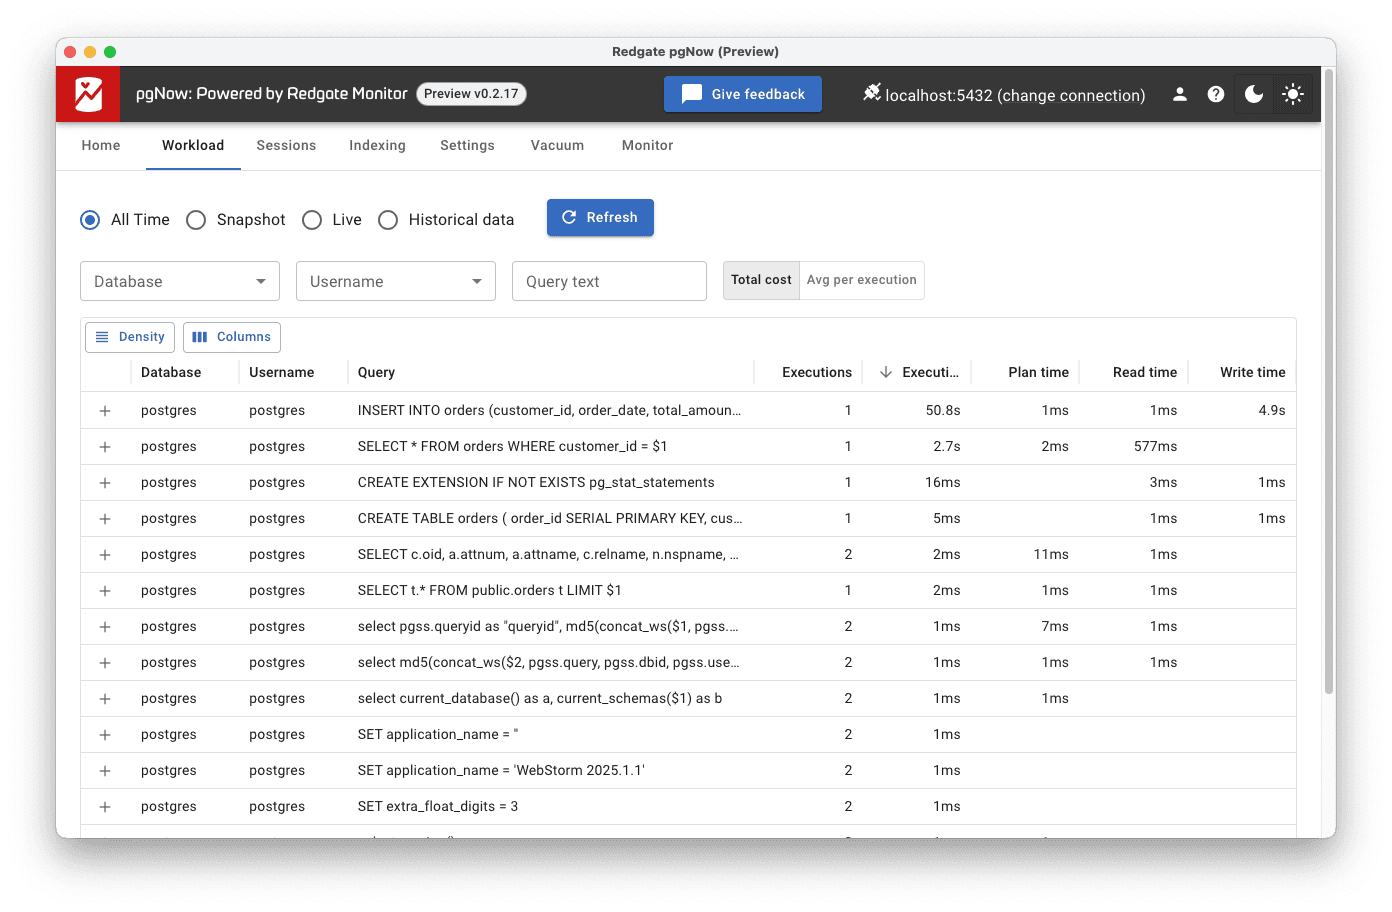
Here, however, we’ll focus on the Workload tab, where you can see the queries that have been executed against your PostgreSQL database, including query text, average execution time, execution count, and read and write times. This helps you quickly identify queries that are running slowly or executing very frequently.
Let’s look at how to use that information to diagnose and fix a slow query.
Diagnosing slow queries
Having identified a slow query, the next step is to diagnose the underlying issue. Let’s walk through a simple example using pgNow. Say I have an orders table, which is heavily used by my application. One common query looks like this:
|
1 |
SELECT * FROM orders WHERE customer_id = 12345; |
At first, this ran just fine but as the table grew, it started taking longer to execute, especially under load. In the Workload tab in pgNow, we now see that this query has a high average execution time.
Expanding the row of this query provides several insights as to the likely source of the problem.
 Query
Query
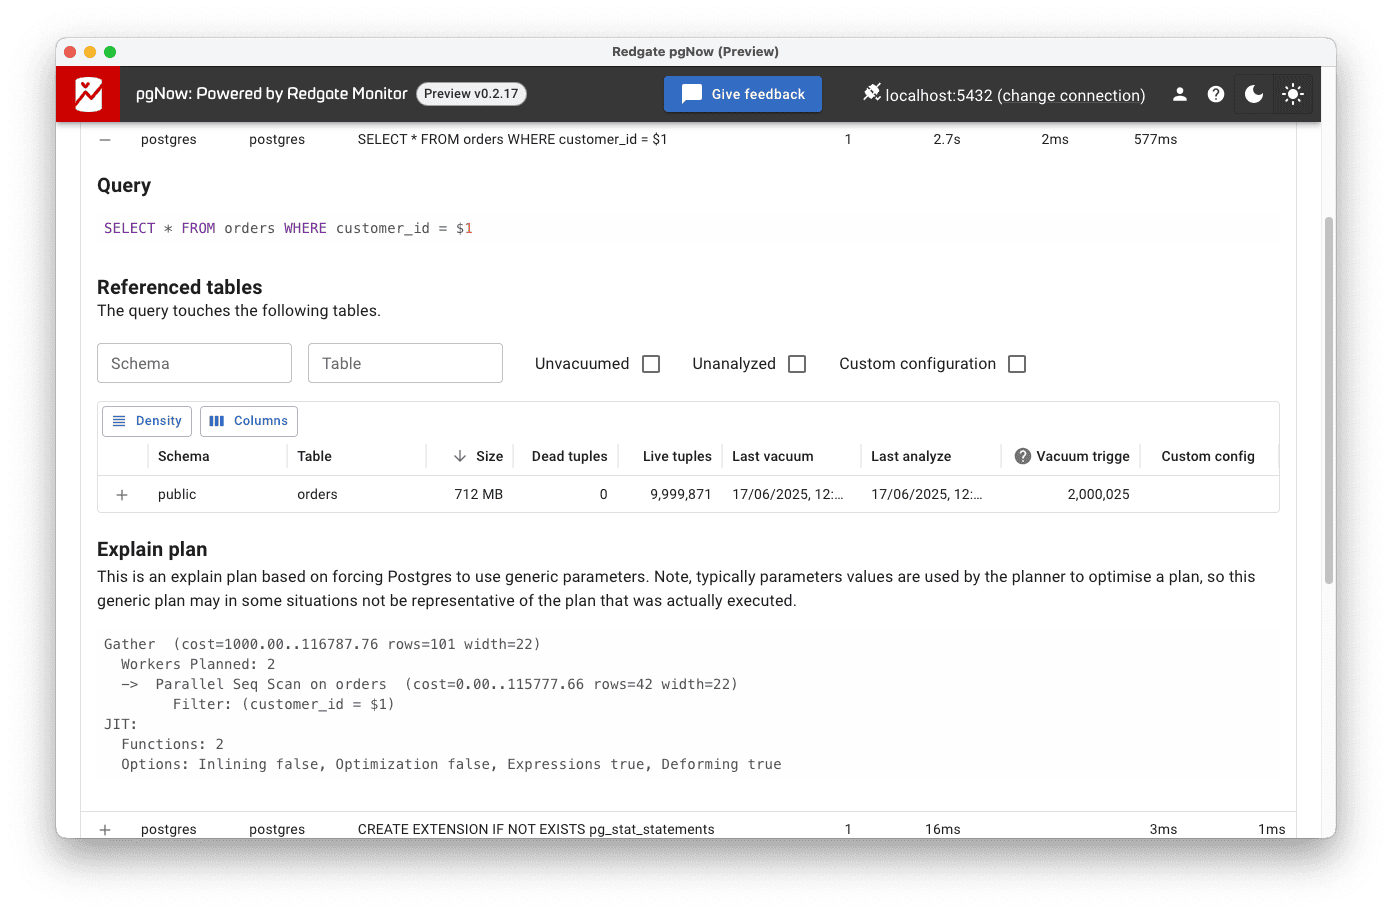
The first useful piece of information is the query text. As you can see, pgNow presents a parameterized version:
|
1 |
SELECT * FROM orders WHERE customer_id = $1 |
This is intentional. pgNow asks PostgreSQL to use generic parameters, rather than specific values, when analyzing queries. This approach allows pgNow to display query plans that are independent of any particular set of parameter values, making it easier to compare plan structure across different executions.
Referenced tables
Next, we want some details about the tables that are accessed by the query. In this simple example, it is just the orders table, which currently holds nearly 10 million rows. A large table like this can make inefficient queries much more painful. If it isn’t accessed efficiently, it can lead to expensive joins or scans.
Explain plan
Finally, we need the query plan. As noted earlier, pgNow presents a generic plan, designed to help you diagnose queries that are consistently expensive across executions, not just in response to one specific parameter value.
By analyzing the plan, you can identify potential performance bottlenecks, such as expensive sequential scans, large hash joins, or costly sorts. In this case, the explain plan confirms our suspicions that PostgreSQL is using an expensive sequential scan, reading every row of the table to retrieve the data:
-> Parallel Seq Scan on orders (cost=0.00..115777.66 rows=42 width=22)
Filter: (customer_id = $1)
The estimated cost range for this sequential scan (0.00..115777.66) is high. Even worse, the query plan shows that the customer_id filter is applied after the scan, meaning all 10 million rows in the table are being read just to return, on average, 42 rows. That’s a clear sign that the query is missing a useful index.
Fixing the slow query
To fix this issue, we need to help PostgreSQL avoid scanning the entire orders table. A simple index on the customer_id column should allow it to find matching rows much more efficiently:
|
1 |
CREATE INDEX idx_orders_customer_id ON orders(customer_id); |
After creating the index, we re-run the query and check pgNow again. This time, the explain plan section reveals a very different picture.
Bitmap Heap Scan on orders
Recheck Cond: (customer_id = $1)
-> Bitmap Index Scan on idx_orders_customer_id
Index Cond: (customer_id = $1)
The query plan now shows a bitmap index scan instead of a sequential scan, with a much lower estimated cost (0.00..5.19). The execution time is also reduced.
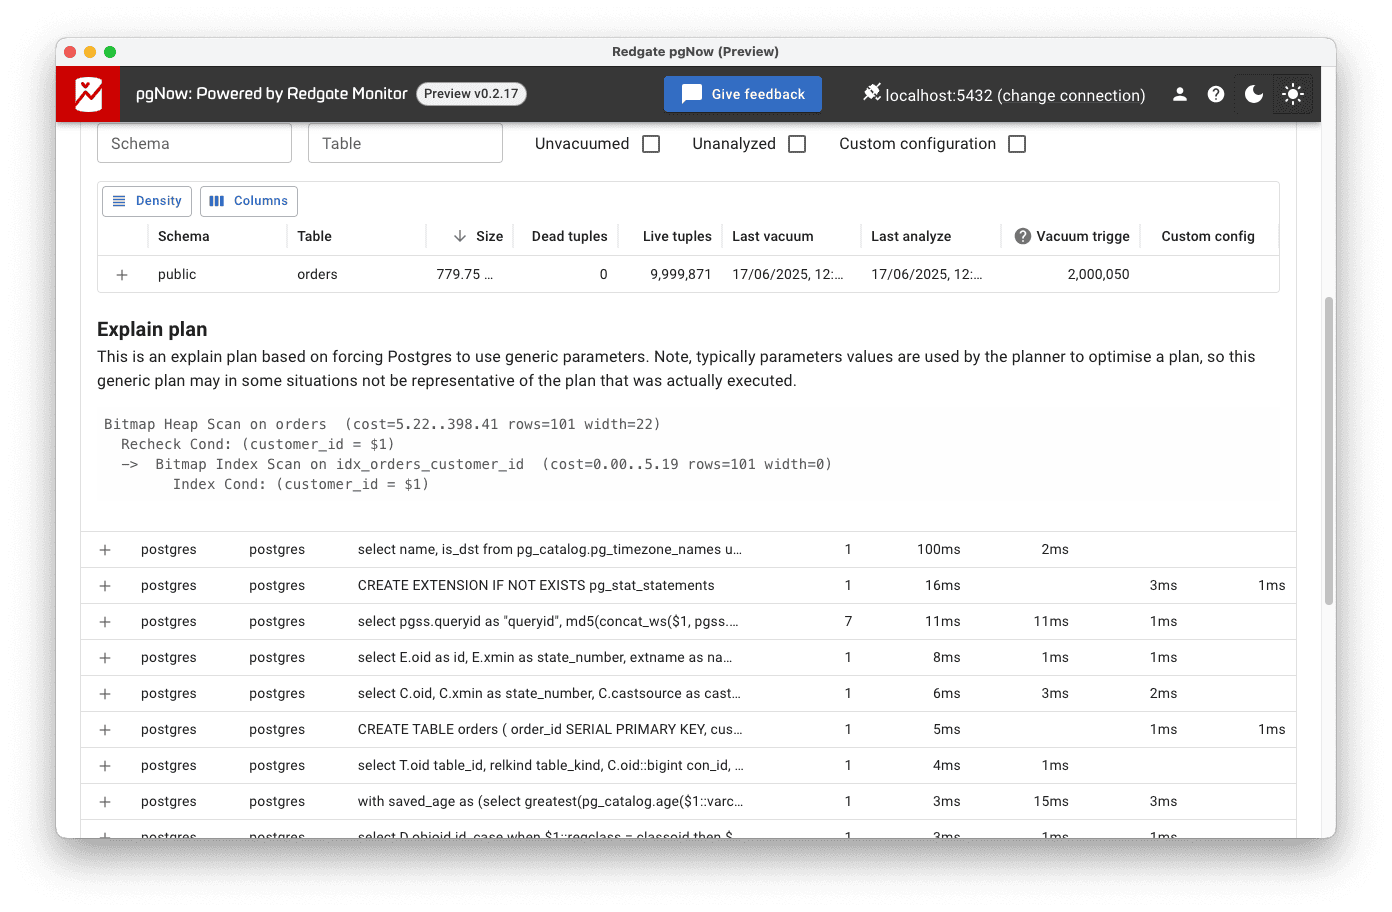
Although this is a generic plan, and actual performance may vary with specific values, it’s clear from the new plan structure that PostgreSQL is now doing much less work to execute this query. For queries that run frequently, especially under load, this kind of change can have a big impact on overall performance.
The next task might be to ask whether all columns are needed. Do we need a SELECT *? The current query plan still includes a Heap Scan, which means PostgreSQL must fetch any columns from the table that aren’t included in our index. If we’re allowed to change the query to return only the necessary columns, we may be able to create a covering index, improving performance by avoiding the heap access altogether.
Conclusion
There’s a lot to consider when fixing slow queries in PostgreSQL, because there are many possible causes. Sometimes, poor indexing forces PostgreSQL to perform full table scans, reading far more data than necessary. Other times, the problem lies in how the query is written: unnecessary subqueries, inefficient joins, or wildcard selections like SELECT *. Other times, it’s… something else entirely.
Fortunately, tools like pgNow make it easier to spot these issues. By showing what’s running right now, and how PostgreSQL is executing it, pgNow helps you start fixing problems without guesswork or outside help.
If you’d like to learn another way of improving your database’s performance, check out this blog post about how to fine-tune the vacuuming process to improve query performance.
Tools in this post
You may also like
-

Article
How Redgate’s Foundry is Shaping the Future of Database Innovation with AI
Learn how Redgate’s Foundry drives AI innovation in database management - from intelligent monitoring and ML-based automation, to smarter SQL optimization.
-
Article
Configuring Amazon Aurora PostgreSQL for Redgate pgNow Activity Monitoring
This article is a QuickStart guide for configuring Amazon Aurora PostgreSQL so you can use Redgate pgNow to view live query activity, health and performance data for your PostgreSQL instances, without writing any SQL scripts.
-
Article
Set up Redgate pgNow Activity Monitoring on Azure Database for PostgreSQL Flexible Server
This article is a QuickStart setup guide for Redgate pgNow activity monitoring on Azure Database for PostgreSQL Flexible Server. Once you’ve completed the setup, you can start using live query activity, health, and performance data to troubleshoot current issues on your PostgreSQL instances, all without writing any SQL scripts.