Slow applications affect end users first, but the impact is soon felt by the whole team, including the DBA, Dev team, network admin and the system admins looking after the hardware.
With so many people involved, each with their own view on the likely cause, it can be hard to pin down where the bottlenecks really are.
Broadly, there are two main causes of performance issues with a SQL Server application:
- Network problems – relating to the speed and capacity of the “pipe” connecting your SQL application client to the database
- Slow processing times – relating to the speed and efficiency with which requests are processed, at end side of the pipe.
In this article, we’re going to look in a bit more detail about how to diagnose these and get to the bottom of performance issues.
Network problems
Network performance issues broadly break down into problems relating to the speed of responses across the network (latency) or to the capacity of the network (bandwidth) i.e. how much data it can transmit in a set time.
Of course, the two are interconnected. If network traffic generated by your app (or other apps on the same network) is overwhelming the available bandwidth, this in turn could increase latency.
Latency
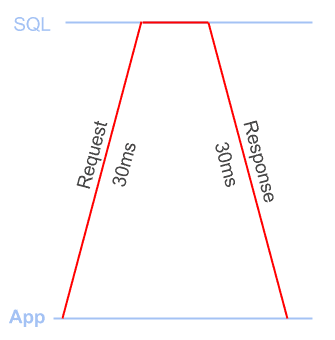
Latency is the time it takes to send a TCP packet between the app and the SQL Server. You incur latency on the way up to the DB and on the way down. People generally talk about latency in terms of round trip times: i.e. the time to get there and back
Figure 1 shows a 60-millisecond round trip.

Figure 1
Bandwidth
The amount of data that can be sent or received in an amount of time, normally measured in kb/s or Mb/s (megabits per second).
People often talk about the ‘size of your pipe’ when discussing bandwidth and it’s a good analogy (plus it sounds naughty): the fatter your pipe, the more data you can get through it at once.
If your app needs to receive a 10-megabyte response (that’s 80 megabits!) and you have a 20 Mb/s connection, the response will take at least 4 seconds to be received. If you have a 10Mb/s connection it will take at least 8 seconds to be received. If other people on your network are streaming Game of Thrones, that will reduce the available bandwidth for you to use.
Application problems: slow processing times
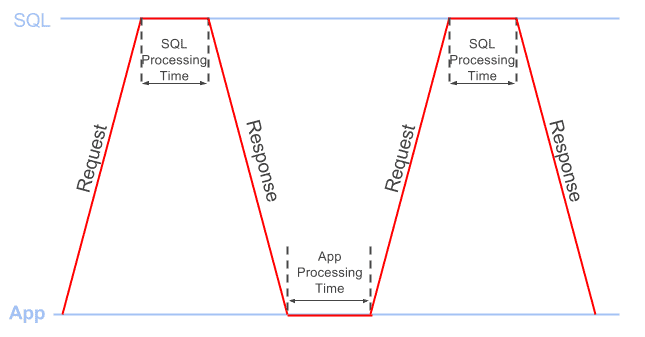
Whenever the client sends a request to SQL Server, to retrieve the required data set, the total processing time required to fulfill a request comprises both:
- App processing time: how long it takes for the app to process the data from the previous response, before sending the next request
- SQL processing time: how long SQL spends processing the request before sending the response
Figure 2 provides a simple illustration of this concept.

Figure 2
Where is the time being spent?
We spend a lot of time investigating the performance of Client/Server SQL applications, and there are an overwhelming number of different tools, scripts and methods to help you troubleshoot any number of different types of performance issue.
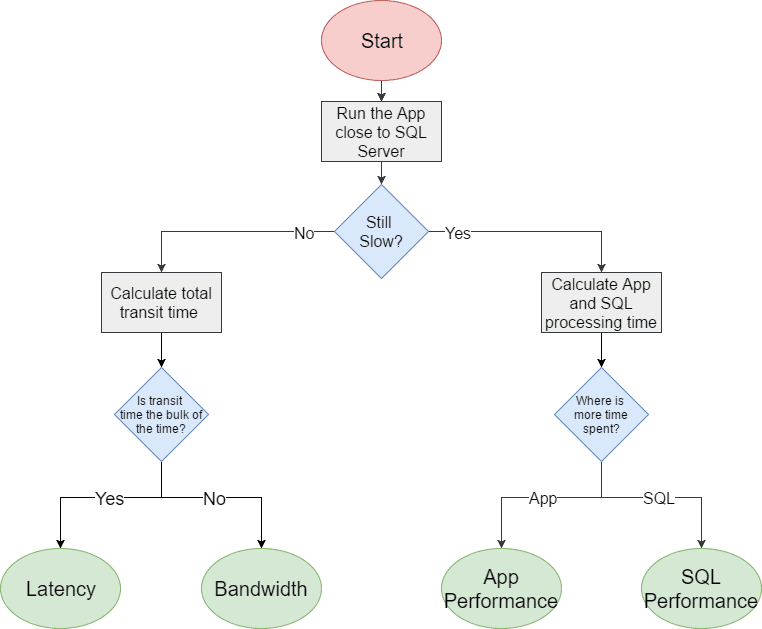
So how, when confronted with slow application response times, do we pinpoint quickly the root cause of the problem? The flowchart in Figure 3 shows a systematic way of approaching the problem.

Figure 3
When investigating performance problems, you may have more than one issue. It’s worth looking at a few different parts of the app. Is it a general problem? Or are some parts much slower than others?
It’s best to start small. It will make life easier if you can focus on a specific area of the app that is particularly slow, for example let’s say when you click the “Select All” button on the invoices page, it takes 10 seconds to load the results. Focusing on a small repeatable workflow will let you isolate the issue.
The next question to answer, of course, is Why is it taking 10 seconds? The first and easiest way to narrow the issue down is to run the app as close to the SQL Server as possible, on the same machine, or on the same LAN.
If having effectively removed any network latency and bandwidth constraints it suddenly takes a second or less to select all the invoices, then you need to investigate what network problems might be eating up all the rest of the time.
If the app is still taking about 10 seconds to load the results, then congratulations, you’ve again eliminated 2 of the 4 issues! Now, you need to look at where the bulk of this processing time is being spent.
Let’s take a closer look at how to work out where the bulk of this time is being spent. You’ll need either Wireshark or SQL Profiler (whichever you’re more comfortable with).
Investigating application processing times
You’ll see the time in one of two places: between sending a response to the app and getting the next request (the app processing time) or between issuing a request to SQL Server and getting a response (the SQL processing time).
To work out which one is causing your issue you can use either Wireshark or SQL Profiler as both can tell us the approximate app and SQL processing time (although the exact numbers may differ slightly).
Using Wireshark
We can use Wireshark to capture the network traffic while the workflow is executing. Using Wireshark allows us to filter out non-application traffic and look at the time difference between all the packets in the workflow.
To calculate the approximate application processing time:
- Capture the packets for the workflow: Start a Wireshark capture and run the app workflow, remember to stop the capture once the workflow is complete. Remember to select the relevant network interface and note that you’ll need to run the app on a different machine from the database for Wireshark to see the traffic. Make sure you’re not running any other local SQL applications other than the one you’re trying to capture.
- Get rid of the non-app traffic by applying the filter tds and then File | Export Specified Packets, giving a filename and making sure “Displayed” is selected. Open this new file in Wireshark.
- Show the time difference between the current and previous packet, simply by adding the time delta column, as follows:
- Select Edit | Preferences | Appearance | Columns
- Click the + button, change the type dropdown to “Delta Time” and the Title to “Delta“
- Filter the traffic to just Requests:
(tds.type == 0x01 || tds.type==0x03 || tds.type == 0x0E) && tds.packet_number == 1
The above filter will show just the first TDS packet in each request, and the Delta column will now show the time between the last response packet of the previous request and the next request. Make sure the packets are ordered by the “No.” column as this will ensure that the packets are in the order they were sent/received.
- Export as a CSV, by navigating File | Export Packet Dissections | As CSV
- Calculate app processing time in seconds – open the CSV in Excel and sum up the values in the Delta column.
To get approximate SQL processing time:
- Reopen the file you created in step 2. above in Wireshark, filter the traffic to just responses:
tds.type == 0x04 && tds.packet_number == 1
The above filter will show just the first TDS packet in each response, and the Delta column will now show the time between the last request packet of the previous request and the first response packet sent back from the SQL Server. Again, ensure the packets are ordered by the “No.” column.
- Export as a CSV, by navigating File | Export Packet Dissections | As CSV
- Calculate SQL processing time in seconds – open the CSV in Excel and sum up the values in the Delta column.
Using SQL Profiler
Although collecting diagnostic data using SQL Profiler is known to add some overhead to your workflow it should still give you a broad picture of the processing times. You can minimize this overhead by running a server-side trace, and then exporting the data as described below. Alternatively, if you’re confident with Extended Events and XQuery, you should be able to get similar data via that route.
Start by capturing a Profiler trace of the workflow, just using the “Standard (default)” trace template. Make sure that nothing else is hitting the database at the same time so you’re only capturing your traffic. Once you’ve captured the workload in the trace, save it to a trace table using File | Save As | Trace Table.
In SQL Management Studio, query the table you created with the following two queries to give you the approximate app and SQL processing times:
|
1 2 3 4 5 6 7 8 9 10 11 12 13 14 15 16 17 18 19 20 21 22 |
/* Calculate approximate SQL Processing time for RPCs and SQL Batch queries*/ SELECT SUM(DATEDIFF(MILLISECOND, StartTime, EndTime)) AS 'SQL Processing Time in ms' FROM TraceTable WHERE EventClass IN ( 10, 12 ); -- Selects the sum of the time difference between the start and end times -- for event classes 10 (RPC:Completed) and 12 (SQL:BatchCompleted) /* Calculate approximate app processing time*/ WITH Events AS (SELECT * FROM TraceTable WHERE EventClass IN ( 10, 11, 12, 13 ) ) SELECT SUM(DATEDIFF(MILLISECOND, PreviousRow.EndTime, CurrentRow.StartTime)) AS 'App Processing Time in ms' FROM Events CurrentRow JOIN Events PreviousRow ON CurrentRow.RowNumber = PreviousRow.RowNumber + 1 WHERE CurrentRow.eventclass IN ( 11, 13 ) AND PreviousRow.eventclass IN ( 10, 12 ); -- Select the sum of the time difference between an end of query event -- (either 10 RPC:Completed or 12 SQL:BatchCompleted) -- and the next query starting event -- (either 11 RPC:Starting or 13 SQL:BatchStarting) |
Investigating latency and bandwidth issues
If the application is fast when run locally, it looks like you have network issues. At this point, you will need to know the latency between the application and SQL Server. You can get a rough idea of this from a ping, which will tell you the time it takes to make a round trip between the two. Try and take the measurement when the network is at low load as high network load can increase ping times.
If you count the number of queries the application issues, you can work out how much time is taken by latency.
To get the number of queries from Wireshark, you can apply the following filter and then look at the “displayed” count in the status bar:
|
1 |
(tds.type == 0x01 || tds.type==0x03 || tds.type == 0x0E) && tds.packet_number == 1 |
To get the number of queries in SQL Profiler, create a trace table as described previously, and run the following query:
|
1 |
SELECT COUNT(1) FROM TraceTable WHERE EventClass in (11,13) |
You need to multiply this query count by the network latency (the ping value). For example, if the application sends 100 queries and your network latency is 60ms then the total transit time is 100 * 60 = 6000ms (6 seconds), whereas on a LAN it would take 100 *1 = 100ms (0.1 second).
This should tell you if latency is your issue. If it’s not, then you have a bandwidth issue.
What a moment though. We haven’t explicitly seen a bandwidth issue, we just ruled out the other issues. How do we confirm it? Great question. It’s a bit fiddlier I’m afraid.
If you have a network-level device with traffic monitoring, and a dedicated connection to the SQL server, you can look and see if your workflow is saturating the available bandwidth.
Alternatively, you need to look at how much bandwidth the application uses when you know you don’t have a bandwidth bottleneck. To do this, you again need to run the application close to the database, capture the packets in Wireshark, and examine the bandwidth used by the application. Again, make sure you’re not running any other local SQL applications other than the one you’re trying to capture.
Once you have completed the capture in Wireshark:
- Use the filter: tds
- Click Statistics | Conversations and tick the box “Limit to display filter“. You should then see your App workflows conversation in the conversations window.
- The bandwidth used is shown as “Bytes A -> B” and “Bytes B -> A“
Repeat the capture while running the application over the high latency network, and look again at the bandwidth used. If there is a large discrepancy between the two, then you are probably bandwidth constrained.
Of course, for an accurate comparison, you need to be running SQL Server and the application on similar hardware, in both tests. If, for example, SQL Server is running on less powerful hardware, it will generate less traffic across the network in a given time.
Root cause analysis
It’s quite possible you have multiple problems! However, after going through the steps outlines above, you should be able to account for all the time being spent to process the workflow. If the 10 seconds processing time turns out to comprise 6 seconds of SQL processing time, 3 seconds of transit time, and 1 second application processing time, then you know how to prioritize your investigations.
If the main problem is slow SQL processing times, then there is a lot of information out there about tuning and tracking down issues. For example, since we already captured a Profiler trace, Gail Shaw’s articles give a good overview of how to find the procedures and batches within the trace that contributed most to performance problems. Also, Jonathan Kehayias’s book is great for a deeper dive into troubleshooting common performance problems in SQL Server.
Conversely, if most of the time is being spent in client-side processing, you may want to consider profiling your application code to locate the issues. There are lots of profiling tools out there depending on your programming language (for example, for .NET languages you can use ANTS from Redgate or dotTrace from JetBrains).
If you’re suffering from network bandwidth issues, then you may need to limit the size of the data you’re requesting. For example, don’t use “SELECT *” when you’re requesting data. Return only the necessary columns, and use WHERE or HAVING filters to return only the necessary rows.
A very common cause of performance problems, in our experience, is running “chatty” applications over high latency networks. A chatty application is one that sends many duplicate and unnecessary queries, making way more network round trips than necessary.
Often, these applications were originally developed on, and deployed to, a high-speed LAN and so the ‘chattiness’ never really caused a problem. What happens though, when the data moves to a different location, such as to the Cloud? Or a customer on a different continent tries to access it? Or you need to build geographically diverse disaster recovery environments? If you consider every query on a 1ms LAN will be 60x slower on a 60ms WAN, you can see how this can kill your performance.
In short, when writing a Client/Server application, you need to avoid frequent execution of the same queries, to minimize the number of necessary round trips to collect the required data. The two most common approaches to this are:
- Rewriting the code – for example, you can aggregate and filter multiple data sets on the server to avoid having to make a query per data set, although it’s not always to change the application
- Using query prefetching and caching – there are WAN optimization tools that will do this, but they are sometimes expensive, and hard to configure to get high performance, without introducing bugs into the application
We’ve done a lot of research into these problems, while developing our Data Accelerator tool, and have adopted an approach that uses machine learning to predict what your application is about to do, and prefetch the required data, so it’s ready just in time for when the application requests it.
In Conclusion
Make sure you work out where your problem is before you spend a lot of time and money on a possible solution. We’ve seen companies spend vast amounts of money and man hours optimizing SQL queries, when their biggest problems have been application performance issues. Conversely, we’ve seen companies putting more and more RAM or CPUs into a SQL server when this will never make up for the extra time the network latency is adding. If you can pinpoint where the workflow processing time is really being spent, you direct you time and efforts in the right way.
Hopefully this has given you some ideas of how to investigate your own app’s performance, or start to track down any issues you might have.
Load comments