
This is Part 2 of a SQL Server performance investigation walkthrough. Part 1 identified the three stored procedures consuming most of the database’s resources (ViewThread, ViewForum, and a third); this article takes those procedures and does the query-by-query analysis, index design, implementation, and measurement.
The four sections of this article are:
(1) Execution plan and query stats – examining the sub-queries inside each worst-offender procedure, identifying scan operators on large tables, key lookup operators indicating non-covering indexes, and hash-match aggregates on unindexed columns.
(2) Identifying indexes – designing non-clustered indexes to cover the problematic queries, including the INCLUDE column selection to avoid key lookups.
(3) Post-implementation performance review – re-capturing trace data after the index changes and comparing to the Part 1 baseline to confirm the improvements are real and meaningful.
(4) Summary – generalizing the approach for use in other performance investigations. The concrete indexes designed in this article are specific to the forum-schema scenario but the reasoning (read plan, find expensive operators, design index to eliminate them, measure) generalizes to any SQL Server index-tuning exercise.
In Part 1 of this 2-part series, I took a fictional problem, in which I was the DBA responsible for maintaining an internet forum. The forum was performing poorly due to a lack of indexing. I showed how to use server-side Profiler tracing to capture the queries and stored procedures that represented a typical Server workload. By aggregating, at the stored procedure level, the execution statistics from the Profiler trace, I was able to identify the three worst-performing stored procedures.
Here, in Part 2, I’m going to take apart these procedures, and identify the queries within them that are having the biggest impact on performance, and why. Having defined the main problems, I’m going to investigate how to make the queries run faster, by implementing appropriate indexes. Finally, I’ll review and report on the performance improvements observed when the changes are deployed to production.
If you’d like to work through the example, you’ll need to download the WebForums database, which you can find a link to at the bottom of the article.
NOTE: You may not, for a number of reasons, see the same performance values, or execution plans, as I have reported in the article. Firstly, my tests were performed on SQL 2008, and you may see different plans on other versions. Secondly, data volume may well affect the plans; my original copy of the database has 180 000 records in the Threads table and 1.2 million in the Posts table, whereas the copy provided with this article has 2500 and 75000, respectively.
The Execution Plan and Query Stats
In Part 1, the aggregated execution statistics identified the following three stored procedures, as the main contributors to the performance problems:
- ViewThread. This procedure is called anytime a user views a forum thread on the website. It returns the title of the thread, all of the posts as well as the details of who made each post
- ViewForum. This procedure is called anytime a user views the list of threads within a forum. It returns a subset of the threads within the forum, based on the PageNo parameter
- AddPost. This procedure is called whenever a new post to an existing thread. The procedure adds the row to the Posts table, update’s the user’s post count and updates the Threads table with the last modified date
The statistics from Part 1 suggest that the performance impact of the first two procedures, ViewThread and ViewForum, is far greater than AddPost, both in terms of query duration and IO load.
Therefore, I’ll focus my tuning efforts on ViewThread and ViewForum. I’ll investigate each one in turn, examining the query statistics and execution plans for the queries contained within. In order to do this, I’m going to load up Management studio, connect to a development system and run the procedure in question, with following three options switched on:
- Statistics IO – this will show me all the tables that the procedure is reading, how many times each table was scanned and how many reads were done.
- Statistics Time – this will show me the exact duration and CPU time of each statement within the procedure
- Execution plan – this will show me how the steps that the storage engine took to execute the query, and the estimated cost of each operation that comprises the plan.
NOTE: It is worth noting that, regardless of whether you view the estimated or actual execution plans, the costs are estimates. See Grant Fritchey’s blog post for further details. For more general information on Execution Plans, see Grant Fritchey’s e-book, my blog series on Execution plans, and the book “Inside SQL Server 2005: Query Tuning and Optimisation” by Kalen Delaney, et al.
I’ll start the investigation with the worst offender, ViewThread, which had the longest duration and the highest IO.
The ViewThread Procedure
The ViewThread stored procedure is called whenever a user views a thread on the front-end web site. The procedure takes the ID of the thread that they’ve selected and their UserID. It updates the viewing stats for this thread, updates the user’s status and then retrieves a list of the posts within the thread, along with the users who are currently viewing the thread. The full code of the procedure is shown in Listing 1:
|
1 2 3 4 5 6 7 8 9 10 11 12 13 14 15 16 17 18 19 20 21 22 23 24 |
CREATE PROCEDURE [dbo].[ViewThread] (@ThreadID INT, @UserID INT) AS UPDATE Threads SET TotalViews = TotalViews + 1 WHERE Threads.ThreadID = @ThreadID UPDATE Users SET CurrentStatus = 'Viewing Thread', ActiveEntity = @ThreadID WHERE UserID = @UserID SELECT * FROM Threads INNER JOIN Posts on Threads.ThreadID = Posts.ThreadID INNER JOIN Users on Posts.Poster = Users.UserID INNER JOIN UserLevel on Users.UserLevel = UserLevel.LevelID WHERE Threads.ThreadID = @ThreadID SELECT UserName, UserID FROMROM Users WHERE CurrentStatus NOT IN ('Viewing Forum', 'Viewing Search') AND ActiveEntity = @ThreadID GO |
Listing 1: The ViewThread stored procedure
I need to find out which of these queries are causing the biggest problems. In order to do this, I need to execute the procedure in a development environment, using a representative set of sample parameter values, in this case for ThreadID and UserID. These parameter values can be obtained from the Profiler trace. You’ll occasionally find that a stored procedure exhibits different performance characteristics, depending on the parameter set that is supplied. In such cases, you’d need to test the stored procedure with each set of parameters that gives rise to distinct performance characteristics. In this case, however, the procedure appears to perform much the same regardless of the parameters supplied. Specifically, there is little difference in the number of reads for different parameter values, so I can pick any entry from the Profiler trace.
Figure 1 shows how I executed the stored procedure in Management Studio. First, I activate query statistics, either by typing the options, as shown, or from the Query Options dialog which is accessed from the Query menu in Management Studio. I then run the procedure within a transaction, issuing a rollback at the end. This is to ensure that I don’t change any data that could cause later tests to have different performance characteristics, or even to fail altogether.
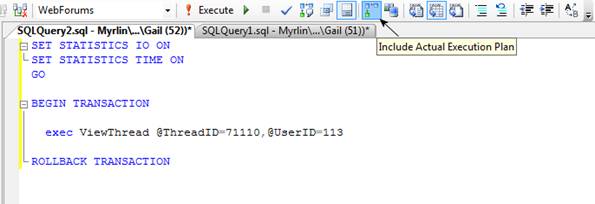
Figure 1: Executing ViewThread
Having generated the detailed execution characteristics for the procedure, I can map each set of characteristics to the individual queries within the procedure.
NOTE:
With only 4 queries, breaking down which of the IO and time statistics belongs to each query is relatively easy. With larger or more complex procedures, especially ones with control flow statements, it may not be as simple. One trick is to modify the stored procedure (in the dev environment) and add print statements before and after each query within the procedure so that it’s very clear which IO and time stats are associated with which query.
Once I’ve done the breakdowns, this is the situation that emerges:
Query 1 (Update Thread’s view count)
|
1 2 3 4 |
UPDATE Threads SET TotalViews = TotalViews + 1 WHERE Threads.ThreadID = @ThreadID IO and Time Statistics: |
|
1 2 3 4 |
Table 'Threads'. Scan count 0, logical reads 3, physical reads 0 SQL Server Execution Times: CPU time = 0 ms, elapsed time = 19 ms. |
Execution Plan
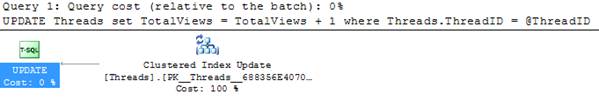
Figure 2: Execution plan for “Update Thread’s view count” query
Query 2 (Update User’s status)
|
1 2 3 |
UPDATE Users SET CurrentStatus = 'Viewing Thread', ActiveEntity = @ThreadID WHERE UserID = @UserID |
|
1 2 3 4 5 6 |
IO and Time Statistics: Table 'Users'. Scan count 0, logical reads 2, physical reads 0 SQL Server Execution Times: CPU time = 0 ms, elapsed time = 12 ms. |
Execution Plan
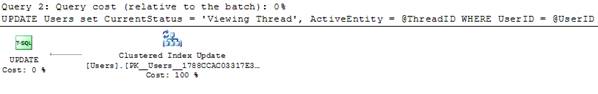
Figure 3: Execution plan for “Update User’s status” query
Query 3 (Retrieve thread details)
|
1 2 3 4 5 6 |
SELECT * FROM Threads INNER JOIN Posts on Threads.ThreadID = Posts.ThreadID INNER JOIN Users on Posts.Poster = Users.UserID INNER JOIN UserLevel on Users.UserLevel = UserLevel.LevelID WHERE Threads.ThreadID = @ThreadID |
|
1 2 3 4 5 6 7 8 |
IO and Time Statistics: Table 'UserLevel'. Scan count 0, logical reads 6, physical reads 0 Table 'Users'. Scan count 0, logical reads 6, physical reads 0 Table 'Posts'. Scan count 1, logical reads 184012, physical reads 0 Table 'Threads'. Scan count 0, logical reads 3, physical reads 0 SQL Server Execution Times: CPU time = 2563 ms, elapsed time = 2615 ms. |
Execution Plan
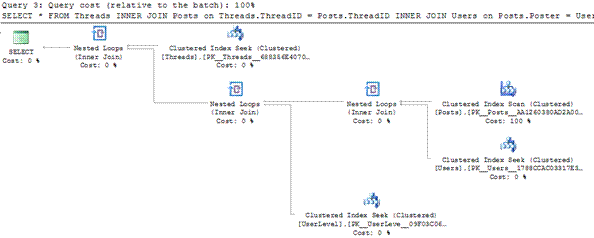
Figure 4: Execution plan for “Retrieve thread details” query
Query 4 (Retrieve Users viewing this thread)
|
1 2 3 4 |
SELECT UserName, UserID FROMOM Users WHERE CurrentStatus NOT IN ('Viewing Forum', 'Viewing Search') AND ActiveEntity = @ThreadID |
|
1 2 3 4 5 |
IO and Time Statistics: Table 'Users'. Scan count 1, logical reads 6, physical reads 0. SQL Server Execution Times: CPU time = 0 ms, elapsed time = 0 ms. |
Execution Plan
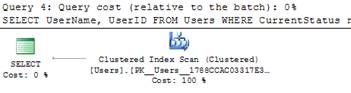
Figure 5: Execution plan for “Retrieve Users viewing this thread” query
It’s readily apparent that the main problem with this stored procedure is that third query (Retrieve thread details). It performs over 18K reads of the Posts table, and has the longest duration and highest CPU time. Furthermore, the estimated costs shown in the execution plan indicates that it contributes 100% of the cost of executing the entire procedure.
The immediate issue I have is that this is a “SELECT *” query, so it is going to be very difficult for me to create good indexes. I pay a visit the developers to find out exactly which columns they’re using from this procedure. It transpires that while they are returning all the columns, they only actually need five of them. I modify the procedure to return only those fields and, when I run it again, the execution characteristics are unchanged, but the smaller number of fields means that I’m more likely to be able to create useful indexes. I can’t see any other changes that I could make to the code to make it more efficient, so I move on to take a closer look at the execution plan for this query.
My first goal is to identify and examine the highest-cost step in the plan. In this case, I don’t have to look far. If I read the execution plan from right to left, the first operator that I see is a clustered index scan of the Posts table. In other words, every row of the clustered index (in this case the primary key) is being read in order to identify the rows that the query needs to return. This operation represents 100% of the cost associated with executing the query, and also explains the very high number of reads of the Posts table that we saw in the IO statistics.
So, I now know what the problem is. Later in the article, I’m going to analyse further to see if an index would be appropriate for this query and, if so, which index. However, first, I want to take a look at statistics and execution plans for the next procedure, ViewForum.
The ViewForum Procedure
The ViewForum procedure is called whenever a user views the list of threads within a forum. The procedure takes as parameters the forum ID of the forum to display, the ID of the user who made the request and the page number. The page number is used to paginate the list of threads and return just 20, as there may be a large number of threads in a forum. The first query in the procedure sets the user’s status and the second returns the details of the thread for the requested page of the selected forum. The code for the procedure is shown in Listing 2:
|
1 2 3 4 5 6 7 8 9 10 11 12 13 14 15 16 17 18 19 20 21 22 23 24 25 26 27 |
ALTER PROCEDURE [dbo].[ViewForum] (@ForumID INT, @PageNo SMALLINT, @UserID INT) AS UPDATE Users SET CurrentStatus = 'Viewing Forum', ActiveEntity = @ForumID WHERE UserID = @UserID SELECT * FROM ( SELECT ForumName, Forums.Descr, Threads.ThreadID, Threads.Title, Threads.CreatedOn, Threads.LastModified, Threads.Locked, Threads.TotalReplies, Threads.TotalViews, Creator.UserName AS ThreadCreator, LastPoster.UserName AS ThreadLastPoster, ROW_NUMBER() OVER (ORDER BY Threads.LastModified DESC) AS ThreadNumber FROM Forums INNER JOIN Threads on Forums.ForumID = Threads.ForumID INNER JOIN Users Creator on Threads.CreatedBy = Creator.UserID INNER JOIN Users LastPoster ON Threads.LastPoster = LastPoster.UserID WHERE Forums.ForumID = @ForumID) sub WHERE ThreadNumber BETWEEN @PageNo*20+1 AND (@PageNo+1)*20 |
Listing 2: The ViewForum Procedure
Once again, I execute the procedure in a development environment, using a representative set of sample parameter values for ForumID, PageNo and UserID, as shown in Figure 6:
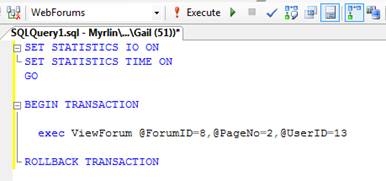
Figure 6: Executing “ViewForum”
Query 1 (UPDATE User’s status)
|
1 2 3 4 |
UPDATE Users SET CurrentStatus = 'Viewing Forum', ActiveEntity = @ForumID WHERE UserID = @UserID |
|
1 2 3 4 5 |
IO and Time Statistics: Table 'Users'. Scan count 0, logical reads 2, physical reads 0. SQL Server Execution Times: CPU time = 0 ms, elapsed time = 32 ms. |
Execution Plan
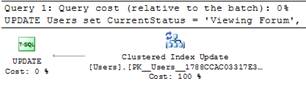
Figure 7: Execution plan for “UPDATE User’s status” query
Query 2 (Retrieve list of threads)
|
1 2 3 4 5 6 7 8 9 |
SELECT * FROM ( SELECT <Lots of fields, omitted for brevity>, ROW_NUMBER() OVER (ORDER BY Threads.LastModified DESC) AS ThreadNumber FROM Forums INNER JOIN Threads on Forums.ForumID = Threads.ForumID INNER JOIN Users Creator on Threads.CreatedBy = Creator.UserID INNER JOIN Users LastPoster ON Threads.LastPoster = LastPoster.UserID WHERERE Forums.ForumID = @ForumID) sub WHERE ThreadNumber BETWEEN @PageNo*20 AND (@PageNo+1)*20-1 |
|
1 2 3 4 5 6 7 8 |
IO and Time Statistics: Table 'Worktable'. Scan count 0, logical reads 0, physical reads 0. Table 'Threads'. Scan count 1, logical reads 3263, physical reads 0. Table 'Users'. Scan count 2, logical reads 12, physical reads 0. Table 'Forums'. Scan count 0, logical reads 2, physical reads 0. SQL Server Execution Times: CPU time = 484 ms, elapsed time = 749 ms. |
Execution plan:
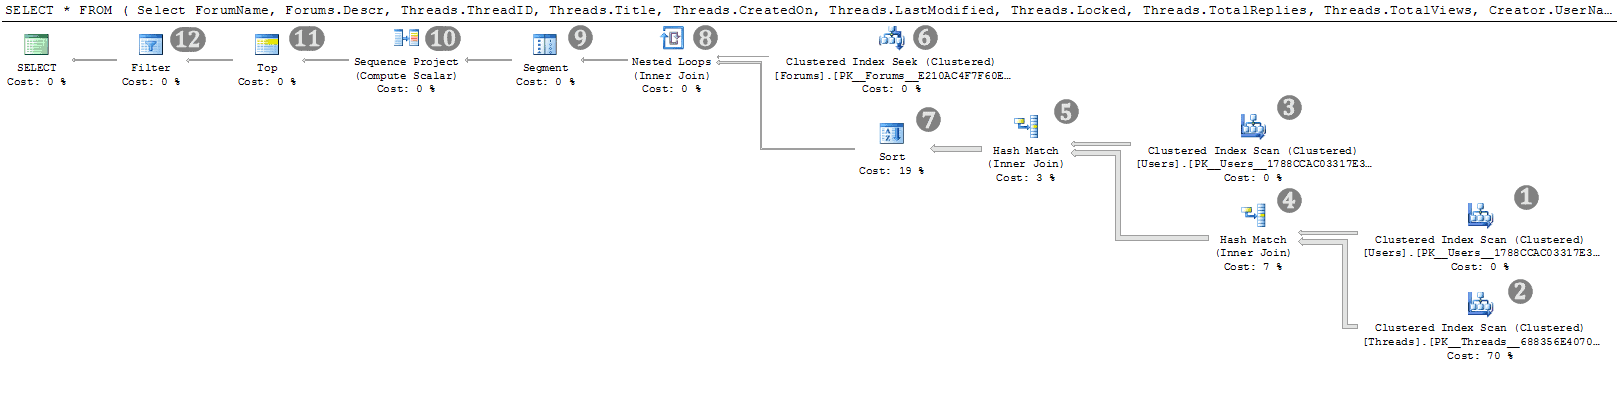
Figure 8: Execution plan for “Retrieve list of threads” query
I can see immediately that the second query in the procedure is cause of the problem, as the optimizer estimates that it contributes 100% of the cost of executing the procedure, and because of its IO impact and duration. The query appears to be well-written and, as such, there are no changes that I need to make to the code before considering how indexes might help optimize the execution plan.
The execution plan for this query is a little more complex than the previous one, so I’m going to go over it in detail. Refer to figure 8 for the annotations:
- A clustered index scan on the Users table. This reads all of the rows in the Users table and outputs the columns UserID and UserName. There is no predicate on this scan, so all the rows in the table are returned
- A clustered index scan on the Threads table. This reads all of the rows in the Threads table and outputs the columns ThreadID, Title, CreatedOn, LastModified, CreatedBy, LastPoster, TotalReplies, TotalViews and Locked. There is a predicate on this seek, on the ForumID column, meaning that the rows that are read by the scan are tested to see if they match and only the ones that do so are returned. The estimated cost of this operator of 70% of that of the entire query, hence this clustered index scan is going to be the focus of my efforts to optimise this query
- Another clustered index scan on the Users table, again returning all the rows in the table and returning the same columns as the scan detailed in step 1 did.
- A hash match join joins the resultsets returned from the scans of the Users (step 1) and Threads (step 2) tables. Hash match joins are quite expensive joins, because of the memory they use to create the hash tables. If possible, I’d like to see this replaced by a less expensive join, but to do that I need to reduce the number of rows that are joined. Hash joins are the most efficient joins for large result sets. If I just added a join hint here to force it to a nested loop, I’d very likely make the query performance far, far worse.
- Another hash match join. This time it’s joining the result of the second scan on the Users table (step 3) with the result of the hash join from step 4. For the same reasons that I listed above, I’d like to see this replaced by a less costly join, if possible
- A clustered index seek on the Forums table. The seek predicate is based on the ForumID column and returns just one row. I’m not going to worry about this. A clustered index seek is quite efficient and, since it only returns 1 row I’m not going to be able to make it any more efficient than it already is.
- A sort on the ModifiedDate column. The sort is there so that SQL can evaluate the row_number function that’s listed within the SELECT clause. (ROW_NUMBER() OVER (Order By ModifiedDate). The estimated cost of this operator is 19% of the entire query. That makes it the second-highest cost operator in the entire query. Hence a secondary objective for me will be to see if there’s any way I can remove the need for this sort.
- A nested loop join. This joins the result of the clustered index seek on the Forums table (step 6) with the output of the sort (step 7). I’m not concerned about this. The estimated operator cost is 0% and a nested loop is an efficient join when one or both of the inputs have a small number of rows, which is the case here.
- The Segment operator is one of the operators that calculates the row_number function.
- The Sequence Project is also involved in the calculation of the row_number function.
- The TOP operator partially implements the filter on the ThreadNumber (the name given to the calculated column based on the row_number function) that’s specified in the outer query (WHERE ThreadNumber BETWEEN @PageNo*20 AND (@PageNo+1)*20-1). The Sort operation, from step 7, left the resultset ordered by the ModifiedDate column, which is the same column that’s used to derive the row_number that’s used in the BETWEEN predicate. This means that this BETWEEN predicate can be partially implemented using the TOP operator. Specifically it can eliminate rows beyond the upper range of the BETWEEN clause.
- The Filter implements the rest of the filter on the derived column ThreadNumber.
So, in summary, my primary goal for this query is to eliminate the clustered index scan on Threads (step 2), and my secondary objectives are to remove the sort (step 7) and to convert the hash joins (steps 4 and 5) to less expensive joins.
Identifying Indexes
At the end of Part 1 of this article series, I had a list of stored procedures that I needed to “fix”. At this stage, I have now drilled down to a much more detailed level, and I now know the actual queries that are causing the issues, along with the specific operations being performed during the execution of these queries that are generating the heaviest workload on the server.
I’m now ready to identify the indexes that could help optimize the query execution plans, and so improve the performance of the queries. To identify potential indexes, I need to re-examine the query execution plans, focussing specifically on the operations within the execution plans that I identified as problematic, namely:
- The clustered index scan on the Posts table – by implementing an index, we will hopefully see this replaced with more-efficient seek operation.
- The clustered index scan on the Threads table – again, I would like to see this replaced with a more efficient seek operation.
Indexing the Posts Table
I’m going to start with the “SELECT Threads” query, from the first procedure, ViewThread. This was originally a “SELECT *” query, but I modified it based on the columns the developers said they really needed, as shown in Listing 3:
|
1 2 3 4 5 6 |
SELECT Title, PostDate, PostContent, UserName, LevelName FROM Threads INNER JOIN Posts on Threads.ThreadID = Posts.ThreadID INNER JOIN Users on Posts.Poster = Users.UserID INNER JOIN UserLevel on Users.UserLevel = UserLevel.LevelID WHERE Threads.ThreadID = @ThreadID |
Listing 3: The modified “Retrieve thread details” query
Figure 9 shows the execution plan for this query, with the ToolTip window displayed for the problematic clustered index scan on the Posts table:
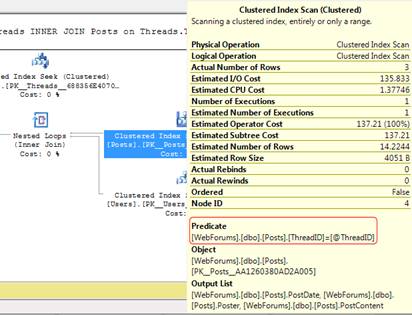
Figure 9: The ToolTips window, displaying properties of the clustered index scan
The predicate that is applied to the rows that the scan returns is on the ThreadID column. Since that’s the only filter that’s listed and the number of rows returned (3) is much lower than the total number of rows in the table (1.2 million), it seems like a very good candidate for a first try at an index.
|
1 2 |
CREATE NONCLUSTERED INDEX idx_Posts_ThreadID ON Posts (ThreadID) |
With the index created, I’m going to run the query again to see the effect that it has had, both on the execution plan and on the IO statistics. Figure 10 shows the new execution plan:
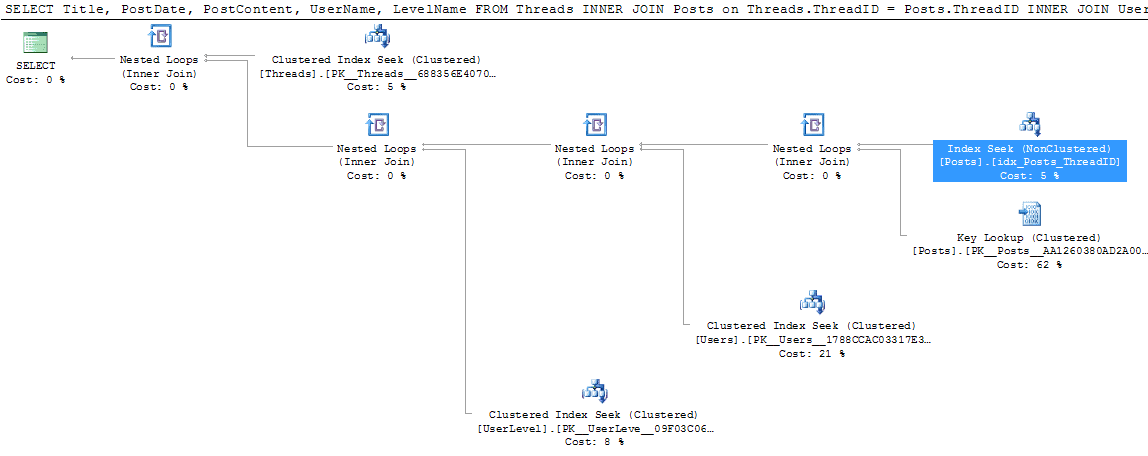
Figure 10: The new execution plan for the “Retrieve thread details” query
The new set of query stats are as follows:
|
1 2 3 4 5 6 7 |
Table 'UserLevel'. Scan count 0, logical reads 6, physical reads 0. Table 'Users'. Scan count 0, logical reads 6, physical reads 0. Table 'Posts'. Scan count 1, logical reads 15, physical reads 0. Table 'Threads'. Scan count 0, logical reads 3, physical reads 0. SQL Server Execution Times: CPU time = 0 ms, elapsed time = 27 ms. |
From 184012 logical reads on the Posts table, and a CPU time of 2563 ms, down to 15 logical reads and 0ms. Not bad.
Looking at the execution plan, I can see that in place of the original clustered index scan, I now have an index seek operation on my newly-created index. The seek operation is coupled with a bookmark lookup to retrieve the data for columns that need to be returned (see the Output List in Figure 9) but are not covered by the index. I could probably improve performance still further by widening the index to make it a covering index. In this case, I’m not going to do that right now, for three reasons:
- 27 ms duration and 15 logical reads is well within the realms of acceptable performance for this query.
- I know that, in most cases, this query will return less than 20 rows, making the index very selective, and so the cost of the bookmark lookups negligible
- One of the columns that the query uses, specifically PostContent, is a VARCHAR(MAX) column. While a VARCHAR(MAX) column can be used as one of the INCLUDE columns of an index, doing so will cause the entire content of the VARCHAR(MAX) column to be stored twice; once in the table and once in the index. Since this is the largest table in the database, that’s going to increase the size of my database significantly.
I’m going to make a note that, should performance problems arise again with this query, the widening of the index can be considered. For now though, I’m going to call this query done and move onto the next one.
Indexing the Threads table
Listing 4 shows the problematic query from the ViewForum stored procedure, which causes the expensive clustered index scan on the Threads table:
|
1 2 3 4 5 6 7 8 9 10 11 12 13 14 15 16 17 18 19 |
SELECT * FROM ( SELECT ForumName, Forums.Descr, Threads.ThreadID, Threads.Title, Threads.CreatedOn, Threads.LastModified, Threads.Locked, Threads.TotalReplies, Threads.TotalViews, Creator.UserName AS ThreadCreator, LastPoster.UserName AS ThreadLastPoster, ROW_NUMBER() OVER (ORDER BY Threads.LastModified DESC) AS ThreadNumber FROM Forums INNER JOIN Threads on Forums.ForumID = Threads.ForumID INNER JOIN Users Creator on Threads.CreatedBy = Creator.UserID INNER JOIN Users LastPoster ON Threads.LastPoster = LastPoster.UserID WHERE Forums.ForumID = @ForumID) sub WHERE ThreadNumber BETWEEN @PageNo*20+1 AND (@PageNo+1)*20 |
Listing 4: The “Retrieve list of threads” query
Again, I’m going to start by taking a look at the properties of this clustered index, shown in Figure 11, in order to identify candidate columns for an index:
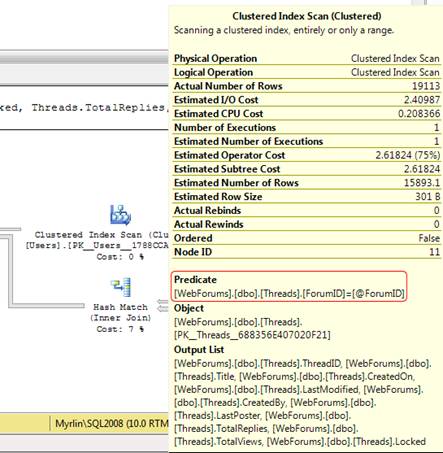
Figure 11: Properties of the clustered index scan operation on the Threads table
As a first step, I’m going to try the same trick as before, and create a non-clustered index on the ForumID column, as shown in Listing 5, since that is the column, listed in the predicate, being applied to the rows that the scan returns:
|
1 2 |
CREATE NONCLUSTERED INDEX idx_Threads_ForumID ON Threads (ForumID) |
Listing 5: A simple, non-clustered index on the Threads table
When I re-run the query, however, I see that the execution plan is unchanged, and the index has not been used, as shown in Figure 12:
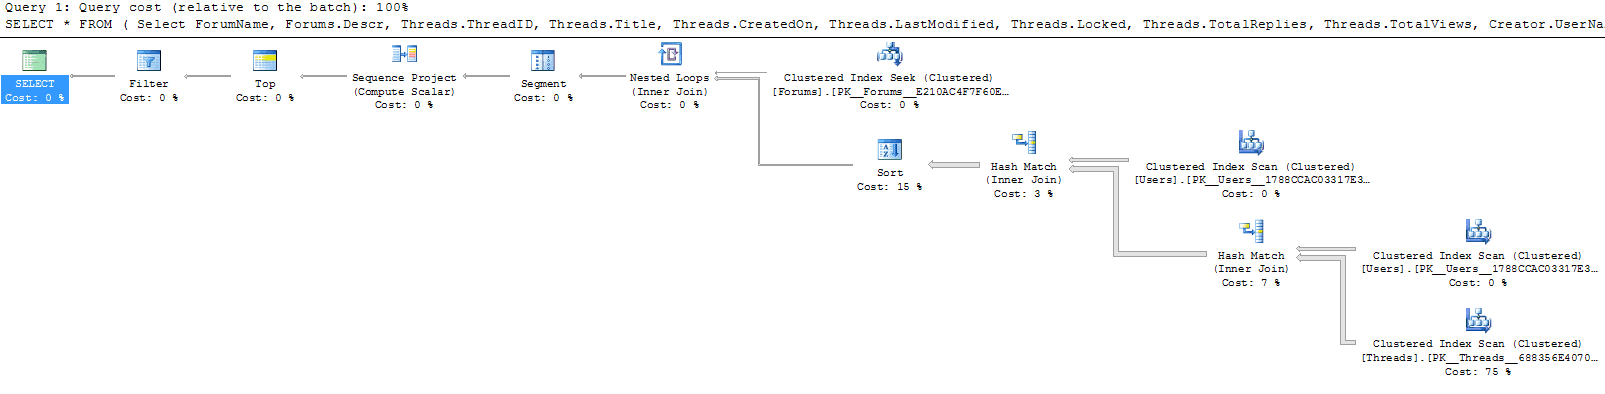
Figure 12: The index on ForumID does not affect the execution plan.
Once again, our index is not a covering index, as if does not contain all the columns used in the query. However, whereas before the query was highly selective and the index got used regardless, in this case the predicate matches 19113 rows out of a total of almost 190000, and so the index is not selective enough to be used. I could simply make the index covering by adding, as INCLUDE columns, all of the columns listed in the Output List of the clustered index scan. That would at least ensure that the index is used, but it may not be the best solution. Given that this query uses all but one of the columns in the Threads table, if I include them all, I’m going to be making the index very large, almost the same size as the table itself. It is an option, if I can’t find any other way to make the query fast. However, I’m going to try a few other tricks first to see if adding any of the columns to the index key will reduce the number of rows processed by the index seek .
The execution plan shows that there’s a join to the Users table on the CreatedBy column, and a join to Users again on the LastPoster column, as shown in figure 13:
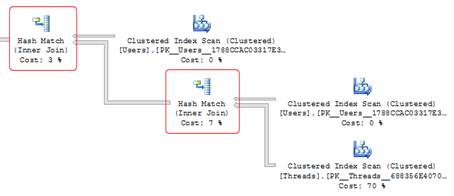
Figure 13: The two joins to the Users table.
Maybe if I add the CreatedBy and LastPoster columns to the index key, it will persuade the optimizer to use it.
|
1 2 3 4 5 |
DROP INDEX idx_Threads_ForumID ON Threads GO CREATE NONCLUSTERED INDEX idx_Threads_ForumIDCreatedByLastPoster ON Threads (ForumID, CreatedBy, LastPoster) |
Listing 6: Adding the CreatedBy and LastPoster columns to the non-clustered index on the Threads table
Unfortunately, when I rerun the query, I see that, once again, the execution plan is unchanged. I’ve still got a clustered index scan on the Threads table. Ok, so that didn’t work; one more attempt before I add all the columns as INCLUDE columns.
There’s another predicate on this query, namely the BETWEEN predicate on the ThreadNumber column (see Listing 4). I can’t add that column to the index, because it’s a computed column and, in fact, it’s a row number ordered by the LastModified column. However, I might be able to get SQL to eliminate some rows earlier than it is doing currently if the LastModified column is part of the index key.
I have a second reason for considering the LastModified column for the index. There’s a sort in the middle of the execution plan that sorts by LastModified (as part of the evaluation of the Row_number), as shown in Figure 14:
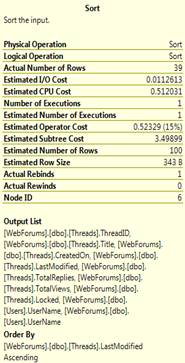
Figure 14: Properties of the Sort operation.
If I add LastModified to the non-clustered index on ForumID and SQL uses that index then, after the filter on ForumID is done, the rows will already be sorted by LastModified and an explicit sort won’t be required.
Let’s see if theory meets reality in this case. Listing 7 recreates the index using ForumID and LastModified as key columns:
|
1 2 3 4 |
DROP INDEX idx_Threads_ForumIDCreatedByLastPoster ON Threads CREATE NONCLUSTERED INDEX idx_Threads_ForumIDLastModified ON Threads (ForumID, LastModified) |
Listing 7: Recreating the index using ForumID and LastModified as key columns
When I rerun the query, I see that the execution plan has changed radically. The clustered index scan is gone, replaced by a non-clustered index seek and a rather expensive-looking key lookup, the sort is gone as it’s no longer necessary and, in addition, the hash joins have been replaced by nested loop joins, as shown in Figure 15:
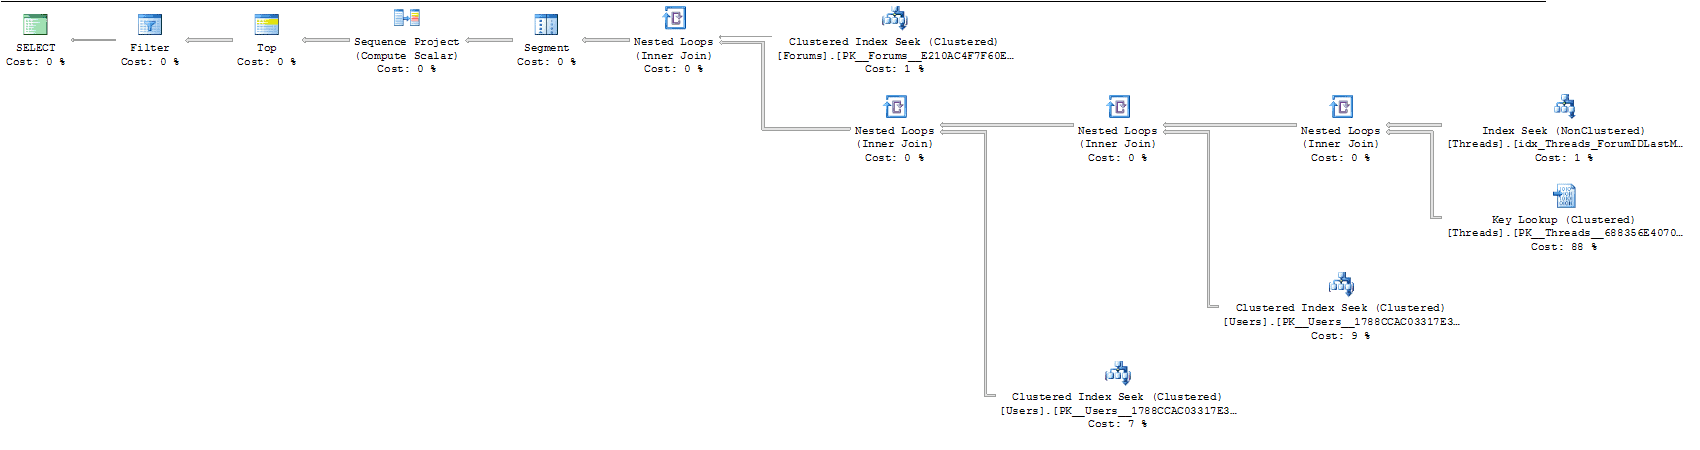
Figure 15: The execution plan now shows an index seek and a key lookup.
The change of the join type is due to the reduced number of rows being processed. Hash joins are efficient for joining very large numbers of rows, which is why they appeared in the previous execution plan. With an efficient index the number of rows returned is lower and hence the number of rows that the joins have to process is much reduced and so the nested loop join can be used instead. The nested loop is only efficient on small numbers of rows and hence the Query Optimiser will never select it when the number of rows being joined is very high.
The new query stats are as follows:
|
1 2 3 4 5 6 |
Table 'Users'. Scan count 0, logical reads 720, physical reads 0. Table 'Threads'. Scan count 1, logical reads 564, physical reads 0. Table 'Forums'. Scan count 0, logical reads 2, physical reads 0. SQL Server Execution Times: CPU time = 0 ms, elapsed time = 1 ms. |
That’s better. I’ve reduced the logical reads on the Threads table from 3263 to 564, although I have also increased the logical reads on the Users table from 12 to 720. However, I have also reduced the CPU and elapsed times to virtually zero.
Since the logical reads are still rather high, and this is the most-frequently run query in the system, in this case I am going to add the rest of the columns used by the query as INCLUDE columns to this index, as shown in Listing 8:
|
1 2 3 4 5 |
DROP INDEX idx_Threads_ForumIDLastModified ON Threads CREATE NONCLUSTERED INDEX idx_Threads_ForumIDLastModified ON Threads (ForumID, LastModified) INCLUDE (Title, CreatedOn, TotalReplies, TotalViews, Locked, CreatedBy, LastPoster) |
Listing 8: Adding the INCLUDE columns to the index
Figure 16 shows the final execution plan for this query:
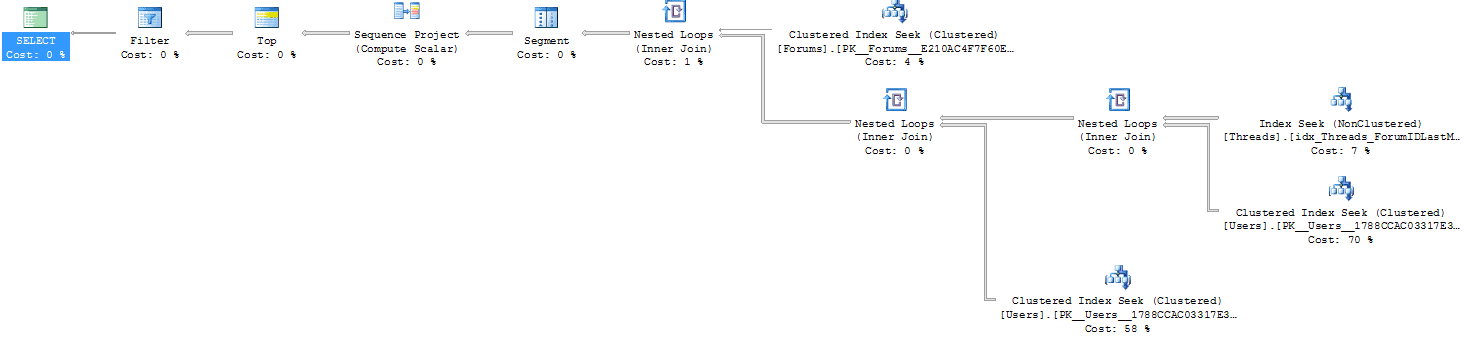
Figure 16: The final execution plan.
And here is the final set of query stats:
|
1 2 3 4 5 6 |
Table 'Users'. Scan count 0, logical reads 720, physical reads 0. Table 'Threads'. Scan count 1, logical reads 8, physical reads 0. Table 'Forums'. Scan count 0, logical reads 2, physical reads 0. SQL Server Execution Times: CPU time = 0 ms, elapsed time = 0 ms. |
That’s much better. I’ve reduced the IOs on the Threads table to 8. The IOs on the Users table are still at 720 but I don’t think that will be a major problem. There’s not much I can do about it, because the two operators that read from the Users table are both clustered index seeks. The high number of reads is because, in both cases, Users is the inner table of a nested loop join and hence the seeks on that table must be executed once for each row returned from the Threads table. I’m going to leave this as it is for now, if there’s a problem in future I’ll probably have to rewrite the query as there’s no more I can do on the indexing side to reduce the reads further.
I’ve optimised everything I set out to optimise and the queries are looking pretty good when run by themselves in dev, so now I need to take them through testing and get them deployed to the production environment.
Post-implementation Performance Review
Once I’ve implemented those index and procedure changes in production, I need to capture a new Profiler trace, to see what kind of effect, if any, they’ve had on the overall server performance.
In order to this, I’m going to rerun the trace that I initially used to find the server’s workload (see Part 1), import it into a database table and re-analyse the data. To ensure that the comparison is meaningful, I’m going to run the trace at the same time I did before, and with the same trace duration.
The new aggregated execution statistics are shown in Figure 17:
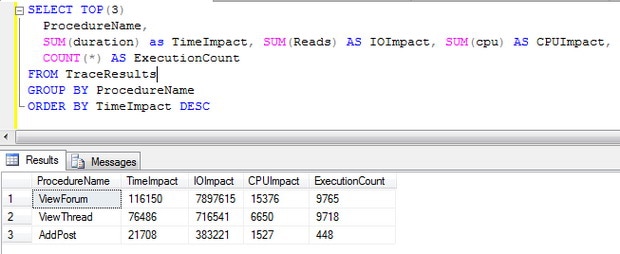
Figure 17: Aggregating execution statistics by stored procedure
Not only has the time impact and IO impact dropped significantly compared to the initial measurements, but also the execution count has more than tripled, indicating that the application has a far greater throughput after the optimisation than it did before. As a bonus, the procedure AddPost, which I decided not to look at, is running significantly faster as well. This is probably due to a decrease in blocking. Since the queries that I optimised read from the Posts table and are now much more efficient, the locks they take will be held for a shorter time. That means that the procedure AddPosts that writes to that table will have to wait less time to obtain a lock and hence will run faster.
The following table summarizes the effect of the indexing neatly:
|
|
Procedure |
Time Impact |
IO Impact |
CPU Impact |
Execution Count |
Avg. Duration (ms) |
Avg. IOs |
Avg. CPU |
|
Before |
ViewThread |
1815846 |
442711386 |
1064111 |
2377 |
763 |
186247 |
447 |
|
ViewForum |
1536715 |
5193415 |
223289 |
2433 |
631 |
2134 |
91 |
|
|
AddPost |
229295 |
206833 |
876 |
244 |
939 |
847 |
3 |
|
|
After |
ViewThread |
116150 |
7897615 |
15376 |
9765 |
11 |
808 |
1 |
|
ViewForum |
76486 |
716541 |
6650 |
9718 |
7 |
73 |
0 |
|
|
AddPost |
21708 |
383221 |
1527 |
448 |
48 |
855 |
3 |
Now that looks like a nice spreadsheet to hand to management come review time!
Summary
Over the course of this 2-part article, I’ve demonstrated how to tackle SQL Server performance problems using the following steps:
- Find the queries that constitute a typical workload, using SQL Profiler
- Aggregate at the stored procedure level the execution characteristics, provided by the trace, in order to find the stored procedures that are having the most impact on the system.
- Use query statistics to pinpoint the queries that are causing the biggest problems, and the query execution plans to find out which operations are the root cause.
- Identify the indexes that can optimize the plans and therefore the overall query execution.
It’s probably apparent at this point that finding good indexes for a query is partially art and partially science, and a lot of trial and error. Identifying good indexes requires knowledge of how indexes work and how SQL uses them, knowledge of the application and the data, and a fair amount of patience. For further information on how SQL uses indexes, see this short blog series, anything index-related on Kimberly Tripp’s blog and the recently released book “SQL Server 2008 Query Performance Tuning Distilled” which devotes an entire chapter to index selection.
The final point to note is that, in these examples, the queries were all quite well written and, as such, did not need extensive modifications. More often, however, performance tuning is a mixture of fixing the code and tuning the indexes. Fixing the code could entail anything from converting cursors into set-based code, to tweaking the WHERE clause so that it’s SARGable, to removing redundant queries. But that’s a topic for another article!
Fast, reliable and consistent SQL Server development…
This document contains proprietary information and is protected by copyright law.
Copyright © 2026 Red Gate Software Limited. All rights reserved
Load comments