

Tut tut! SQL all over the place here, Guv!
One of the hottest debates in DotNet development is the role of Object-Relational Mapping (ORM). In general, an ORM refers to any software program intended to map data between two incompatible systems, the domain-based object model of the data, and the relational database model. When we think about ORM Systems, we tend to think about mapping data between DotNet code and a Database. As part of the data mapping, the ORM tool will create the SQL that is needed to pull data from the database as well as put it back in.
We have several ORMs to choose from, ADO.Net Entity Framework and NHibernate among others. In this article, we will explore the two sides to this debate and how the profiler can help settle the debate by bringing to the light what the ORM tool is doing. The profiler, ANTS Performance Profiler 6 in my case, will also showcase when the ORM tool misbehaves.
It can be very scary staring a performance problem in the face with users complaining and managers making threats and your family members filing a missing person’s report. A good profiler will be like raising the hood of your automobile and seeing exactly what is going on under the cover. Sometimes what you see is surprising
The Debate
Some people believe that using an ORM should be a foregone conclusion. Others believe that it may have a role but are not sure. Still others are convinced that their usage can only lead to chaos. In the interest of full disclosure, I believe that using an ORM should be a given; However, like most of life, there are some things to beware of.
The most important caveat is that you must still know SQL. Just because you don’t have to write tons of SQL by hand doesn’t mean that you can forget all about it entirely. You must understand the SQL that is created for you. You don’t have to write all of the SQL yourself but you do need to understand what is created. Bad things can happen if you forget about the database and the SQL used to get data out of it.
This is where the ANTS Performance Profiler shines. With it we can pull back the covers and easily review the SQL that is generated, whilst at the same time viewing the application code that caused it to be generated. The profiler puts this information in context with the overall performance of the application. We can track what SQL statements are being run in the context of what is happening to memory and processor performance.
Background
Perhaps a bit more background information will help us better understand the debate and controversy surrounding ORM tools. Think about how much SQL you had to write for your last application without an ORM. When you think about not having to write all of that SQL, the appeal becomes obvious.
The problem boils down to the quality of the SQL generated. It does the performance of our applications no good if the generated SQL is of poor quality. Many developers and DBAs are apprehensive about handing over control to the ORM.
The concern is that, once you hand over control, it isn’t obvious as to what you do when something goes wrong. The other concern is the risk you take in forgetting about the database. When you have to hand-write the SQL, you are more likely to keep in mind the impact that your data access logic has on the database. The more the database is pushed to the background, the easier it is to forget about the database and the impact that your code may have on this central pivotal resource.
These fears go back to my original caveat and the importance of a tool like ANTS Performance Profiler to track the SQL generated.
It is not always so easy to see the SQL that is generated because the whole point of such tools is to give the generated SQL a lower profile. ORM tools let us put the focus of our code on the business logic being implemented. The profiler allows us to pull the SQL back in focus when required.
I once finished a project where everything went well. Development was straightforward. QA went smoothly. We deployed without a hitch. A month after we deployed, we noticed slowdowns. When tasked with identifying the bottlenecks, SQL was the last thing on mind since the only SQL we wrote was for reports and they were working fine. Fortunately, the Profiler pointed me to the problem in a direction that I never even considered looking.
Enter NHibernate
For the rest of our discussion, we will assume that you have taken the plunge and decided to use an ORM tool. We will also base our discussion on using NHibernate. The way that we monitor our code and use ANTS will be the same regardless of the ORM tool used, but the actions we take to correct the problems identified in our example will be specific to NHibernate.
We will explore the nuts and bolts of NHibernate in a future article. Here we will focus only on correcting the problems identified. Don’t get too caught up in the syntax for NHibernate.
Simple Sample Application
We need a sample application to provide context for some of the points that we will be making. This application will be very simplistic and perhaps even contrived. I want as few implementation details getting in the way of our discussion as possible.

Nasty! Time to raise the hood.
“Real world” applications are of course much more complicated and the problems that they cause are much more subtle. The example given below is extremely contrived but it makes the problems that can occur easier to find so you know what to look for.
With this in mind, we will be using the very rudimentary beginnings of a simple content management system. It will only have the features needed to support the discussion at hand. Don’t get caught up in any details not mentioned.
In the spirit of keeping things simple, we have a simple 6 table data model:
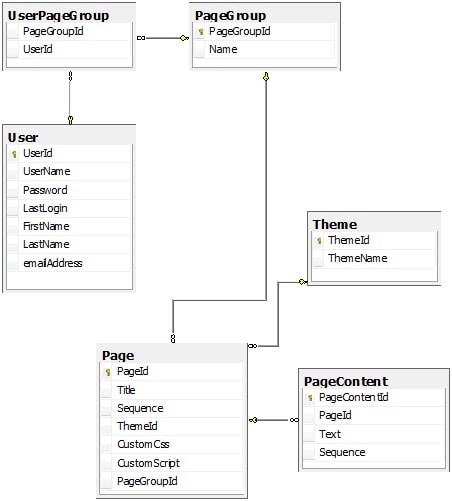
Essentially, we have a PageGroup. Each PageGroup will have 1 or more Pages. Each page will have a Theme and 1 or more PageContent records. We will also have User records which may be able to see multiple PageGroups.
For purposes of our discussion, we want to be able to create a PageGroup, Add Pages to a PageGroup, associate each page with a theme, and Retrieve the details for all of the pages in a PageGroup.
We will have POCO (Plain Old CLR Objects) for each of these tables and allow nHibernate to handle the data mapping to and from these tables. I also use SharpArch Architecture for some base classes and to create the repositories to handle actually getting data.
SharpArch.Data.NHibernate defines a base class to define Repositories from. We can get the basic plumbing for a PageGroup by simply declaring a PageRepository similar to this:
|
1 |
public class PageGroupRepository : NHibernateRepositoryWithTypedId <PageGroupEntity ,int> { } |
With this simple class declaration, we get the following methods:
|
1 2 3 4 5 6 7 8 9 10 11 12 13 14 15 16 17 18 |
public PageGroupEntity Get(int id, Enums.LockMode lockMode) public PageGroupEntity Load(int id) public PageGroupEntity Load(int id, Enums.LockMode lockMode) public IList<PageGroupEntity> FindAll(PageGroupEntity exampleInstance, params string[] propertiesToExclude) public PageGroupEntity FindOne(PageGroupEntity exampleInstance, params string[] propertiesToExclude) public PageGroupEntity Save(PageGroupEntity entity) public PageGroupEntity Update(PageGroupEntity entity) public void Evict(PageGroupEntity entity) public PageGroupEntity Get(int id) public IList<PageGroupEntity> GetAll() public IList<PageGroupEntity> FindAll(IDictionary<string, object> propertyValuePairs) public PageGroupEntity FindOne(IDictionary<string, object> propertyValuePairs) public void Delete(PageGroupEntity entity) public PageGroupEntity SaveOrUpdate(PageGroupEntity entity) |
This class will provide all the support we need for interacting with the database.
We can create a new PageGroup with code similar to this:
|
1 2 3 4 5 6 |
var pageGroup = new PageGroupEntity() { Name = "Default Standard Page Group" }; var pageGrouprepository = new PageGrouprepository(); pageGrouprepository.SaveOrUpdate(pageGroup); |
And we can add pages to this PageGroup like this.
|
1 2 3 4 5 6 7 8 9 10 |
var theme = new ThemeRepository().Get(1); pageGroup.Pages.Add (new PageEntity { Title = "New Page", Sequence = currentSequence, CustomCss = "Sample Custom css", CustomScript = "sample custom script", Theme = theme }); |
Once, we have added the pages that we want to the PageGroup we can save the page group and all of the associated Pages will be saved as well.
|
1 |
pageGrouprepository.SaveOrUpdate(pageGroup); |
Later, we can retrieve this PageGroup and all of the related Pages with a single call to the Repository.
|
1 2 3 4 5 6 7 8 9 10 |
public void ProcessPageGroups(int targetPageGroupId) { var pageGrouprepository = new PageGrouprepository(); var pageProcesspageGrouprepository.Get(1); foreach (var page in pageGroup.Pages ) { ProcessPage(page); System.Diagnostics.Debug.WriteLine(page.Theme.ThemeName); } } |
The code that we have written is clean and elegant. From a pure code perspective, it looks very good and any developer would proud to claim. The intent is simple, and it is very straightforward where to go to add new functionality.
Now let’s see what the profiler can tell us about how it behaves and what it might do to the database.
Running ANTS Performance Profiler
Running the profiler is actually fairly straight forward. There are just a couple of items to keep in mind. In order to record the SQL statements, the database must be run locally and it you must be running SQL Server above the Express editions. This means Developer or Enterprise edition.
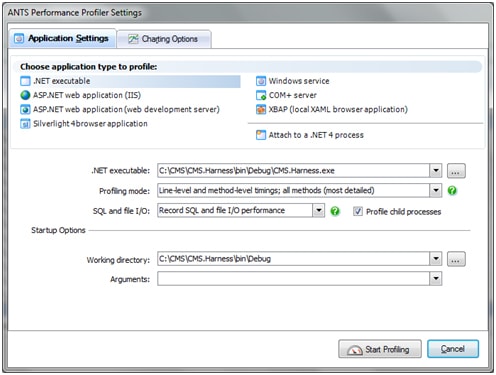
To configure the profiler, follow the settings based on your application type, and make sure that you specify that you wish to record SQL and file I/O.
When we click “Start Profiling” the profiler will start our application and record everything. At any point, we can review the results and see what is going on.
In this case, we profiled the logic that retrieves the pages associated with a given page group. This type of logic will most easily create difficulties for an ORM tool.
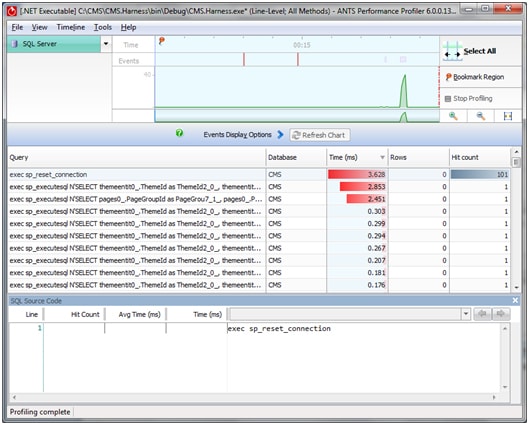
In looking through the code that is run, we would expect this to be a single Select statement, or perhaps two. What we find instead is over 100 select statements. This is what critics of an ORM tool fear the most. Clean simple DotNet code producing SQL code that wreaks havoc on the database.
The problem that has been showcased here is commonly referred to as the N+1 Select problem. The problem is that, for every record in the initial select, we are running an additional select to retrieve data that we need that was not retrieved with the initial select. If we had to write these select statements by hand, we would have seen the problem and designed a different solution. In fact without running a profiling tool like ANTS Performance Profiler, we would not know that such things were going on.
This is clearly not what we want, but what can we do about?
All ORM tools will have the ability to ‘lazy load’ or ‘eager load’ individual properties. ‘Lazy loading’ means not to initialize properties that require pulling data from a different table until that property is referenced. Eager loading means to go ahead and initialize these properties when the object is created and not wait until the property is referenced. Lazy loading is generally the default, and in most cases, lazy loading is what you want. The alternative could result if every foreign key relationship being evaluated at the first select regardless of which relationships were actually being evaluated. Explicitly marking individual properties for being eager loaded gives us more flexibility and finer control.
To specify that we want an individual property to be eager loaded, we will need to create more methods in the Repository class that we were able to ignore earlier. We will need to either override the Get or Load methods, or define our own method specific to what we need to do. Let’s define our own method that will explicitly expand the Theme property. Using the LINQ syntax for defining the query, our new method will look similar to this:
|
1 2 3 4 5 6 7 8 9 10 11 12 13 14 |
public PageGroupEntity GetPageGroup (int pageGroupId) { var results = (from pageGroup in Session.Linq<PageGroupEntity>() .Expand( p=>p.Pages ) .Expand( p=>p.Pages[0].Theme ) where pageGroup.PageGroupId == pageGroupId select pageGroup).ToList() ; if (results.Count == 1 ) { return results.First(); } return new PageGroupEntity(); } |
The key things to note in this method are the two calls to the Expand method from the INhiberateQuery object. Pay attention to the order of the two method calls. You cannot expand a property of the PageEntity until after you have expanded the Page entity first.
We also will need to change the repository method that we will call in the ProcessPageGroups method, but this will be the only change needed to our logic. This is an important point. Even though we may have to create new repository methods, and even though these new methods may look like we are creating SQL statements, we are not creating full SQL statements. What we are doing is tuning the SQL that is generated. More importantly, we can make these tuning changes in the repository class and not have a dramatic impact on the rest of our code.
By rerunning the profiler, we can see the impact of our changes.
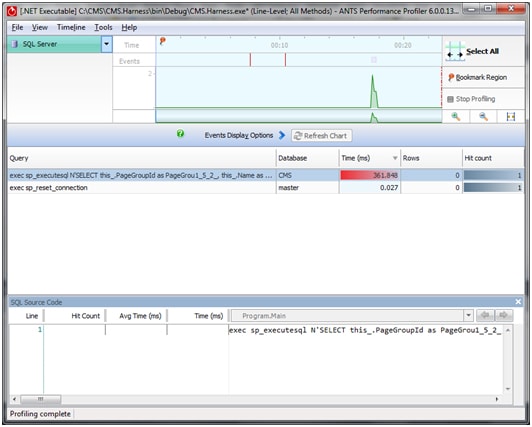
This time, as expected, we get a single select statement. With a little formatting, we can see how this new query makes all the difference:
|
1 2 3 4 5 6 7 8 9 10 11 12 13 14 15 16 17 18 19 |
SELECT this_.pagegroupid AS pagegrou1_5_2_, this_.name AS name5_2_, pages2_.pagegroupid AS pagegrou7_4_, pages2_.pageid AS pageid4_, pages2_.pageid AS pageid3_0_, pages2_.title AS title3_0_, pages2_.SEQUENCE AS sequence3_0_, pages2_.customcss AS customcss3_0_, pages2_.customscript AS customsc5_3_0_, pages2_.themeid AS themeid3_0_, pages2_.pagegroupid AS pagegrou7_3_0_, themeentit3_.themeid AS themeid2_1_, themeentit3_.themename AS themename2_1_ FROM dbo.pagegroup this_ LEFT OUTER JOIN dbo.page pages2_ ON this_.pagegroupid = pages2_.pagegroupid LEFT OUTER JOIN dbo.theme themeentit3_ ON pages2_.themeid = themeentit3_.themeid WHERE this_.pagegroupid = @p0 |
In a “real world” application, the problems will not be so obvious. There will probably be lots of properties to be expanded. You will also have to occasionally balance expanded properties vs. generated SQL that gets to be too large. Imagine joining a dozen tables.
You will probably have to create a lot more custom repository methods, but it will still be dramatically less than if you had to create all of the SQL by hand.
Most importantly, the only changes you will have to make to your business logic will be changing the name of the repository method that you call. This is immensely better than having to rewrite the entire application.
Conclusion

Sorted! The ORM’s smokin’ now.
ORM Tools make a great tool to add to your toolbox. Instead of having to write all of our SQL by hand, you will instead need to learn the details of the ORM tool that you choose. You will still need to keep in mind the SQL that your ORM tool generates, even though you may not have to write it all by hand.
It is important to have a tool like ANTS Performance Profiler to keep a handle on the SQL that is being created for you. Such a profiler makes it easy to identify when your ORM tool is misbehaving and will help you target your efforts to bring you code back in line.
Load comments