
PERCENTILE_CONT is a SQL Server windowing function that computes a continuous percentile value from an ordered set of numbers. Given a percentile P (between 0 and 1), it returns the value at that position in the sorted set – interpolating between two adjacent values if the exact position falls between them.
For example, PERCENTILE_CONT(0.5) returns the median: the middle value of an odd-count set, or the average of the two middle values of an even-count set. PERCENTILE_CONT requires SQL Server 2012 or later and uses the WITHIN GROUP (ORDER BY …) syntax.
This article explains how the interpolation actually works, contrasts PERCENTILE_CONT with PERCENTILE_DISC (which returns one of the actual values rather than interpolating), and presents a pre-2012 equivalent query using classic T-SQL windowing functions for anyone still working on older SQL Server versions.
What is PERCENTILE_CONT in SQL Server?
I have been living and breathing T-SQL windowing functions for years. I couldn’t tell you how many times I have presented on the topic, but I expect it is well over 50. I had also used these functions quite often when I worked in consulting, but now I spend more time teaching others instead of solving real queries with the functions. I love my job as editor of Simple-Talk, but I do sometimes miss those days of writing and tuning queries for customers.
I was recently playing with the analytical group of windowing functions, and I wanted to understand how they worked “under the covers.” I ran into a little logic puzzle with PERCENTILE_CONT by trying to write a query that returned the same results using pre-2012 functionality.
Given a list of ranked values, you can use the PERCENTILE_CONT function to find the value at a specific percentile. For example, if you have the grades of 100 students, you can use PERCENTILE_CONT to locate the score in the middle of the list, the median, or at some other percent such as the grade at 90%. This doesn’t mean that the score was 90%; it means that the position of the score was at the 90th percentile. If there is not a value at the exact location, PERCENTILE_CONT interpolates the answer.
The definition from Microsoft for PERCENTILE_CONT is:
“Calculates a percentile based on a continuous distribution of the column value in SQL Server. The result is interpolated and might not be equal to any of the specific values in the column.”
There is also a function called PERCENTILE_DISC that is similar. Instead of interpolating to find the exact value, it returns one of the actual values in the set.
At first glance, the PERCENTILE_CONT function doesn’t seem so difficult to understand, but I had a hard time writing a query that produced the same results using older functionality. Before I show you the path I travelled to come up with the pre-2012 solution, take a look at how to use PERCENTILE_CONT with an example from AdventureWorks that ranks the count of sales for each month in a given year. I also include PERCENTILE_DISC in this query so that you can see the difference between the two functions.
|
1 2 3 4 5 6 7 8 9 10 |
SELECT MONTH(SOH.OrderDate) AS OrderMonth, COUNT(*) AS OrderCount, PERCENTILE_CONT(0.5) WITHIN GROUP(ORDER BY COUNT(*)) OVER () AS Median, PERCENTILE_DISC(0.5) WITHIN GROUP(ORDER BY COUNT(*)) OVER () AS NotTheMedian FROM Sales.SalesOrderHeader AS SOH WHERE SOH.OrderDate >= '1/1/2012' AND SOH.OrderDate < '1/1/2013' GROUP BY MONTH(SOH.OrderDate); |
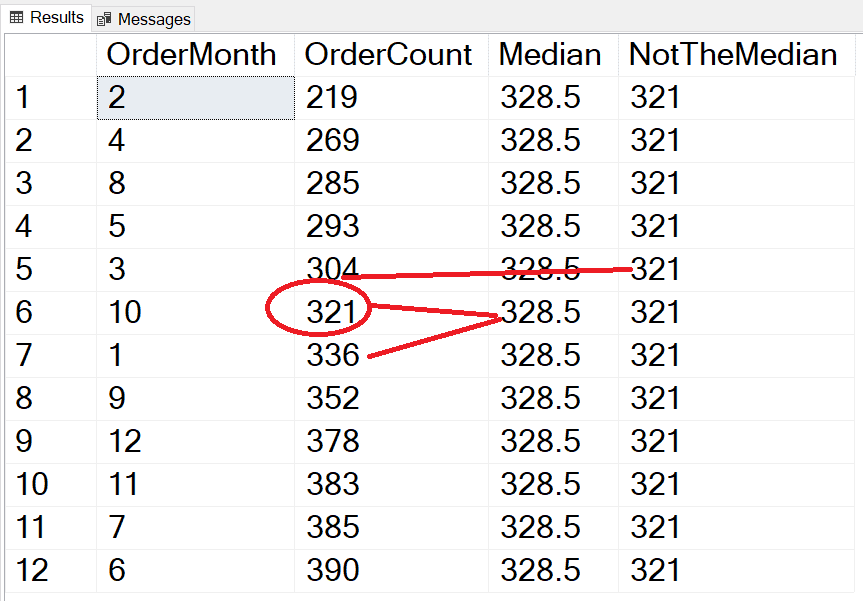
The PERCENTILE_DISC function returns the value 321, which is close to but not the median. The PERCENTILE_CONT function returns the average of the two values around the median, 321 and 336, for an answer of 328.5. If there were an odd number of items in the list, then the two answers would be the same. The results of PERCENTILE_CONT and PERCENTILE_DISC do not depend on the values in the set, just the position. For example, if you tried to find the median of this list (1,2,3,4,1000) the answer is 3. It doesn’t matter that 1000 would skew the results of the mean.
The syntax of PERCENTILE_CONT and PERCENTILE_DISC is different than the other windowing functions because these require the WITHIN GROUP clause. Inside that, you must provide an ORDER BY expression that returns a list of numbers such as scores, heights, sales, etc. You still need an OVER clause, but it supports only the PARTITION BY.
Here’s another example looking for three different percentiles:
|
1 2 3 4 5 6 7 8 9 10 11 12 |
SELECT MONTH(SOH.OrderDate) AS OrderMonth, COUNT(*) AS OrderCount, PERCENTILE_CONT(0.25) WITHIN GROUP(ORDER BY COUNT(*)) OVER () AS [25%], PERCENTILE_CONT(0.5) WITHIN GROUP(ORDER BY COUNT(*)) OVER () AS [50%], PERCENTILE_CONT(0.75) WITHIN GROUP(ORDER BY COUNT(*)) OVER () AS [75%] FROM Sales.SalesOrderHeader AS SOH WHERE SOH.OrderDate >= '1/1/2012' AND SOH.OrderDate < '1/1/2013' GROUP BY MONTH(SOH.OrderDate); |
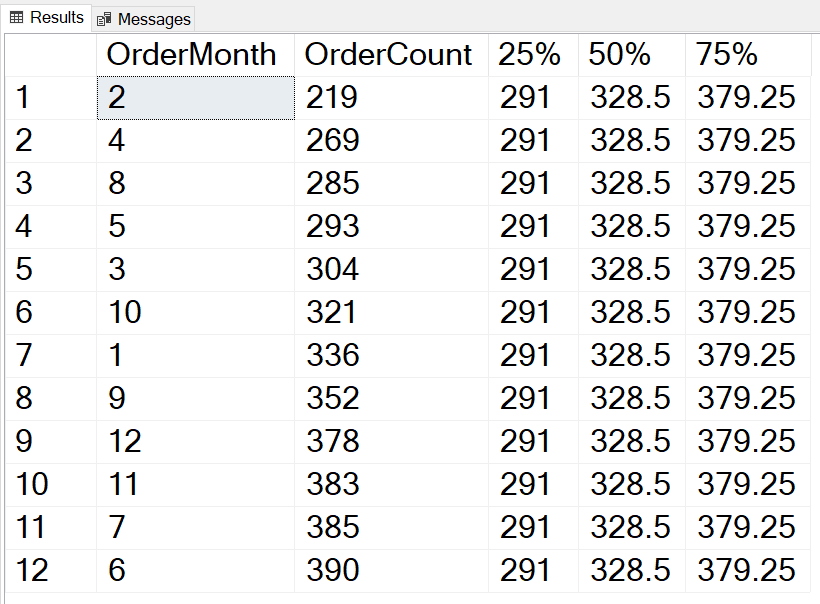
This example returns the PERCENTILE_CONT values at 25%, 50%, and 75% respectively. These will be used as examples for testing the code for the pre-2012 solution.
Fast, reliable and consistent SQL Server development…
A Possible Formula
Of course, I started by searching for an explanation of the function, but I ran into a formula that worked for 50% but fell apart when checking any other percentile. Here’s the description from the article:
- Find the row number at the percentile with this formula:
RN = (1 + (P*(N-1))wherePis the percentile andNis the number of rows. - Use the
CEILINGandFLOORfunctions to find the rows above (CRN) and below (FRN) the row number found in step 1. - If
CRN = RNandFRN = RN, use the value found atRN. - Otherwise, add together the results of the values found at those two rows each multiplied by
P.P * Value at CRN + P * Value at FRN
Here are the calculations for each of the percentiles in this example:
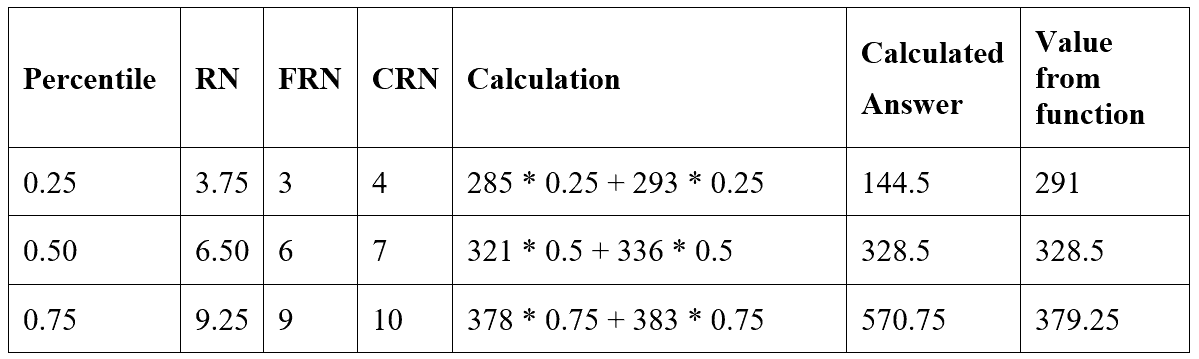
The formula works only with the 50th percentile and not for the others. The calculated values were not even close for 25% and 75%.
Here’s a batch that you can use to verify the results. Change the value of @P to try different percentiles:
|
1 2 3 4 5 6 7 8 9 10 11 12 13 14 15 16 17 18 19 20 21 22 23 24 25 26 27 28 29 30 31 32 33 34 35 36 37 38 39 40 41 42 43 44 45 46 47 48 |
DECLARE @P DECIMAL(2, 2) = 0.5; --Using Percentile_Cont WITH PC AS ( SELECT MONTH(OrderDate) AS OrderMonth, COUNT(*) AS OrderCount, PERCENTILE_CONT(@P) WITHIN GROUP(ORDER BY COUNT(*)) OVER() AS PercentileCont FROM Sales.SalesOrderHeader AS SOH WHERE SOH.OrderDate >= '1/1/2012' AND SOH.OrderDate < '1/1/2013' GROUP BY MONTH(OrderDate)) SELECT DISTINCT PC.PercentileCont FROM PC; --Works for the median WITH GetRowNumbers AS ( SELECT ROW_NUMBER() OVER (ORDER BY COUNT(*)) AS RowNum, MONTH(SOH.OrderDate) AS OrderMonth, COUNT(*) AS OrderCount, (1 + (@P * (COUNT(*) OVER () - 1))) AS RN, CEILING((1 + (@P * (COUNT(*) OVER () - 1)))) AS CRN, FLOOR((1 + (@P * (COUNT(*) OVER () - 1)))) AS FRN FROM Sales.SalesOrderHeader AS SOH WHERE SOH.OrderDate >= '1/1/2012' AND SOH.OrderDate < '1/1/2013' GROUP BY MONTH(SOH.OrderDate)), FindValues AS (SELECT MIN( CASE WHEN GetRowNumbers.RN = GetRowNumbers.CRN AND GetRowNumbers.RN = GetRowNumbers.FRN THEN GetRowNumbers.OrderCount END ) AS ActualValue, SUM( CASE WHEN GetRowNumbers.RowNum = GetRowNumbers.FRN THEN GetRowNumbers.OrderCount END ) AS FloorValue, SUM( CASE WHEN GetRowNumbers.RowNum = GetRowNumbers.CRN THEN GetRowNumbers.OrderCount END ) AS CeilingValue FROM GetRowNumbers) SELECT COALESCE(FindValues.ActualValue, FindValues.FloorValue * @P + FindValues.CeilingValue * @P) AS CalcAnswer FROM FindValues; |
The first CTE, GetRowNumbers, completes step 1, finding the correct row numbers. The second CTE, FindValues, completes step 2, locating the values. The outer query completes steps 3 and 4, checking for an exact value or applying the formula.
Since the formula was not correct, I had to come up with something else.
A Logical Next Step
My first thought was that the difference between the two rows should be multiplied by P and added to the bottom value. This didn’t work either, even though it seemed to make sense. Again, this works for the 50th percentile but falls apart for the others. One good thing about this revised formula is that the answers were always between the floor and ceiling values, but in one case my answer was too low and in the other too high.
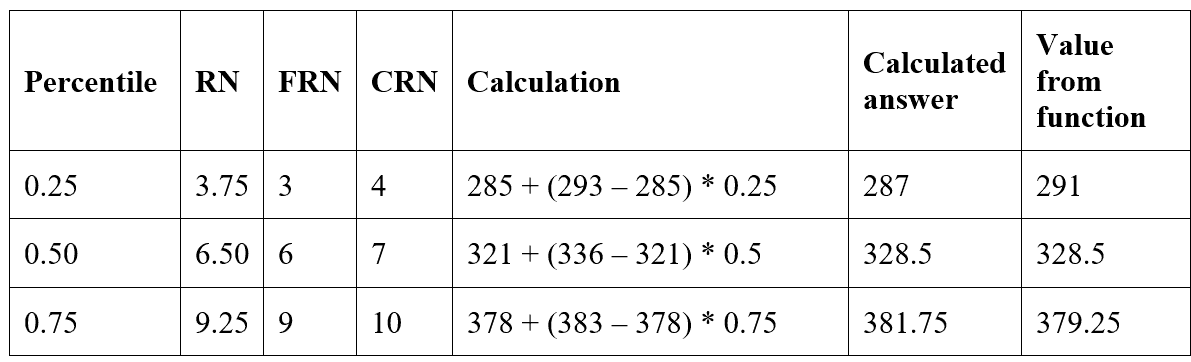
At this point, I was beginning to question the function itself since my idea made sense, well, to me at least.
Here’s a batch to test my hypothesis:
|
1 2 3 4 5 6 7 8 9 10 11 12 13 14 15 16 17 18 19 20 21 22 23 24 25 26 27 28 29 30 31 32 33 34 35 36 37 38 39 40 41 42 43 44 45 46 47 48 49 50 |
DECLARE @P DECIMAL(2, 2) = 0.25; --Using Percentile_Cont WITH PC AS ( SELECT MONTH(OrderDate) AS OrderMonth, COUNT(*) AS OrderCount, PERCENTILE_CONT(@P) WITHIN GROUP(ORDER BY COUNT(*)) OVER() AS PercentileCont FROM Sales.SalesOrderHeader AS SOH WHERE SOH.OrderDate >= '1/1/2012' AND SOH.OrderDate < '1/1/2013' GROUP BY MONTH(OrderDate)) SELECT DISTINCT PC.PercentileCont FROM PC; --My hypothesis WITH GetRowNumbers AS ( SELECT ROW_NUMBER() OVER (ORDER BY COUNT(*)) AS RowNum, MONTH(SOH.OrderDate) AS OrderMonth, COUNT(*) AS OrderCount, (1 + (@P * (COUNT(*) OVER () - 1))) AS RN, CEILING((1 + (@P * (COUNT(*) OVER () - 1)))) AS CRN, FLOOR((1 + (@P * (COUNT(*) OVER () - 1)))) AS FRN FROM Sales.SalesOrderHeader AS SOH WHERE SOH.OrderDate >= '1/1/2012' AND SOH.OrderDate < '1/1/2013' GROUP BY MONTH(SOH.OrderDate)), FindValues AS (SELECT MIN( CASE WHEN GetRowNumbers.RN = GetRowNumbers.CRN AND GetRowNumbers.RN = GetRowNumbers.FRN THEN GetRowNumbers.OrderCount END ) AS ActualValue, SUM( CASE WHEN GetRowNumbers.RowNum = GetRowNumbers.FRN THEN GetRowNumbers.OrderCount END ) AS BottomValue, SUM( CASE WHEN GetRowNumbers.RowNum = GetRowNumbers.CRN THEN GetRowNumbers.OrderCount END ) AS TopValue FROM GetRowNumbers) SELECT COALESCE(FindValues.ActualValue, FindValues.BottomValue + (FindValues.TopValue - FindValues.BottomValue) *@P) AS CalcAnswer FROM FindValues; |
The CTEs are the same as the previous example since steps 1 – 3 work. The difference is in the outer query where the new formula is used.
The Solution
As I do with many problems, I started with a new query window and took it one step at a time. I knew that I was finding the correct rows for the floor and ceiling values at least. My next step was to look at the percentage of the difference between the two values. Was there a pattern?
I used this calculation:
(Answer – Floor value)/(Ceiling value – Floor value)
Here’s a table that shows the results:
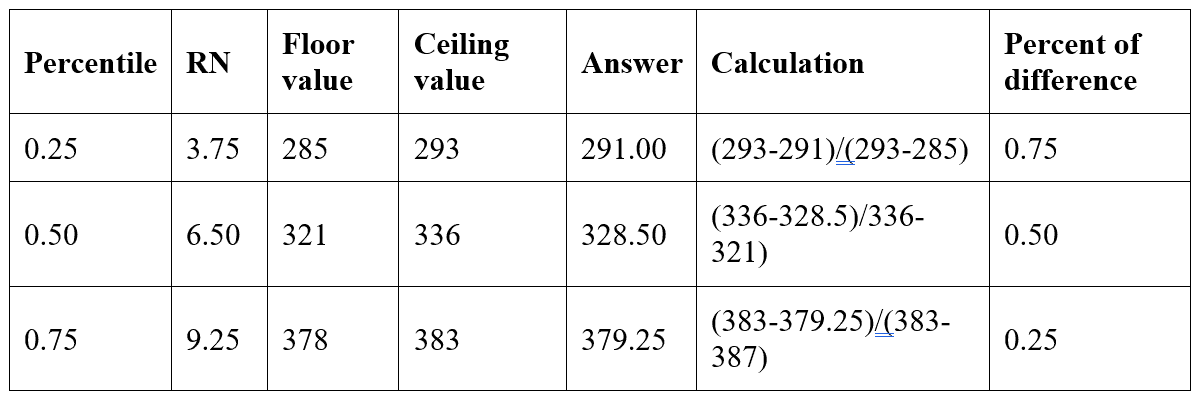
Bazinga! Notice that the Percent of difference in each case is equal to the fractional part of RN. This makes sense! If you view the numbers as being on a line, the value found at precisely the RN point is the answer!
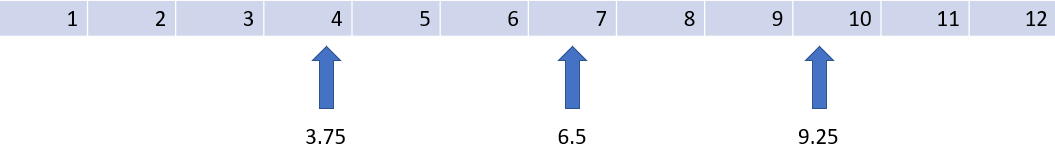
The correct value can be found at the floor row (left side of the decimal point of the row number) plus a percentage (right side of the decimal point of the row number) of the way to the ceiling row. Here is the correct formula:
floor value + (ceiling value – floor value) * (RN modulo FRN)
By using modulo, the fractional part of RN can be found. Finally, here is the query:
|
1 2 3 4 5 6 7 8 9 10 11 12 13 14 15 16 17 18 19 20 21 22 23 24 25 26 27 28 29 30 31 32 33 34 35 36 37 38 39 40 41 42 43 44 45 46 47 48 49 50 51 52 |
DECLARE @P DECIMAL(2, 2) = 0.25; --Using Percentile_Cont WITH PC AS ( SELECT MONTH(OrderDate) AS OrderMonth, COUNT(*) AS OrderCount, PERCENTILE_CONT(@P) WITHIN GROUP(ORDER BY COUNT(*)) OVER() AS PercentileCont FROM Sales.SalesOrderHeader AS SOH WHERE SOH.OrderDate >= '1/1/2012' AND SOH.OrderDate < '1/1/2013' GROUP BY MONTH(OrderDate)) SELECT DISTINCT PC.PercentileCont FROM PC; --The answer! WITH GetRowNumbers AS ( SELECT ROW_NUMBER() OVER (ORDER BY COUNT(*)) AS RowNum, MONTH(SOH.OrderDate) AS OrderMonth, COUNT(*) AS OrderCount, (1 + (@P * (COUNT(*) OVER () - 1))) AS RN, CEILING((1 + (@P * (COUNT(*) OVER () - 1)))) AS CRN, FLOOR((1 + (@P * (COUNT(*) OVER () - 1)))) AS FRN FROM Sales.SalesOrderHeader AS SOH WHERE SOH.OrderDate >= '1/1/2012' AND SOH.OrderDate < '1/1/2013' GROUP BY MONTH(SOH.OrderDate)), FindValues AS (SELECT MIN( CASE WHEN GetRowNumbers.RN = GetRowNumbers.CRN AND GetRowNumbers.RN = GetRowNumbers.FRN THEN GetRowNumbers.OrderCount END ) AS ActualValue, SUM( CASE WHEN GetRowNumbers.RowNum = GetRowNumbers.FRN THEN GetRowNumbers.OrderCount END ) AS FloorValue, SUM( CASE WHEN GetRowNumbers.RowNum = GetRowNumbers.CRN THEN GetRowNumbers.OrderCount END ) AS CeilingValue, RN, FRN FROM GetRowNumbers GROUP BY RN , FRn ) SELECT COALESCE(FindValues.ActualValue, FindValues.FloorValue + (FindValues.CeilingValue - FindValues.FloorValue) * (RN % FRN)) AS CalcAnswer FROM FindValues; |
Once again, the only difference is the formula in the outer query. The CTEs are the same.
Conclusion
Figuring out how PERCENTILE_CONT is calculated is not something that I needed to do, but I do enjoy solving the occasional T-SQL puzzle. The other windowing functions are not difficult to understand, but this one had me scratching my head for a bit. I thought that sharing my thought process might be interesting to others who are getting started with these functions.
The main benefit of using windowing functions is that they make writing queries to solve tricky problems easier, often eliminating anti-patterns such as cursors or triangular joins. The solution does take advantage of the windowing functions introduced with 2005. Trying to accomplish the same thing with SQL Server 2000 or earlier would be even more difficult.
Simple Talk is brought to you by Redgate Software
FAQs
1. What does PERCENTILE_CONT do in SQL Server?
PERCENTILE_CONT computes a continuous percentile value from an ordered set of numbers. It returns the value at the specified percentile position in the sorted set, interpolating between adjacent values when the exact position falls between them. For example, PERCENTILE_CONT(0.5) computes the median – for an even-count set like (10, 20, 30, 40), it returns 25, the average of the two middle values. The function requires SQL Server 2012 or later and uses the WITHIN GROUP (ORDER BY column) clause to specify the ordering. Combine it with an OVER (PARTITION BY …) clause to compute percentiles per group.
2. What is the difference between PERCENTILE_CONT and PERCENTILE_DISC in SQL Server?
PERCENTILE_CONT (continuous) interpolates between adjacent values to compute the exact percentile position – the result may be a value that doesn’t exist in the input set. PERCENTILE_DISC (discrete) returns one of the actual values from the set – the smallest value whose cumulative distribution is greater than or equal to the requested percentile. For the median (0.5): given (1, 2, 3, 4, 5), both return 3. Given (1, 2, 3, 4), PERCENTILE_CONT returns 2.5 (the interpolated middle) while PERCENTILE_DISC returns 2 (the actual value at the median position). Use CONT when you want a statistically smooth result; use DISC when you need an actual value from the dataset (for example, a real customer ID or a valid product code).
3. How do I calculate the median in SQL Server using PERCENTILE_CONT?
Use PERCENTILE_CONT(0.5) WITHIN GROUP (ORDER BY column) OVER (). The OVER () clause with no partition means the median is computed across all rows. For a median per group, use OVER (PARTITION BY group_column). Example: SELECT PERCENTILE_CONT(0.5) WITHIN GROUP (ORDER BY OrderAmount) OVER () AS OverallMedian FROM Sales. The result is returned on every row – if you only want one value, use DISTINCT or an aggregated subquery. Note that PERCENTILE_CONT is technically an analytic function (not an aggregate), so it must be used with OVER ().
4. How do I calculate percentiles in SQL Server 2008 without PERCENTILE_CONT?
SQL Server 2008 and earlier don’t support PERCENTILE_CONT. The workaround is to use ROW_NUMBER() or NTILE() to identify the correct row positions and interpolate manually. For the median: compute ROW_NUMBER() OVER (ORDER BY column) and COUNT(*) OVER (), find the row numbers flanking the centre position, and average those two values. The article walks through the complete pre-2012 equivalent query for arbitrary percentiles, handling both odd-count and even-count sets and interpolating correctly for non-median percentiles (0.25, 0.75, etc.).
5. Can I use PERCENTILE_CONT with GROUP BY in SQL Server?
Not directly – PERCENTILE_CONT is an analytic function, not an aggregate, so it cannot be mixed with GROUP BY in the same query. To compute percentiles per group, use PERCENTILE_CONT(p) WITHIN GROUP (ORDER BY col) OVER (PARTITION BY group_col). The PARTITION BY in the OVER clause replaces GROUP BY for this function. The result is returned on every row in each partition; use SELECT DISTINCT or wrap in a CTE with ROW_NUMBER() = 1 to get one row per partition.
This document contains proprietary information and is protected by copyright law.
Copyright © 2026 Red Gate Software Limited. All rights reserved


Load comments