





Moving from Oracle to PostgreSQL means losing one of Oracle’s most-loved diagnostic tools: the Automatic Workload Repository (AWR). The good news? Most of AWR’s core capabilities – snapshot history, wait event sampling, Top SQL analysis, and buffer cache inspection – have direct, open-source equivalents in PostgreSQL.
This guide translates Oracle AWR concepts into practical PostgreSQL diagnostics using extensions like pg_profile, pg_wait_sampling, and pg_stat_statements – complete with runnable SQL you can apply to your own environment today.
As a multi-platform database specialist it’s safe to say that, if there’s one feature from Oracle I would like to migrate to other databases, it would be the Automatic Workload Repository (AWR).
Introduced in version 10.2.0.3, it’s been welcome with open arms as it includes the highly valued STATSPACK performance tuning tool, as well as several other enhancements. These include its own background processes, memory allocation, and a configurable data repository.
Also included with the AWR is Active Session History (ASH), the Automatic Database Diagnostic Monitor (ADDM), and a group of out-of-the-box reports available to the user.
In this guide, based on one of my previous presentations, I’ll demonstrate how to translate some of the concepts from the Oracle AWR into PostgreSQL performance diagnostics. I’ve turned much of it into runnable SQL and configuration steps for the database enthusiast.
Think of this like a cookbook, where every recipe can be applied directly to your PostgreSQL environment to build a persistent performance repository and replicate the most valuable Oracle AWR capabilities.
Before we jump in, just remember that every database workload is unique! Test all queries for the most optimal implementation – and never simply run in a production environment.
This cookbook is based on Kellyn Gorman’s presentation “Bridging Oracle’s Diagnostics Power with PostgreSQL’s Native Performance Views”.
Who is this guide for?
This guide is for:
- PostgreSQL DBAs building who want to know more about environment performance
- Platform engineers designing observability stacks
- Architects comparing database total cost of ownership
- Anyone who has said “I miss AWR” after moving to PostgreSQL
Did you know?pg_stat_* views cover ~70% of AWR use cases natively, out of the box. The remaining gaps are filled by a small set of open-source extensions, all at zero licensing cost.
Feature comparison: Oracle AWR vs. PostgreSQL
The table below maps major AWR capabilities to their PostgreSQL equivalent and flags where custom work is needed. There are considerable advances in PostgreSQL extensions in recent years, all of which provide valuable performance data for the database specialist.
Although this table is detailed, it’s not exhaustive. Plus, new extensions become available on a regular basis.
| Capability | Oracle AWR | PostgreSQL | Delta |
| Snapshot-based history | ✓ Native (AWR) | ✓ pg_profile ext | Extension required |
| Configurable retention | ✓ 1-50,000 snaps | ✓ Configurable | Feature parity |
| Named baselines | ✓ Fixed & moving | ✗ Manual build | Custom SQL needed |
| Wait event detail (sampled) | ✓ 1,200+ events | ✓ pg_wait_sampling | Extension + sampling |
| SQL elapsed time ranking | ✓ AWR Top SQL | ✓ pg_stat_statements | No plan per exec |
| Per-execution plan capture | ✓ AWR SQL Plan | ✓ pg_store_plans | Extension required |
| Segment-level I/O stats | ✓ v$segment_statistics | ✓ pg_statio_* | Good parity |
| Buffer cache inspection | ✓ v$bh, x$bh | ✓ pg_buffercache | Extension required |
| Latch / mutex contention | ✓ v$latch detail | △ Limited visibility | No latch equiv |
| Blocking / lock waits | ✓ v$session history | ✓ pg_locks + ASH-like | Needs sampling ext |
| Time-model statistics | ✓ v$sess_time_model | ✗ Not native | Custom build |
| Compare Periods report | ✓ AWRDiff | ✗ Manual SQL | No equivalent |
| OS / system metrics | ✓ Included in AWR | △ External (Prometheus) | Agent required |
| Zero licensing cost | ✗ Diagnostics Pack ~$7.8k/DB | ✓ Fully open source | PG wins here |
Why one is not simply ‘better’ than the other
It’s essential to not view one as ‘better’ than the other – they’re just different. Where Oracle has 40 years of enterprise and expensive features built-in, PostgreSQL is open-source and lightweight. What’s added to building out similar functionality to Oracle’s AWR should be expected – and may require additional work.
The PostgreSQL AWR-equivalent extension stack (what you need to get started)
A majority of the work will be covered with pg_stat_statements and pg_profile, so you’ll need to install these if you haven’t already. Add any others, incrementally, as needed.
Top SQL workload analysis in PostgreSQL: pg_stat_statements
Understanding resource consumption by top SQL is a requirement for any database specialist. The top SQL workload analysis is built into PostgreSQL’s core and simply requires us to query the information and present it in an easily readable format.
The query below tracks cumulative execution statistics for every unique query fingerprint.
|
1 2 3 4 5 6 7 8 9 10 |
-- Step 1: Add to postgresql.conf shared_preload_libraries = 'pg_stat_statements' pg_stat_statements.track = all -- track all statements including nested pg_stat_statements.max = 10000 -- max unique queries tracked -- Step 2: Restart PostgreSQL, then create extension CREATE EXTENSION IF NOT EXISTS pg_stat_statements; -- Step 3: Verify SELECT count(*) FROM pg_stat_statements; |
How to receive AWR-equivalent snapshots in PostgreSQL: pg_profile
The extension pg_profile is the closest open-source equivalent to Oracle’s AWR for PostgreSQL.
It captures periodic deltas of all pg_stat_* views into a set of persistent tables, then generates HTML reports comparable to an AWR report. We can then use these to provide like-for-like results.
It’s available at github.com/zubkov-andrei/pg_profile
|
1 2 3 4 5 |
-- Install pg_profile (requires pg_stat_statements already enabled) CREATE EXTENSION IF NOT EXISTS pg_profile; -- Verify the snapshot infrastructure was created SELECT * FROM profile.servers; -- should show 'local' server |
Important note: Always install pg_stat_statements before pg_profile, since the former needs to be installed first.
Get started with PostgreSQL – free book download
Using pg_wait_sampling for ASH/wait event history in PostgreSQL
pg_wait_sampling is the PostgreSQL equivalent of Oracle’s ASH.
Along with the snapshot data retained in the AWR, samples of session information is also retained, this time in Active Session History (ASH). By default, only one out of every ten samples is collected in the long-term AWR history, but this data creates valuable information on average active session (AAS) that a DBA can use to understand how sessions behave over time.
Active Session information from pg_wait_sampling provides sample wait events at a configurable interval (default 10ms) and stores them in a ring buffer and persistent history table.
It’s available at github.com/postgrespro/pg_wait_sampling
|
1 2 3 4 5 6 7 |
-- Add to postgresql.conf and restart shared_preload_libraries = 'pg_stat_statements, pg_wait_sampling' pg_wait_sampling.history_size = 10000 -- ring buffer size pg_wait_sampling.profile_period = 10 -- sample every 10 ms -- After restart, create extension CREATE EXTENSION IF NOT EXISTS pg_wait_sampling; |
pg_buffercache (buffer pool/segment inspection in PostgreSQL)
The pg_buffercache extension is the PostgreSQL equivalent to Oracle’s v$bh view and buffer cache segment analysis.
The pg_buffercache extension exposes the contents of the shared_buffers pool so you can identify which relations are consuming the most cache.
|
1 |
CREATE EXTENSION IF NOT EXISTS pg_buffercache; |
pg_store_plans for execution plan history in PostgreSQL
The extension for pg_store_plans is incredibly valuable to PostgreSQL.
It explores a plan per (queryid, planid) pair, enabling you to detect plan regressions similar to Oracle’s SQL Plan baseline capture (part of the Oracle AWR).
You can download it at github.com/ossc-db/pg_store_plans
|
1 2 3 4 |
shared_preload_libraries = 'pg_stat_statements, pg_wait_sampling, pg_store_plans' -- After restart CREATE EXTENSION IF NOT EXISTS pg_store_plans; |
PostgreSQL slow query plan logging with auto_explain
You can use auto_explain to logs execution plans for any queries exceeding a time threshold.
This is the PostgreSQL feature equivalent (and is similar to) enabling Oracle trace event 10053.
|
1 2 3 4 5 |
shared_preload_libraries = '..., auto_explain' auto_explain.log_min_duration = '1s' -- log plans for queries > 1 second auto_explain.log_analyze = on -- include actual row counts auto_explain.log_buffers = on -- include buffer usage auto_explain.log_nested_statements = on -- include subquery plans |
You must enable track_io_timing = on in postgresql.conf to get I/O timing data in pg_stat_statements and pg_stat_io. Without it, read_time and write_time columns stay at zero.
How to build the snapshot repository in PostgreSQL with pg_profile
Having performance data history is one of the most valuable features of the AWR. By default, 8 days is retained, but most production databases extend this retention to 30-60 days. With pg_profile, we’re able to handle the snapshot capture, delta calculation, retention, and HTML report generation automatically.
Our main challenge is to retain the information over an extended period of time or when a reset is issued. Introducing pg_profile assists in addressing this challenge – however, it doesn’t solve it completely.
The recommended setup of pg_profile is as follows:
Install and configure
|
1 2 3 4 5 6 7 8 |
CREATE EXTENSION IF NOT EXISTS pg_stat_statements; CREATE EXTENSION IF NOT EXISTS pg_profile; -- Review default retention (7 days) SELECT * FROM profile.get_connstr('local'); -- Extend retention to 14 days SELECT profile.set_server_option('local', 'retention', '14'); |
Take snapshots
|
1 2 3 4 5 |
-- Manual snapshot (run any time) SELECT profile.take_sample(); -- List available snapshots SELECT sample_id, sample_time FROM profile.samples ORDER BY sample_id; |
Schedule snapshots with pg_cron
Install pg_cron from your OS package manager and add it to shared_preload_libraries before using the schedule below:
|
1 2 3 4 5 6 |
-- Schedule a snapshot every 30 minutes SELECT cron.schedule('pg_profile_snap', '*/30 * * * *', $$SELECT profile.take_sample()$$); -- Verify the cron job was created SELECT * FROM cron.job WHERE jobname = 'pg_profile_snap'; |
Generate an AWR-style HTML report
|
1 2 3 4 5 6 7 8 9 |
-- List available snapshot IDs first SELECT sample_id, sample_time FROM profile.samples ORDER BY sample_id DESC LIMIT 20; -- Generate HTML report between snapshot 1 and snapshot 10 -- Save the output to a file via psql \o or application layer SELECT profile.get_report(1, 10); -- Generate a text report instead SELECT profile.get_report(1, 10, 'text'); |
How to navigate a pg_profile report (and what the report provides)
A pg_profile report contains high-level information about the PostgreSQL server – including stats on the cluster, database and SQL, then schema objects, functions and settings.
Each of these section headers, shown in the image below, are also links to connect to the section in the report they refer to:
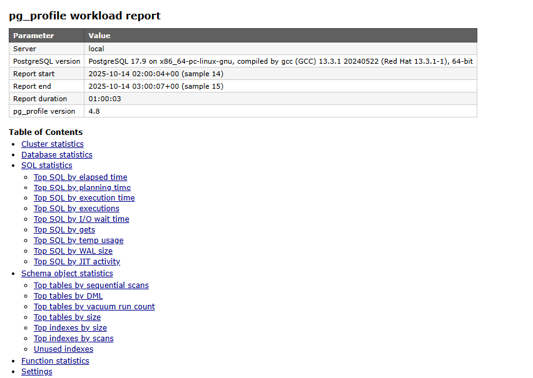
pg_profile report in PostgreSQL – here, we see the table of contents.The database statistics section highlights important information for all databases in the cluster, including the number of commits, rollbacks, Cache hit%, rate of change, and more.

pg_profile report in PostgreSQL.The ‘Top SQL’ section contains information that is easily recognizable to Oracle DBAs. This includes the queryID, which database in the cluster the query belongs to, elapsed time, number of rows, calls, and the min and max time.

pg_profile report in PostgreSQL.Full SQL text is displayed for each of the query IDs, and then the data is presented in various orders – e.g by planning time, execution time, I/O wait time, gets, temp usage, just in time(JIT) activity, and WAL size. This is similar to an Oracle AWR report – just, in this case, we’re getting information vital to the management of a PostgreSQL database.
The report concludes with vacuum, index usage, and settings information, along with links to take the reader back to the top of the report. Here, the links navigate to different sections, making the process seamless for users to explore the report once they’ve identified an issue.
How to create your own repository in PostgreSQL
pg_profile should always be your first option for performance data in PostgreSQL.
However, if for some reason you can’t install pg_profile, don’t worry – there are other ways to create a minimal snapshot table.
Here, I’ll show you how to build one manually that can be used to capture deltas with a scheduled procedure.
How to create the snapshot table
|
1 2 3 4 5 6 7 8 9 10 11 12 13 14 15 |
-- Minimal snapshot table (stores point-in-time copies of pg_stat_statements) CREATE TABLE IF NOT EXISTS perf_snapshots ( snap_id BIGSERIAL PRIMARY KEY, snap_time TIMESTAMPTZ NOT NULL DEFAULT now(), queryid BIGINT, query TEXT, calls BIGINT, total_exec_time DOUBLE PRECISION, shared_blks_hit BIGINT, shared_blks_read BIGINT, rows BIGINT ); CREATE INDEX ON perf_snapshots (snap_time); CREATE INDEX ON perf_snapshots (queryid, snap_time); |
The capture procedure
|
1 2 3 4 5 6 7 8 9 10 11 12 13 |
CREATE OR REPLACE PROCEDURE capture_perf_snapshot() LANGUAGE sql AS $$ INSERT INTO perf_snapshots (snap_time, queryid, query, calls, total_exec_time, shared_blks_hit, shared_blks_read, rows) SELECT now(), queryid, query, calls, total_exec_time, shared_blks_hit, shared_blks_read, rows FROM pg_stat_statements; $$; -- Schedule via pg_cron SELECT cron.schedule('perf_snap', '*/30 * * * *', $$CALL capture_perf_snapshot()$$); |
The delta report between two snapshot times
|
1 2 3 4 5 6 7 8 9 10 11 12 13 14 15 16 17 18 19 20 21 22 23 24 25 26 |
-- Identify two snapshot times to compare SELECT DISTINCT snap_time FROM perf_snapshots ORDER BY snap_time DESC LIMIT 20; -- Delta report: new load between :start_ts and :end_ts WITH s1 AS ( SELECT queryid, query, calls, total_exec_time, shared_blks_hit, shared_blks_read FROM perf_snapshots WHERE snap_time = :'start_ts' ), s2 AS ( SELECT queryid, calls, total_exec_time, shared_blks_hit, shared_blks_read FROM perf_snapshots WHERE snap_time = :'end_ts' ) SELECT left(s1.query, 80) AS query_snippet, (s2.calls - s1.calls) AS new_calls, round((s2.total_exec_time - s1.total_exec_time)::numeric / 1000, 2) AS added_exec_sec, (s2.shared_blks_read - s1.shared_blks_read) AS new_disk_reads, (s2.shared_blks_hit - s1.shared_blks_hit) AS new_buffer_hits FROM s1 JOIN s2 USING (queryid) WHERE s2.calls > s1.calls ORDER BY added_exec_sec DESC LIMIT 20; |
This table and scheduled job can now collect snapshot performance data in any PostgreSQL environment. Additionally, querying the table now allows you to inspect performance impacts without the pg_profile extension.
SQL ranking and workload analysis in PostgreSQL
One of the biggest challenges when using performance data is understanding how to query quantities and time. The queries in this section mirror Oracle’s AWR Top SQL report using pg_stat_statements and serve as an example of how to calculate it correctly in PostgreSQL.
Note the examples for total_exec_time, mean_exec_time, blk_read_time, etc.
Top SQL by total execution time
|
1 2 3 4 5 6 7 8 9 10 11 12 13 14 |
-- Equivalent to Oracle AWR "Top SQL by Elapsed Time" SELECT left(query, 80) AS query_snippet, calls, round(total_exec_time::numeric / 1000, 2) AS total_exec_sec, round(mean_exec_time::numeric / 1000, 4) AS avg_exec_sec, rows, shared_blks_hit, shared_blks_read, round(blk_read_time::numeric / 1000, 3) AS read_sec, round(blk_write_time::numeric / 1000, 3) AS write_sec FROM pg_stat_statements ORDER BY total_exec_time DESC LIMIT 10; |
Top SQL by I/O (disk reads)
|
1 2 3 4 5 6 7 8 9 10 11 12 13 |
SELECT left(query, 80) AS query_snippet, calls, shared_blks_read AS disk_reads, shared_blks_hit AS buffer_hits, round(100.0 * shared_blks_hit / NULLIF(shared_blks_hit + shared_blks_read, 0), 1) AS buffer_hit_pct, round(total_exec_time::numeric / 1000, 2) AS total_exec_sec FROM pg_stat_statements WHERE shared_blks_read > 0 ORDER BY shared_blks_read DESC LIMIT 10; |
Top SQL by average execution time (worst per-call performance)
|
1 2 3 4 5 6 7 8 9 10 11 |
SELECT left(query, 80) AS query_snippet, calls, round(mean_exec_time::numeric / 1000, 4) AS avg_exec_sec, round(stddev_exec_time::numeric / 1000, 4) AS stddev_exec_sec, round(min_exec_time::numeric / 1000, 4) AS min_exec_sec, round(max_exec_time::numeric / 1000, 4) AS max_exec_sec FROM pg_stat_statements WHERE calls >= 10 -- ignore single-run outliers ORDER BY mean_exec_time DESC LIMIT 10; |
Top SQL by row throughput
|
1 2 3 4 5 6 7 8 9 |
SELECT left(query, 80) AS query_snippet, calls, rows, round(rows::numeric / NULLIF(calls, 0), 1) AS rows_per_call, round(total_exec_time::numeric / 1000, 2) AS total_exec_sec FROM pg_stat_statements ORDER BY rows DESC LIMIT 10; |
Wait event analysis in PostgreSQL
Wait classes serve as high-level categories that help identify pain points in performance, and wait events are more detailed events that belong to each category.
These are the cornerstone of method tuning in Oracle and much of it can be duplicated in PostgreSQL from version 16 onwards.
Current wait events (live sessions)
The point-in-time snapshot is the PostgreSQL equivalent of querying Oracle’s v$session for wait events. It’ll look familiar to any Oracle DBA and will provide value to even the newest PostgreSQL user.
It shows event type (like wait class, which is the category), and then the corresponding breakdown of wait events (the things causing the majority of time and resource consumption in the database.)
|
1 2 3 4 5 6 7 8 9 10 11 |
consumption in the database. SELECT wait_event_type, wait_event, count(*) AS session_count, array_agg(pid) AS pids FROM pg_stat_activity WHERE state != 'idle' AND wait_event IS NOT NULL GROUP BY 1, 2 ORDER BY 3 DESC; |
Historical wait event profile (pg_wait_sampling)
Sampled wait history is the PostgreSQL equivalent of the Oracle AWR Top 5 Wait Events report.
It requires the pg_wait_sampling extension and gives us a clear picture of what percentage of what event type (category) is consuming database time (broken down to the exact wait event detail).
|
1 2 3 4 5 6 7 8 9 10 11 |
-- Top wait events by sample count (percentage of total) SELECT wait_event_type, wait_event, count(*)::numeric AS samples, round(count(*) * 100.0 / sum(count(*)) OVER (), 1) AS pct FROM pg_wait_sampling_history GROUP BY 1, 2 ORDER BY samples DESC LIMIT 10; |
Wait events over a time window
|
1 2 3 4 5 6 7 8 9 10 |
-- Filter to a specific time window (requires pg_wait_sampling) SELECT wait_event_type, wait_event, count(*) AS samples FROM pg_wait_sampling_history WHERE sample_time BETWEEN now() - interval '1 hour' AND now() GROUP BY 1, 2 ORDER BY 3 DESC LIMIT 15; |
A key PostgreSQL gap versus Oracle
Oracle samples waits natively at ~10x/sec via ASH, but PostgreSQL has no built-in equivalent. pg_wait_sampling with a bgworker is the closest alternative. Without this, you’ll only see instantaneous waits from pg_stat_activity.
Free desktop tool for fast PostgreSQL monitoring and diagnostics
How to detect I/O bottlenecks in PostgreSQL
There are a few methods for detecting I/O bottlenecks in PostgreSQL. Here, I’ll run through a few of them.
System-wide I/O accounting using pg_stat_io (PostgreSQL 16 onwards)
The pg_stat_io extension is the closest PostgreSQL-native equivalent to Oracle’s v$filestat. It breaks down reads, writes, hit rates, and evictions by backend type and object context. As the natural life of a database is growth, understanding how IO is impacting performance is essential to database management.
pg_stat_io is only available in PostgreSQL 16 onwards. For PG 15 (and earlier), use pg_stat_bgwriter and pg_stat_io_* views instead.
|
1 2 3 4 5 6 7 8 9 10 11 12 13 14 15 16 17 |
-- Full I/O breakdown by backend type SELECT backend_type, object, context, reads, writes, extends, round(read_time::numeric / 1000, 2) AS read_sec, round(write_time::numeric / 1000, 2) AS write_sec, hits, evictions, reuses, round(hits::numeric / NULLIF(hits + reads, 0) * 100, 1) AS hit_pct FROM pg_stat_io ORDER BY reads DESC; |
Checkpoint & buffer manager stats in PostgreSQL with pg_stat_bgwriter
The pg_stat_pgwriter extension is currently available in every version of PostgreSQL. It shows checkpoint frequency, buffer writes, and clean/dirty eviction patterns.
|
1 2 3 4 5 6 7 8 9 10 11 12 13 |
SELECT checkpoints_timed, checkpoints_req, round(checkpoint_write_time / 1000, 1) AS chkpt_write_sec, round(checkpoint_sync_time / 1000, 1) AS chkpt_sync_sec, buffers_checkpoint, buffers_clean, maxwritten_clean, buffers_backend, buffers_backend_fsync, buffers_alloc, stats_reset FROM pg_stat_bgwriter; |
Tip: If checkpoints_req is high (relative to checkpoints_timed), your checkpoint_completion_target or max_wal_size may need tuning. Frequent requested checkpoints increase I/O spikes.
Hot buffer/segment inspection in PostgreSQL with pg_buffercache
The pg_buffercache extension is the PostgreSQL equivalent to Oracle’s v$bh buffer cache segment report, identifying which relations occupy the most shared_buffers pages.
|
1 2 3 4 5 6 7 8 9 10 11 12 13 14 |
SELECT c.relname, count(*) AS buffers_in_cache, round(count(*) * 8192.0 / 1024 / 1024, 1) AS size_mb, round(100.0 * count(*) / (SELECT count(*) FROM pg_buffercache), 1) AS pct_of_cache, count(*) FILTER (WHERE b.isdirty) AS dirty_buffers, round(100.0 * count(*) FILTER (WHERE b.isdirty) / NULLIF(count(*), 0), 1) AS dirty_pct FROM pg_buffercache b JOIN pg_class c ON c.relfilenode = b.relfilenode GROUP BY 1 ORDER BY buffers_in_cache DESC LIMIT 15; |
Per-table I/O stats with pg_statio_user_tables in PostgreSQL
|
1 2 3 4 5 6 7 8 9 10 11 12 13 14 15 |
SELECT schemaname, relname, heap_blks_read, heap_blks_hit, round(100.0 * heap_blks_hit / NULLIF(heap_blks_hit + heap_blks_read, 0), 1) AS heap_hit_pct, idx_blks_read, idx_blks_hit, toast_blks_read, toast_blks_hit FROM pg_statio_user_tables ORDER BY heap_blks_read + idx_blks_read DESC LIMIT 15; |
Blocking and concurrency detection in PostgreSQL
We already know how important active session information is, but understanding blocking sessions is also valuable.
Active session and blocking tree
While multi-version concurrency control (MVCC) helps to eliminate some blocking we experience in other database platforms, blocking is still an important area to monitor in PostgreSQL.
Knowing how to show all non-idle sessions, identify which session are blocked, and show the blocking PID chain, is essential. The following query mirrors Oracle’s v$session blocking analysis.
|
1 2 3 4 5 6 7 8 9 10 11 12 13 14 15 16 17 18 19 20 21 22 23 24 25 |
WITH blocking AS ( SELECT pid, usename, datname, wait_event_type, wait_event, state, query_start, pg_blocking_pids(pid) AS blockers, left(query, 80) AS query FROM pg_stat_activity WHERE state != 'idle' ) SELECT pid, state, wait_event_type, wait_event, array_length(blockers, 1) AS blocked_by_n, blockers, now() - query_start AS duration, query FROM blocking ORDER BY blocked_by_n DESC NULLS LAST, duration DESC; |
Long-running transactions and idle-in-transaction sessions
The following query displays sessions in the idle-in-transaction state, hold row locks, and block VACUUM. This query can also be used as a basis to build alerts longer than 5 minutes.
|
1 2 3 4 5 6 7 8 9 10 11 12 13 |
-- Sessions idle-in-transaction SELECT pid, usename, datname, state, now() - xact_start AS txn_age, now() - state_change AS idle_since, left(query, 100) AS last_query FROM pg_stat_activity WHERE state = 'idle in transaction' AND xact_start < now() - interval '5 minutes' ORDER BY txn_age DESC; |
Lock detail for a specific session
|
1 2 3 4 5 6 7 8 9 10 11 |
-- Replace :target_pid with the PID of interest SELECT locktype, relation::regclass AS relation_name, mode, granted, transactionid, classid, objid FROM pg_locks WHERE pid = :target_pid; |
Lock wait summary
|
1 2 3 4 5 6 7 8 9 10 11 12 |
-- All lock waits currently in progress SELECT waiting.pid AS waiting_pid, waiting.query AS waiting_query, blocking.pid AS blocking_pid, blocking.query AS blocking_query, now() - waiting.query_start AS wait_duration FROM pg_stat_activity AS waiting JOIN pg_stat_activity AS blocking ON blocking.pid = ANY(pg_blocking_pids(waiting.pid)) WHERE waiting.wait_event_type = 'Lock' ORDER BY wait_duration DESC; |
Important note!idle in transaction sessions hold row locks and can prevent VACUUM from reclaiming dead tuples, causing table bloat. Set idle_in_transaction_session_timeout in postgresql.conf to automatically terminate such sessions.
Named baselines and period comparison in PostgreSQL
Oracle AWR provides fixed and moving-window baselines natively. In PostgreSQL, meanwhile, you’ll build these manually by tagging snapshot ranges and comparing deltas, as I demonstrate below.
How to create a baseline registry table
|
1 2 3 4 5 6 7 8 9 10 11 12 13 14 15 |
CREATE TABLE IF NOT EXISTS perf_baselines ( baseline_name TEXT PRIMARY KEY, description TEXT, start_snap_time TIMESTAMPTZ NOT NULL, end_snap_time TIMESTAMPTZ NOT NULL, created_at TIMESTAMPTZ DEFAULT now() ); -- Register a peak-load baseline INSERT INTO perf_baselines VALUES ( 'peak_load_2025_q1', 'Monday morning peak observed 2025-01-13 09:00-10:00', '2025-01-13 09:00:00+00', '2025-01-13 10:00:00+00' ); |
How to compare the current period against the baseline
|
1 2 3 4 5 6 7 8 9 10 11 12 13 14 15 16 17 18 19 20 21 22 23 24 25 26 27 28 29 30 31 32 33 34 35 36 37 38 39 |
-- Compare current 1-hour window to a named baseline WITH baseline AS ( SELECT queryid, sum(s2.calls - s1.calls) AS base_calls, sum(s2.total_exec_time - s1.total_exec_time) AS base_exec_ms, sum(s2.shared_blks_read - s1.shared_blks_read)AS base_reads, max(s1.query) AS query FROM perf_snapshots s1 JOIN perf_snapshots s2 USING (queryid) JOIN perf_baselines b ON b.baseline_name = 'peak_load_2025_q1' WHERE s1.snap_time = b.start_snap_time AND s2.snap_time = b.end_snap_time GROUP BY queryid ), current_window AS ( SELECT queryid, sum(s2.calls - s1.calls) AS cur_calls, sum(s2.total_exec_time - s1.total_exec_time) AS cur_exec_ms, sum(s2.shared_blks_read - s1.shared_blks_read)AS cur_reads FROM perf_snapshots s1 JOIN perf_snapshots s2 USING (queryid) WHERE s1.snap_time = now() - interval '1 hour' AND s2.snap_time = ( SELECT max(snap_time) FROM perf_snapshots) GROUP BY queryid ) SELECT left(b.query, 70) AS query_snippet, b.base_calls, c.cur_calls, round(b.base_exec_ms::numeric / 1000, 2) AS base_sec, round(c.cur_exec_ms::numeric / 1000, 2) AS cur_sec, round((c.cur_exec_ms - b.base_exec_ms) / NULLIF(b.base_exec_ms,0) * 100, 1) AS exec_pct_change FROM baseline b JOIN current_window c USING (queryid) WHERE abs(c.cur_exec_ms - b.base_exec_ms) > 1000 -- > 1 second difference ORDER BY exec_pct_change DESC LIMIT 20; |
This process allows you to easily monitor, compare, and manage baseline performance.
WAL and replication monitoring in PostgreSQL
WAL (Write-Ahead Logging) is the mechanism PostgreSQL uses to keep your data safe and consistent.
The core idea is simple: before PostgreSQL makes any changes to the actual data files on disk, it first records those changes in a sequential log – the write-ahead log. Because the change is safely written to this log before it’s applied, the database can always recover after a crash or power failure by replaying the log and reconstructing any work that hadn’t yet been fully saved to the data files.
This “log first, write later” approach also makes the database faster, since appending to a sequential log is quicker than constantly updating scattered data files. It also underpins important features like point-in-time recovery and streaming replication to standby servers.
It’s essential for any database specialist to understand the following:
- How much WAL is being generated
- If there’s any latency in WAL generation
- If there’s any lag in replication of WAL to replicas
- The overall health of the WAL replication
WAL generation rate
|
1 2 3 4 5 6 7 8 9 10 |
SELECT wal_records, wal_fpi, round(wal_bytes / 1024.0 / 1024, 1) AS wal_mb, wal_buffers_full, wal_write, round(wal_write_time / 1000, 2) AS wal_write_sec, round(wal_sync_time / 1000, 2) AS wal_sync_sec, stats_reset FROM pg_stat_wal; |
Replication lag
|
1 2 3 4 5 6 7 8 9 10 11 12 13 14 |
-- On the primary: show replica lag SELECT client_addr, state, sent_lsn, write_lsn, flush_lsn, replay_lsn, write_lag, flush_lag, replay_lag, sync_state FROM pg_stat_replication ORDER BY replay_lag DESC NULLS LAST; |
Table and index health in PostgreSQL
The health of objects in PostgreSQL can refer to numerous things, but one of the areas of concern is around the amount of bloat a database has. Bloat refers to the wasted, unused space that accumulates inside tables and indexes over time, caused by how PostgreSQL handles updates and deletes. Why is this?
Well, rather than overwriting or immediately removing a row, PostgreSQL marks the old version as ‘dead’ and writes a new version elsewhere. This is a side effect of its MVCC design, which allows many transactions to read and write at the same time, without blocking each other. ‘Dead’ rows can’t simply disappear on their own – they linger in the table, taking up disk space and making queries slower because of how PostgreSQL has to scan past them.
Normally, the PostgreSQL autovacuum process cleans up dead rows and makes that space reusable. However, if updates and deletes happen faster than vacuum can keep up, or if vacuum isn’t tuned well, the dead space piles up as bloat. Left unchecked, bloat increases storage usage, degrades query performance, and can sometimes require maintenance operations like VACUUM FULL – or tools such as pg_repack – to physically reclaim the space.
Move fast. Govern at scale.
Table statistics: bloat indicators
|
1 2 3 4 5 6 7 8 9 10 11 12 13 14 15 16 |
SELECT schemaname, relname, n_live_tup, n_dead_tup, round(100.0 * n_dead_tup / NULLIF(n_live_tup + n_dead_tup, 0), 1) AS dead_pct, last_vacuum, last_autovacuum, last_analyze, last_autoanalyze, vacuum_count, autovacuum_count FROM pg_stat_user_tables ORDER BY n_dead_tup DESC LIMIT 20; |
Unused indexes
The next point of focus is unused indexes. When index usage is monitored, you know exactly if an index is providing value, or if it’s just consuming space and resources. Unfortunately, PostgreSQL doesn’t feature index monitoring.
|
1 2 3 4 5 6 7 8 9 10 11 12 13 |
-- Indexes that have never been used (candidates for removal) SELECT schemaname, relname, indexrelname, idx_scan, idx_tup_read, idx_tup_fetch, pg_size_pretty(pg_relation_size(indexrelid)) AS index_size FROM pg_stat_user_indexes WHERE idx_scan = 0 AND schemaname NOT IN ('pg_catalog', 'pg_toast') ORDER BY pg_relation_size(indexrelid) DESC; |
It’s common for a few objects in a database to become larger than average. Tables that hold transactional information for customer data or inventory can become much larger than the majority, and understanding what objects may be creating performance issues is another aspect of monitoring. The indexes on these tables also can become very large, especially if bloat is involved.
Largest tables and indexes
|
1 2 3 4 5 6 7 8 9 10 11 12 13 14 15 |
SELECT relname, relkind, pg_size_pretty(pg_total_relation_size(oid)) AS total_size, pg_size_pretty(pg_relation_size(oid)) AS table_size, pg_size_pretty( pg_total_relation_size(oid) - pg_relation_size(oid)) AS index_size FROM pg_class WHERE relkind IN ('r', 'i', 'm') AND relnamespace NOT IN ( SELECT oid FROM pg_namespace WHERE nspname IN ('pg_catalog','information_schema','pg_toast')) ORDER BY pg_total_relation_size(oid) DESC LIMIT 20; |
The implementation roadmap you should follow
Now that we understand what to inspect for performance impact, we now need to implement it in the least disruptive way possible, but also in the way that provides the most value.
Consider following this phased rollout to reach enterprise-grade PostgreSQL diagnostics without disrupting your environment.
| Day 1: Baseline | Week 1: History | Month 1: Deep Diag | Quarter: Baselines |
Enable pg_stat_statements | Install pg_profile | Add pg_wait_sampling (wait history) | Register peak-load baselines |
Set track_io_timing = on | Schedule snapshot every 30 min (pg_cron) | Add pg_buffercache (cache inspection) | Build compare-period delta reports |
Verify pg_stat_io (PG 16+) | Set retention to 14+ days | Add pg_store_plans (plan history) | Integrate with Prometheus / Grafana |
Baseline with pg_stat_bgwriter | Review first AWR-style HTML report | Build alerting on blocking sessions | Document tuning runbooks |
| Review current Top SQL | Tune postgresql.conf based on findings | Create idle_in_transaction alert | Schedule quarterly baseline reviews |
Reference and resources
Below are the numerous GitHub and document references I used to build my presentation and, in turn, this very cookbook you’re now reading.
Extension repositories
- pg_profile: github.com/zubkov-andrei/pg_profile
- pg_wait_sampling: github.com/postgrespro/pg_wait_sampling
- pg_store_plans: github.com/ossc-db/pg_store_plans
Official PostgreSQL documentation
pg_stat_statements: postgresql.org/docs/current/pgstatstatements.htmlpg_buffercache: postgresql.org/docs/current/pgbuffercache.html- Monitoring Stats Ref: postgresql.org/docs/current/monitoring-stats.html
pg_stat_io(PG 16+): postgresql.org/docs/current/monitoring-stats.html#MONITORING-PG-STAT-IO-VIEW
Quick-reference: postgresql.conf settings
Finally, here’s an excellent example of a postgresql.conf file configuration:
|
1 2 3 4 5 6 7 8 9 10 11 12 13 14 15 16 17 18 19 20 21 22 |
# ── required for this cookbook ────────────────────────────────── shared_preload_libraries = 'pg_stat_statements, pg_wait_sampling, pg_store_plans, auto_explain, pg_cron' # pg_stat_statements pg_stat_statements.track = all pg_stat_statements.max = 10000 # I/O timing (critical for meaningful read/write time columns) track_io_timing = on # Autovacuum protection idle_in_transaction_session_timeout = 300000 -- 5 minutes in ms # pg_wait_sampling pg_wait_sampling.history_size = 10000 pg_wait_sampling.profile_period = 10 -- ms # auto_explain auto_explain.log_min_duration = '1s' auto_explain.log_analyze = on auto_explain.log_buffers = on auto_explain.log_nested_statements = on |
Conclusion
Using these extensions, along with scripts and reporting features, offers the PostgreSQL DBA the opportunity for insight into database performance covering over 70% of what is offered by Oracle’s enterprise Automatic Workload Repository (AWR).
Going forward, I expect significant extension enhancements and improvements that will close the gap between enterprise and open-source tooling to diagnose and identify performance issues in PostgreSQL.
This cookbook is based on Kellyn Gorman’s presentation “Bridging Oracle’s Diagnostics Power with PostgreSQL’s Native Performance Views”.
This document contains proprietary information and is protected by copyright law.
Copyright © 2026 Red Gate Software Limited. All rights reserved




Load comments