
The series so far:
- Automating Day-to-Day PowerShell Admin Tasks – Part 1: Jobs and Workflow
- PowerShell Day-to-Day Admin Tasks – Part 2: WMI, CIM and PSWA
- PowerShell Day-to-Day Admin Tasks – Part 3: Monitoring Performance
- PowerShell Day-to-Day Admin Tasks – Part 4: Securing Scripts
- PowerShell Day-to-Day Admin Tasks – Part 5: Events and Monitoring
- PowerShell Day-to-Day Admin Tasks - Part 6: Real Time IT Dashboard
Whether you are a systems administrator or an administrator of either database or networks, it is likely that you have a daily struggle with the task of gathering and analysing performance counters in order to monitor performance of the devices in your care. If the systems are operational and respond to their workload quickly, then this indicates that all is likely to be well. But how do you make sure routinely? Can you easily spot signs of potential trouble?
I’ve already demonstrated the PowerShell methods of accessing and interacting with your devices. So you’re ready to understand the many opportunities that the various PowerShell commands provide to make your life easier and less monotonous. This article will describe how to collect, export, display and analyse data from performance counters.
As this article is relatively important for a SysAdmin, I will provide several basic examples just to illustrate how data about performance counters is gathered and analysed. Then, at the end, we will look at more practical examples.
Gathering data from performance counters
It is possible to gather data performance that will help us with the diagnosis of certain problems. Indeed, we can access many different types of data on the device that we’re monitoring: data such as Processor, Memory or Disk amongst others. In order to do that, the command Get-Counter was introduced with Windows 8 and Windows Sever 2012. Let’s start by obtaining available groups on our local device:
|
1 |
PS > Get-Counter -ListSet * | Select-Object -ExpandProperty CounterSetName |
This command gives us a great deal of information in the results, so I will only display the names of the groups.
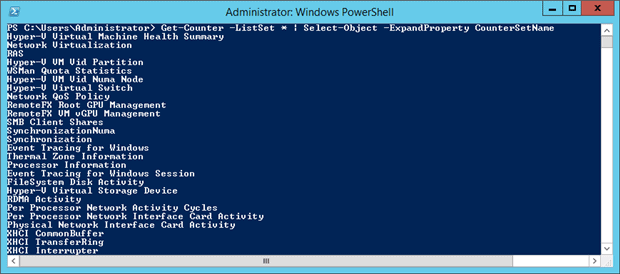
Figure1 – List of groups available
As well as the core groups, or sets, of counters, certain additional groups may be available depending on the machine you execute this command on. Here, the device has the “Hyper-V” role available so there are corresponding groups of counters. If we want to drill down into the counters available for Hyper-V, we can then display several groups starting with “Hyper-V”. The complete list of these groups on my device can be obtained with the following command:
|
1 |
PS > Get-Counter -ListSet *Hyper-V* | Select-Object CounterSetName, CounterSetType, Description, Paths | Out-GridView -Title "Hyper-V counters" |
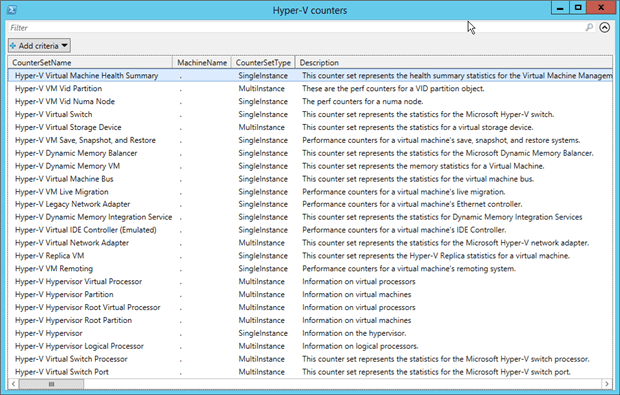
Figure2 – List of groups beginning with “Hyper-V”
Here, I’ve used the Out-GridView Cmdlet to represent this data in a more readable form.
As a matter of interest, you can find out the total number of available groups at your disposal with the following commands:
|
1 2 |
PS > $TotalCounter = Get-Counter -ListSet * PS > $TotalCounter | Measure-Object | select Count |
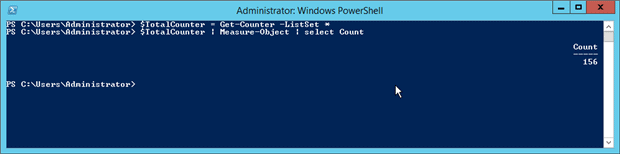
Figure3 – Number of available groups
Accessing the counter data
The –counter parameter associated with the Get-Counter command allows us to specify one or more counters to analyze. In a first instance, I’ll retrieve the available memory on my Hypervisor:
|
1 |
PS > get-counter -counter "\memory\available mbytes" |
Note:When you obtain the result, the data is given in a pre-formatted “cooked value”. This refers to the formula for calculating performance data. A performance counter can be ‘Raw’, ‘Second’ and ‘cooked’. An expression containing the first two gives the “cooked values“. These latter ones are a representation of the values understandable by humans.
Now, I want to verify that the virtual machine displayed on my Hypervisor has enough memory. (This is not to train you on the learning of Hyper-V, for this, I merely suggest this excellent article on the concept of Dynamic Memory) For this, I check the result of the “Average Pressure” counter. If the latter is below 100, then the virtual machine has sufficient memory:
|
1 |
PS > (Get-Counter '\Hyper-V Dynamic Memory VM(*)\Average Pressure').CounterSamples[0].CookedValue |
The sign * means that all processes of the overall virtual machines. But I can point out a particular process:
|
1 |
PS > (Get-Counter '\Hyper-V Dynamic Memory VM(WindowsServer2016)\Average Pressure').CounterSamples[0]. |
This is fine but in this example, I already knew the names of the counters I needed. Occasionally, however, I will need to find out the available counters in a new group. In this example, I have a particular interest in monitoring the performance of Hyper-V. Therefore, I retrieve in a first instance the overall paths of this group of performance counters into a $HyperVInformations variable. Then I display the counters:
|
1 2 |
PS > $HyperVInformations = (get-counter -ListSet "Hyper-V Hypervisor").paths PS > Get-Counter -Counter $HyperVInformations |
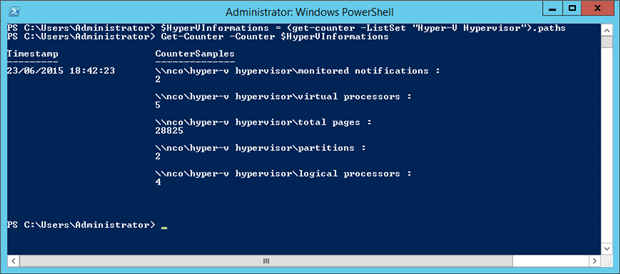
Figure4 – List of counters
If I wish to display only one counter as I did in previous examples, then I just need to indicate it in the Get-Counter cmdlet:
|
1 2 |
PS > (Get-Counter -ListSet "Hyper-V Hypervisor").paths PS > Get-Counter -Counter "\Hyper-V Hypervisor\Virtual Processors" |
Obtaining several data sets
By default, only a single set of data is retrieved. However, we are likely to be interested in seeing the progressive values of a counter over a longer period of time. The first idea that comes to mind is to manually run the same command at regular intervals. Is this a solution? No, I must automate this action. That’s perfect, because PowerShell has foreseen this with the parameter –MaxSamples. It allows us to specify the number of sets of data to retrieve. I can also use the parameter -Continuous to gather results ad infinitum, using CTRL + C to stop the retrieving process.
This command allows us to verify the memory of our host for a 10 second interval (10 sets * 1 second), with one reading every second:
|
1 |
PS > Get-Counter -Counter "\memory\available mbytes" -MaxSamples 10 -SampleInterval 1 |
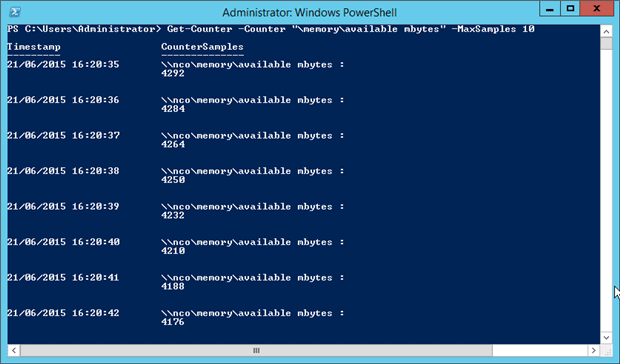
Figure5 – Display of memory on the data of 10 sets
It is, of course, possible to specify a sampling time-interval (in seconds) to this command, as by default, the values are retrieved every second. So as to have a preview of the memory usage, we will specify 10 sets of data taken one every minute over ten minutes:
|
1 |
PS > Get-Counter -Counter "\memory\available mbytes" -MaxSamples 10 -SampleInterval 60 |
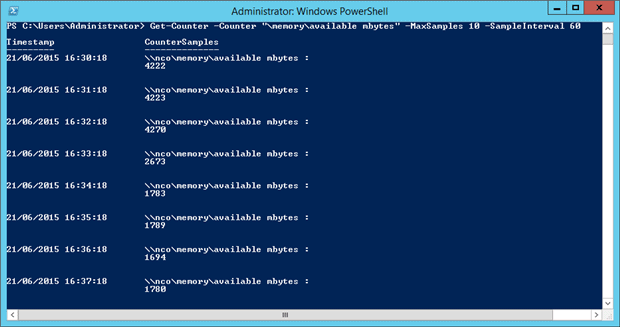
Figure6 – Time interval every minute
You can indicate several counters within the same command by passing them as an array:
|
1 2 |
PS > $CtrsList = "\Memory\Page Faults/sec","\Memory\% Committed Bytes In Use","\Memory\Available MBytes" PS > Get-Counter -counter $CtrsList | Select-Object -ExpandProperty CounterSamples |
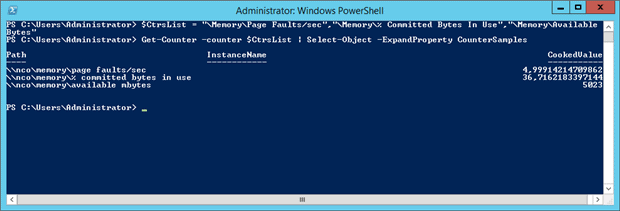
Figure7 – Multiple counters
Remote counter access
We can interrogate remote devices to obtain their performance counter data. For this, the –ComputerName parameter is used. As well as specifying a single computer, we can use it to interrogate a number of devices to check that the device behaves correctly. We can pass the cmdlet a list of computers as an array.
|
1 2 3 4 5 |
PS > $Counters = '\Memory\% Committed Bytes in Use', '\Memory\Available MBytes', '\PhysicalDisk(_Total)\Disk Write/sec' PS > $Computers = "ADM01","ADM11" PS > Get-Counter -counter $Counters -ComputerName $Computers |
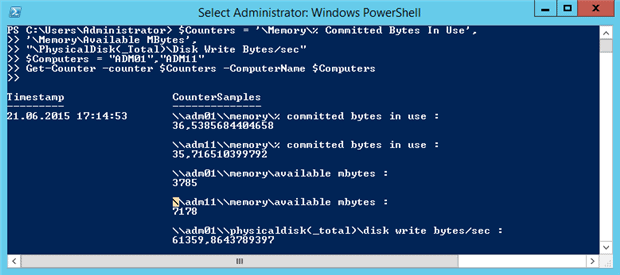
Figure8 – Remote data access
You may also use a text folder that contains a list of servers to be analyzed: for this, you need to indicate it the following to the parameter –computername:
|
1 |
PS > Get-Counter -computername (get-content servers.txt) "\Memory\Available Mbytes" |
Note:The main restriction is that Get-Counter has no –Credentials parameter. The local account that you use to run PowerShell must be in the ‘Performance Monitor Users’ group on every remote server. If this proves to be a problem, you must use the Invoke-Command in the following way:
|
1 |
PS > Invoke-Command -ComputerName ADM01,ADM11 -ScriptBlock { Get-Counter -Counter "xxxxxxxxxxx" } -credential DOMAIN\USER |
The counters and jobs
You will have gathered that, to obtain data performance over a time period, you will need that time period for execution. Furthermore, it is likely that this data must be gathered over set periods of time, Such as outside office hours. Therefore, I recommend to use PowerShell jobs as we have already seen in the first part of these series.
Herewith a very simple example:
|
1 |
PS > Start-Job -ScriptBlock {Get-Counter -Counter "\LogicalDisk(_Total)\% Free Space" -MaxSamples 1000} |
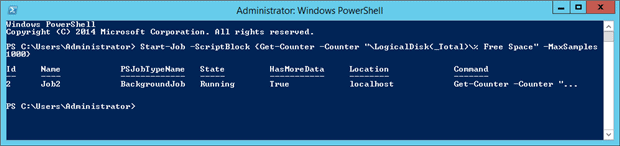
Figure9 – Jobs and counters
Then I only need to launch a Receive-Job to obtain the result of my command.
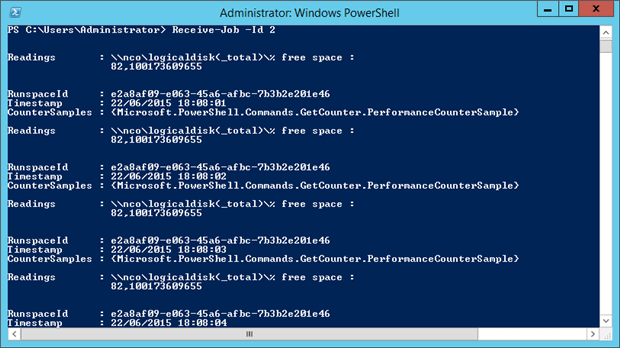
Figure10 – Receive-Job
So finally, let’s imagine that several processes are being performed on my server during the night and I wish to inspect the way that disk space has changed overnight when I need the data the following morning. I plan the job so that it begins at 1 am on the “Free Space” counter for all the disks:
|
1 2 3 4 5 |
$CheckFreeSpace = {Get-Counter -Counter "\LogicalDisk(_Total)\% Free Space" -MaxSamples 360 -SampleInterval 60 | Export-Counter -Path C:\CheckFreeSpace.csv -FileFormat CSV} $MyTrigger = New-JobTrigger -Daily -At 1am Register-ScheduledJob -Name "Check Free Space" -Trigger $MyTrigger -ScriptBlock $CheckFreeSpace |
You just have to run Get-ScheduledJob to get the status of this job. Then, the csv file will be created and you can inspect data into Microsoft Excel when it is done. I will explain later how to export results with Export-Counter.
Counters and Microsoft products
We can easily get performance counters from the more common Microsoft products.
Microsoft Exchange.
I can get the number of users connected on the Web Access with the following command:
|
1 |
PS > Get-Counter "\MSExchange OWA\Current Unique Users" -ComputerName CAS-Server |
I can also obtain the number of clients actually connected on my CAS server:
|
1 |
PS > Get-Counter "\MSExchange RpcClientAccess\User Count" -ComputerName CAS-Server |
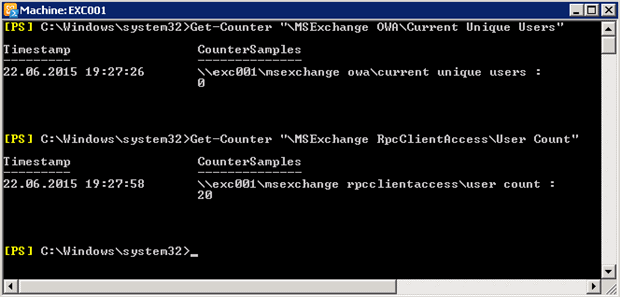
Figure11 – Exchange 2010 and counters
And finally the number of operations per second:
|
1 |
PS > Get-Counter '\MSExchange RpcClientAccess\RPC Operations/sec' |
System Center Operations Manager.
Here I wish to know the number of workflows running on my SCOM server:
|
1 |
PS > Get-Counter -ComputerName RMS-Server -Counter "\Health Service\Workflow Count" -SampleInterval 1 -MaxSamples 1 |
Note:A workflow, in this context, means a process being executed and launched by the SCOM agent.
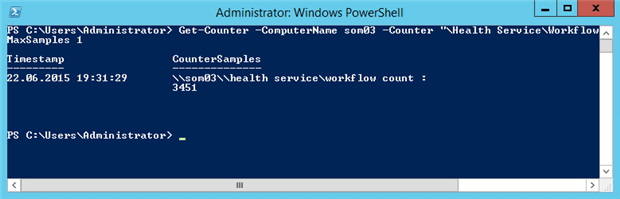
Figure12 – SCOM 2012 R2 and counters
Exporting data
At this point in the article, you have all you need to obtain the performance of your devices. To end this article on the counters, there is one more important thing to learn: the display of results in graphic forms. This will ease the reading and analysis. The command Export-Counter allows to create a file with the extension .BLG that may be read with the Windows Performance Monitor tool.
Let’s take the following example:
|
1 2 3 4 5 6 7 8 9 10 11 |
$CtrList = @( "\System\Processor Queue Length", "\Memory\Pages/sec", "\Memory\Available MBytes", "\Processor(*)\% Processor Time", "\Network Interface(*)\Bytes Received/sec", "\Network Interface(*)\Bytes Sent/sec", "\LogicalDisk(C:)\% Free Space", "\LogicalDisk(*)\Avg. Disk Queue Length" ) Get-Counter -Counter $CtrList -SampleInterval 5 -MaxSamples 5 | Export-Counter -Path C:\PerfExample.blg -FileFormat BLG -Force |
Note:The argument –Force allows to force the overwriting of the file if it already exists.
A file is thereby created with counters contained in $CtrList. This data may also be registered in CSV or TSV formats. You may then select or deselect counters to facilitate the reading of the graphics.
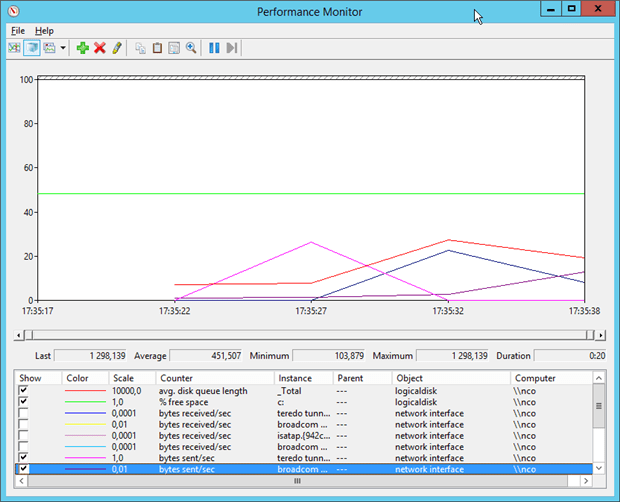
Figure13 – Performance Monitor
To go further
You may wish to create your own counters for very specific needs. There are a wide range of counters already provided for all sorts of requirements but the facility to add your own opens up all sorts of possibilities. You can use custom counters to instrument server-based processes such as ETL or even monitor the performance metrics of applications such as website transactions. You can really amuse yourself with this facility as it is very powerful, but you’ll need a good understanding of the mechanism.
Here is a simple example that you can build on.
In a first instance, I must define a few variables:
- The name of the category,
- an associated description “help”
- the type of category (simple instance or multiple instances).
Then I define two objects: one object of data collection that will contain one or several data objects.
Here is the creation of the category of counter: “My-Custom-Category”
|
1 2 3 4 5 6 |
MyDataCollection = New-Object System.Diagnostics.CounterCreationDataCollection $MyFirstData = New-Object System.Diagnostics.CounterCreationData $CatName = "My-Custom-Category" $CatHelp = "A Custom Performance object" $CatType = [System.Diagnostics.PerformanceCounterCategoryType]:MultiInstance |
That’s fine but the category is for the moment empty. It would be interesting to create counters in it. To do that I must create one or more PerformanceCounter objects that can take several arguments within its parameters. In my example, I indicate:
- the name of the category in which it will be created
- its type (See the possible types)
- a description
- and if I can modify it or not (True/False)
And finally, I give it a value with RawValue:
|
1 2 3 4 5 6 7 8 9 |
$MyFirstData.CounterName = "My-Custom-CounterName" $MyFirstData.CounterType = "NumberOfItems32" $MyFirstData.CounterHelp = "My first custom counter" $MyDataCollection.Add($MyFirstData) [System.Diagnostics.PerformanceCounterCategory]::Create($CatName, $CatHelp, $CatType, $MyDataCollection) $Counter1 = New-Object System.Diagnostics.PerformanceCounter($CatName, "My-Custom-CounterName", "My-Custom-Instance", $false) $Counter1.RawValue = 1024 |
See the complete example and comments for a more detailed understanding:
|
1 2 3 4 5 6 7 8 9 10 11 12 13 14 15 16 17 18 19 20 21 22 23 24 25 26 27 28 29 30 31 32 33 |
# We need two objects $MyDataCollection = New-Object System.Diagnostics.CounterCreationDataCollection $MyFirstData = New-Object System.Diagnostics.CounterCreationData # Variables for Counter Creation Data linked to $MyDataCollection $MyFirstData.CounterName = "My-Custom-CounterName" $MyFirstData.CounterType = "NumberOfItems32" $MyFirstData.CounterHelp = "My first custom counter" $MyDataCollection.Add($MyFirstData) # Variables for Performance Counter Category $CatName = "My-Custom-Category" $CatHelp = "A Custom Performance object" $CatType = [System.Diagnostics.PerformanceCounterCategoryType]::MultiInstance # Create performance counter category linked to $MyDataCollection [System.Diagnostics.PerformanceCounterCategory]::Create($CatName, $CatHelp, $CatType, $MyDataCollection) # Create my first counter with a counter name + instance name and if it's read-only or not? $Counter1 = New-Object System.Diagnostics.PerformanceCounter($CatName, "My-Custom-CounterName", "My-Custom-Instance", $false) # Set a value $Counter1.RawValue = 1024 # Check if "My-Custom-Category" exist ? (get-counter -listset "My-Custom-Category").paths # Now check the CookedValue Get-Counter -Counter "\My-Custom-Category(*)\My-Custom-CounterName" | Select-Object -ExpandProperty CounterSamples # And just check all the properties $counter1 |
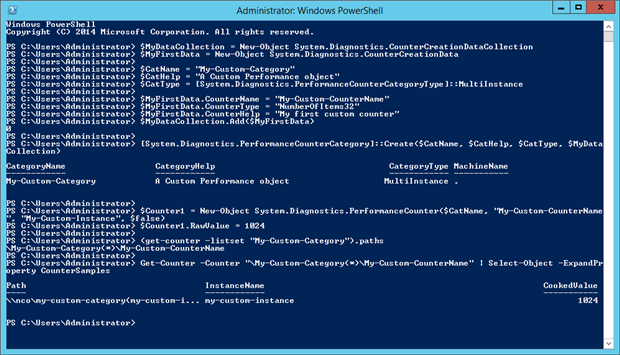
Figure14 – Full example of a created custom counter
Once your tests completed, you can delete the categories:
|
1 |
[System.Diagnostics.PerformanceCounterCategory]::Delete("$CatName") |
Note:You must close your PowerShell console so that the category will not be displayed.
Conclusion
Performance counters are the basic way of handling a vast range of measurements that you need in order to ensure that your servers are trouble-free. With the basic principles I’ve illustrated, you should be able to gather performance data for such performance categories as Disk, Processor, Memory, Hyper-V, SQL Server, Exchange and so on, for all your servers and devices. With custom counters, you will even be able to monitor the business processes within applications.
I suggest that you create different scripts for each category of counter. Then it will be simple to plan and execute them on demand on the list of devices you provide. I personally organize my counter-value-retrieving data scripts in this manner.
In the absence of a third-party monitoring tool that answers all your requirements, I find that performance counters are a very good approach to analyze the behavior of the devices. By using the Export-Counter command, I can execute a true analysis and also send comprehensible results to non-technical people.
The most difficult task, in my opinion, is to find out which counters are most relevant to your needs and thereby reduce reporting to the bare minimum. It is far too easy to obtain too much data on the devices and thereby increase the implementation time of your scripts. You can be sure that the time you spend in refining your performance-counter metrics will be gained tenfold when the time comes for you to analyze a critical situation on one of your servers, or spot an issue before it becomes a big problem. PowerShell is here to help you attend to detail with the minimum of effort..
This document contains proprietary information and is protected by copyright law.
Copyright © 2026 Red Gate Software Limited. All rights reserved
Load comments