
PowerShell Universal Dashboard (PoshUD) is a PowerShell module that creates web-based, real-time monitoring dashboards using only PowerShell code – no JavaScript, CSS, HTML, or C# required. You define monitors, charts, and layout using PowerShell cmdlets, and PoshUD renders them as a live web dashboard accessible from any browser. This article covers installing PoshUD, understanding the New-UDMonitor cmdlet, and building a functional multi-metric IT monitoring dashboard. PoshUD is built on ASP.NET Core, PowerShell Core, and ReactJS.
The series so far:
- Automating Day-to-Day PowerShell Admin Tasks – Part 1: Jobs and Workflow
- PowerShell Day-to-Day Admin Tasks – Part 2: WMI, CIM and PSWA
- PowerShell Day-to-Day Admin Tasks – Part 3: Monitoring Performance
- PowerShell Day-to-Day Admin Tasks – Part 4: Securing Scripts
- PowerShell Day-to-Day Admin Tasks – Part 5: Events and Monitoring
- PowerShell Day-to-Day Admin Tasks - Part 6: Real Time IT Dashboard
Understanding your system’s performance is a crucial part of running an IT infrastructure which is why I decided to add a new article to this series. Every sysadmin should be able to monitor their environment and should send reports or dashboards to the top management on a regular basis. Of course, you can build your own dashboards using a monitoring tool, but you don’t always have a PowerShell module to automate the management of these dashboards. Otherwise, you could also use other projects, for instance, to create a dashboard based on Power BI, but some prerequisites must be validated before using it and, unfortunately, it is not straightforward for beginners.
One of the first things I always think about before using a new product is that there must be a way to control this with PowerShell. This is not a prerequisite, but it could save me a lot of time in the future. Creating a dashboard should be also done using PowerShell to dynamically create a dashboard based on some criteria. For instance, you might want to create a dashboard every morning at 07:00 AM that will list all your machines that are not up and running. Or you might want to create a dashboard that will:
- List the top 10 machines for whom the CPU is greater than 90%,
- List toner levels for printers
- And anything else you can think of…
Of course, you can do this with a monitoring tool, but are you able to automate the whole creation process? Wouldn’t it be interesting to be able to launch a simple PowerShell script with several arguments and create a new dashboard on demand? In this case, every admin would be able to create a dashboard even if they don’t have PowerShell skills.
I will try to convince you without further explanation. So please run the following PowerShell commands as an administrator:
|
1 2 3 4 5 6 |
PS > Install-Module UniversalDashboard -Force PS > Install-Script -Name server-performance-dashboard PS > server-performance-dashboard.ps1 Name Port Running ---- ---- ------- Dashboard0 10000 True |
The Install-Script cmdlet acquires the script from the PowerShell Gallery, verifies that the script is a valid PowerShell script, and copies the script file to the default installation location, which is: C:\Program Files\WindowsPowerShell\Scripts.
Now, open your favorite web browser, and type the following URL: http://localhost:10000. That’s all; your first PowerShell Dashboard is up and running! Nothing more to do. Below is the output on my Windows 10 laptop:
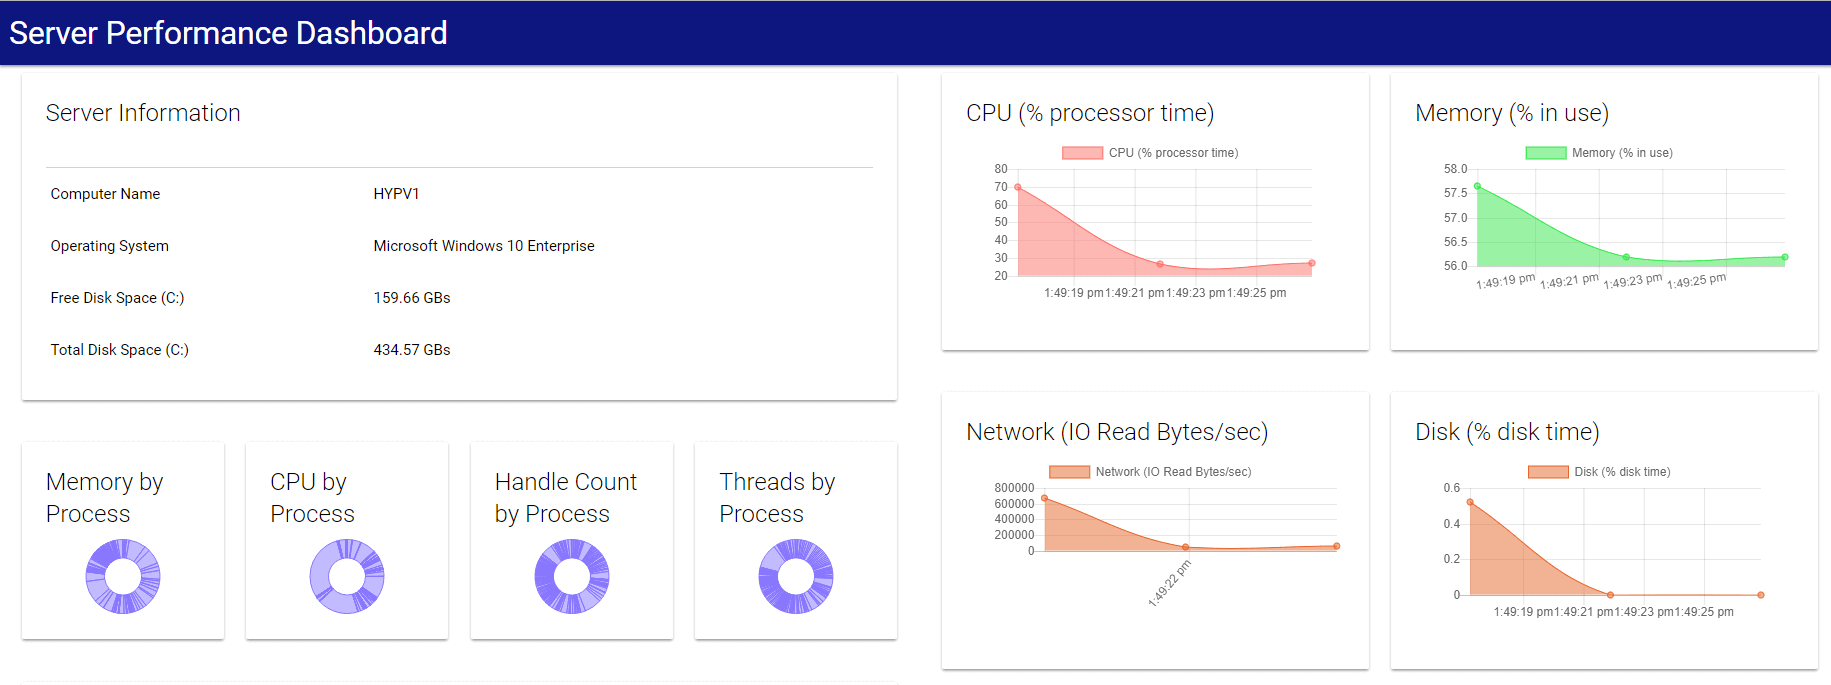
If you launch this dashboard, you will notice that on the right side of the dashboard, the charts should auto-refresh every 5 seconds. This dashboard has been generated using PowerShell Universal Dashboard.
What is the PowerShell Universal Dashboard (PoshUD)?
PoshUD was created by Adam Driscoll and has been out since September 2017. In my opinion, it does not have many downloads despite the amazing potential of this tool. I think this module should be more popular, so I will demonstrate the ease of use of this tool and show you step-by-step how to build a real-time PowerShell dashboard for your daily tasks. PoshUD is an extremely powerful data and visualization tool. It is a cross-platform PowerShell module for developing and hosting web-based, interactive dashboards. It means that you can use your PowerShell skills to develop awesome dashboards very easily.
What about PowerShell Core? PoshUD is fully compatible with PowerShell Core, so, as you can probably imagine, it means that you can create a cross-platform dashboard and monitor Windows machines and Linux machines on the same dashboard.
Before going deeper with PoshUD, you must know that PoshUD is not free. But don’t panic because the pricing is very interesting. As of the 1.5.3 release, PoshUD is licensed per server and includes free upgrades for a year. When you will run your first dashboard, it will be unlicensed, and you will be able to run it for one hour. To run past the one hour time limit, you will be prompted to buy a license. Server licenses are available for purchase for $99.99 per server and are perpetual. If you want to use PoshUD for an open source project, contact directly Adam Driscoll to discuss the license terms.
How to Use PoshUD?
Universal Dashboard is built on ASP.NET Core, PowerShell Core, ReactJS and some JavaScript libraries but you don’t need to learn JavaScript, CSS, HTML or C#. You just have to use PowerShell to produce a dashboard. First, you can check the available commands:
|
1 2 3 4 5 6 7 8 9 10 11 12 13 14 15 16 17 18 19 20 21 |
PS > Get-Command -Module *Dashboard* CommandType Name Version Source ----------- ---- ------- ------ Function Get-UDContentType 1.5.0 UniversalDashboard Function Get-UDCookie 1.5.0 UniversalDashboard Function New-UDBarChartDataset 1.5.0 UniversalDashboard Function New-UDBarChartOptions 1.5.0 UniversalDashboard Function New-UDCategoryChartAxis 1.5.0 UniversalDashboard […] Output has been truncated Cmdlet New-UDMonitor 1.5.0 UniversalDashboard Cmdlet New-UDPage 1.5.0 UniversalDashboard Cmdlet New-UDRow 1.5.0 UniversalDashboard Cmdlet New-UDTable 1.5.0 UniversalDashboard Cmdlet New-UDTheme 1.5.0 UniversalDashboard Cmdlet Remove-UDElement 1.5.0 UniversalDashboard Cmdlet Set-UDElement 1.5.0 UniversalDashboard Cmdlet Set-UDLicense 1.5.0 UniversalDashboard Cmdlet Start-UDDashboard 1.5.0 UniversalDashboard Cmdlet Start-UDRestApi 1.5.0 UniversalDashboard Cmdlet Stop-UDDashboard 1.5.0 UniversalDashboard Cmdlet Stop-UDRestApi 1.5.0 UniversalDashboard |
Dashboards are made up of components. A dashboard is composed of one or more pages with any number of components on those pages. These components can be:
- Charts: Charts can be bar, line, doughnut or pie.
- Grids: Grids output data similar to tables but allow for paging and sorting the data in the grid.
- Formatting: Layouts provide a simple way to format dashboards into columns and rows.
- Inputs: Inputs allow you to take user input.
- Monitors: Monitors are special charts that track data over time.
- Pages: Dashboards can be split into multiple pages.
- Tables: Tables are simple controls that output data in an HTML table
- Customs: Custom Components can ship as modules or simple PS1 scripts.
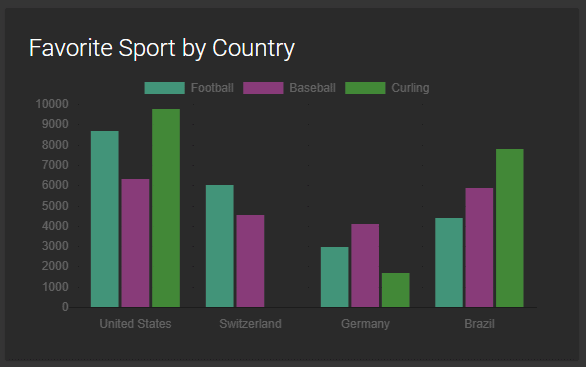
Below are some component examples:
If you need help or just more information, you can use the get-help cmdlet:
|
1 |
PS > Get-Help New-UDDashboard |
Moreover, an essential concept is called Endpoints which are PowerShell Script Blocks. Endpoints properties are executed when data is requested by the client. The Endpoint parameter’s script block is called whenever a user visits the website, or the Endpoint refreshes its data. Endpoints can also call any PowerShell script to retrieve data.
Note that you can host your dashboard locally, in Azure or on your IIS server. The following code will create a very simple dashboard:
|
1 2 3 4 |
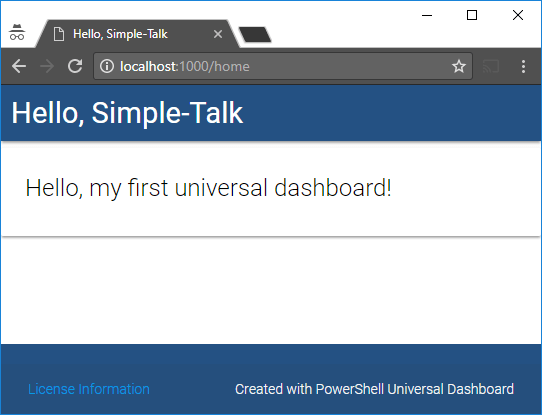
$MyDashboard = New-UDDashboard -Title "Hello, Simple-Talk" -Content { New-UDCard -Title "Hello, my first universal dashboard!" } Start-UDDashboard -Port 1000 -Dashboard $MyDashboard -Name 'HelloDashboard' |
At this time, your machine is a stand-alone server and your dashboard runs on the port number that you indicate. In this case, you can access the dashboard with this URL: http://localhost:1000/
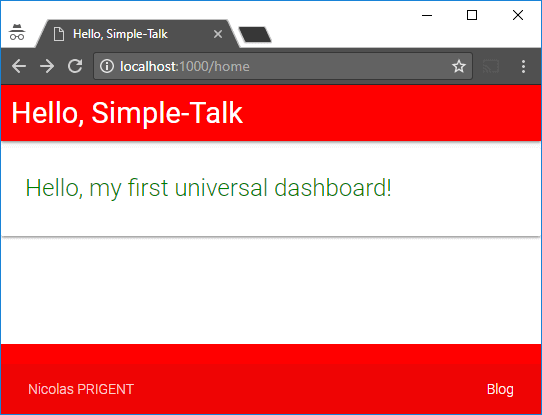
Note: You can run multiple dashboards per server as long as they listen on different ports. The dashboards are highly customizable. You can modify the dashboard to add some colors and run it once again:
|
1 2 3 4 5 6 7 8 |
#Content dashboard $Link = New-UDLink -Text 'Blog' -Url 'http://www.get-cmd.com' $Footer = New-UDFooter -Copyright 'Nicolas PRIGENT' -Links $Link $MyDashboard = New-UDDashboard -Title "Hello, Simple-Talk" -NavBarColor 'red' -NavBarFontColor 'blue' -FontColor 'Green' -Footer $Footer -Content { New-UDCard -Title "Hello, my first universal dashboard!" } #Create the dashboard Start-UDDashboard -Port 1000 -Dashboard $MyDashboard -Name 'ContentDashboard' |
Error! As I said just before, you cannot run the dashboard because it is already in use on the same port.
Start-UDDashboard : Failed to bind to address http://0.0.0.0:1000: address already in use.
At line:5 char:1
+ Start-UDDashboard -Port 1000 -Dashboard $MyDashboard
+ ~~~~~~~~~~~~~~~~~~~~~~~~~~~~~~~~~~~~~~~~~~~~~~~~~~~~
    + CategoryInfo : NotSpecified: (:) [Start-UDDashboard], IOException
    + FullyQualifiedErrorId : System.IO.IOException,PowerShellProTools.UniversalDashboard.Cmdlets.StartDashboardCommand
You must stop the dashboard and run it once again. Check to see if the dashboard is still running with the Get-UDDashboard cmdlet:
|
1 2 3 4 |
PS > Get-UDDashboard Name Port Running ---- ---- ------- HelloDashboard 1000 True |
You can stop the dashboard with the Stop-UDDashboard cmdlet:
|
1 2 |
PS > Get-UDDashboard -Name HelloDashboard | Stop-UDDashboard PS > Get-UDDashboard |
After re-running the dashboard, notice the changes:
If you want to refresh your dashboard, there are two options. You can kill your dashboard and then start it again:
|
1 2 3 4 5 6 |
#Refresh the dashboard Get-UDDashboard -Name 'ContentDashboard' | Stop-UDDashboard #Content dashboard […] #Create the dashboard Start-UDDashboard -Port 1000 -Dashboard $MyDashboard -Name 'ContentDashboard' |
Or you can save your commands in a single script named myDashboard.ps1 and add the –AutoReload parameter. This will restart the server as soon as there is a change in myDashboard.ps1. Open your favorite PowerShell IDE with the page http://localhost:1000 running in the background. Simply modify your code, save your script and the running dashboard will refresh automatically
|
1 2 |
#Create the dashboard Start-UDDashboard -Port 1000 -Dashboard $MyDashboard -Name 'ContentDashboard' -AutoReload |
Note: The –AutoReload parameter only works in a script and does not work in command line.
Create a Functional Dashboard
Adding a monitor to your dashboard definition is simple. Use the New-UDMonitor cmdlet followed by these parameters:
- Title: This parameter displays a title on your monitor
- Type: This parameter allows for Bar and Line chart
- Endpoint: This parameter contains your PowerShell command. The results are displayed on your monitor
To display your monitor, you must ‘pipe’ the New-UDMonitor to the Out-UDMonitorData cmdlet. Below is the syntax:
New-UDMonitor -Title “My Title” -Type Line -Endpoint {
Your PowerShell Command Here | Out-UDMonitorData
}
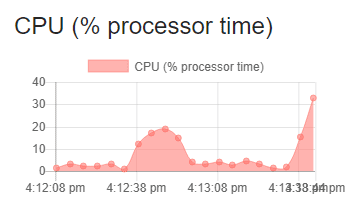
For example, if you wanted to monitor Network I/O, the Endpoint would be
Endpoint {Get-Counter ‘\Process(_Total)\IO Read Bytes/sec’ }
For more information on monitors, you can use the help:
|
1 |
PS > Get-Help New-UDMonitor –Full |
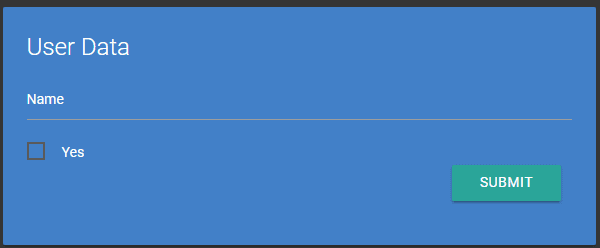
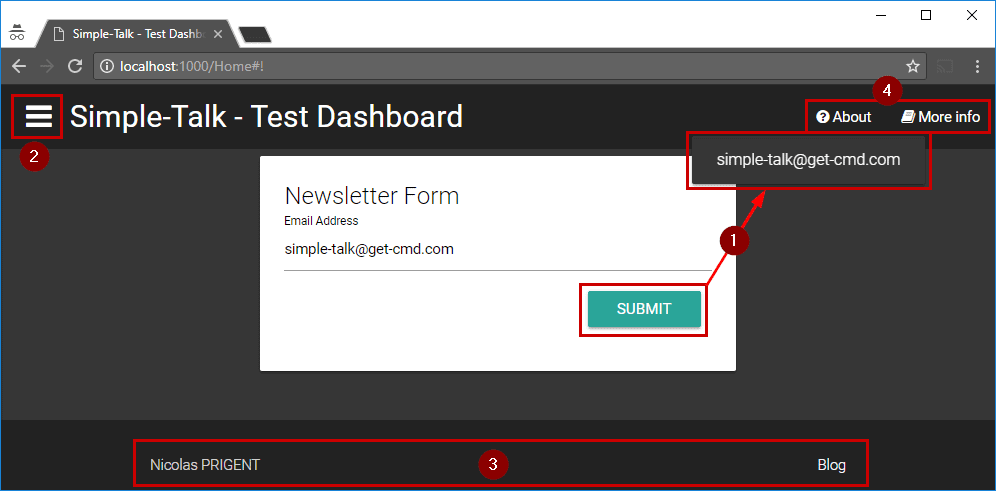
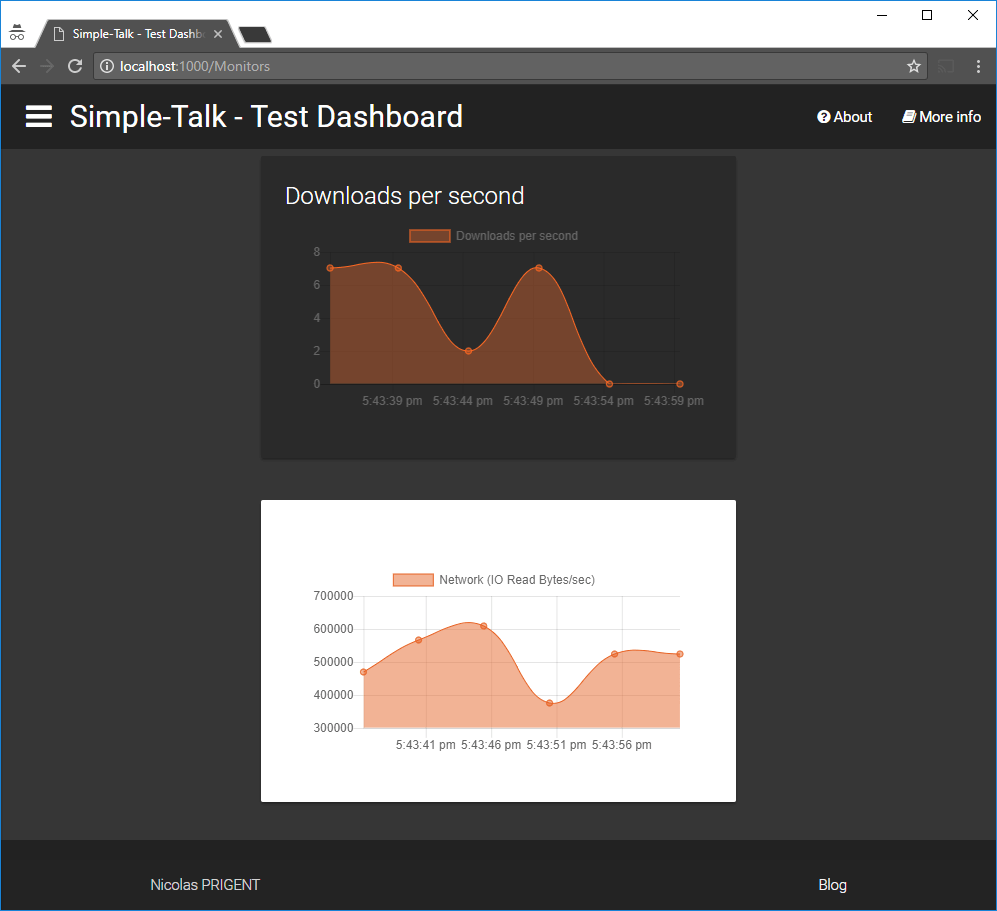
Now, you will create a second page in your dashboard. The first one will be the home page with a form for newsletter registration, and the second one will display some monitors in real-time.
Below is the full example:
|
1 2 3 4 5 6 7 8 9 10 11 12 13 14 15 16 17 18 19 20 21 22 23 24 25 26 27 28 29 30 31 32 33 34 35 36 37 38 39 40 41 42 43 44 45 46 47 48 49 50 51 52 53 54 55 56 57 |
#Refresh the dashboard Get-UDDashboard -Name 'ContentDashboard' | Stop-UDDashboard #Content dashboard $Link = New-UDLink -Text 'Blog' -Url 'http://www.get-cmd.com' $Footer = New-UDFooter -Copyright 'Nicolas PRIGENT' -Links $Link $NavBarLinks = @((New-UDLink -Text "About" -Url "http://get-cmd.com/?author=2" -Icon question_circle), (New-UDLink -Text "More info" -Url "http://www.google.com" -Icon book)) $HomePage = New-UDPage -Name "Home" -Icon home -Content { New-UDRow -Columns { New-UDColumn -Size 3 -Content { } New-UDColumn -Size 6 -Content { New-UDInput -Title "Newsletter Form" -Id "Form" -FontColor 'Black' -Content { New-UDInputField -Type 'textbox' -Name 'Email' -Placeholder 'Email Address' } -Endpoint { param($Email) New-UDInputAction -Toast $Email } } } } $Monitor = New-UDPage -Name "Monitors" -Icon link -Content { New-UDRow -Columns { New-UDColumn -Size 3 -Content { } New-UDColumn -Size 6 -Content { New-UDMonitor -Title "Downloads per second" -Type Line -Endpoint { Get-Random -Minimum 0 -Maximum 10 | Out-UDMonitorData } -ChartBackgroundColor '#59FF681B' -ChartBorderColor '#FFFF681B' -BackgroundColor "#252525" -FontColor "#FFFFFF" } } New-UDRow -Columns { New-UDColumn -Size 3 -Content { } New-UDColumn -Size 6 -Content { New-UdMonitor -Title "Network (IO Read Bytes/sec)" -Type Line -DataPointHistory 20 -RefreshInterval 5 -ChartBackgroundColor '#80E8611D' -ChartBorderColor '#FFE8611D' -Endpoint { Get-Counter '\Process(_Total)\IO Read Bytes/sec' -ErrorAction SilentlyContinue | Select-Object -ExpandProperty CounterSamples | Select-Object -ExpandProperty CookedValue | Out-UDMonitorData } } } New-UDRow -Columns { New-UDColumn -Size 3 -Content { } New-UDColumn -Size 6 -Content { New-UDChart -Title "Threads by Process" -Type Doughnut -RefreshInterval 5 -Endpoint { Get-Process | ForEach-Object { [PSCustomObject]@{ Name = $_.Name; Threads = $_.Threads.Count } } | Out-UDChartData -DataProperty "Threads" -LabelProperty "Name" } -Options @{ legend = @{ display = $false } } } } } #Create the dashboard Start-UDDashboard -Content { New-UDDashboard -NavbarLinks $NavBarLinks -Title "Simple-Talk - Test Dashboard" -NavBarColor '#FF1c1c1c' -NavBarFontColor "#FF55b3ff" -BackgroundColor "#FF333333" -FontColor "#FFFFFFF" -Pages @( $HomePage, $Monitor ) -Footer $Footer } -Port 1000 -Name 'ContentDashboard' |
Now to examine the dashboard:
- The simple form will wait for an input from the user. When the user enters an email address, a toast will be created and will display the value. The toast will disappear very quickly, but you can add the –Duration parameter to increase this time.
- A new icon appears on the top left corner. It is called the Hamburger menu icon and will help you to switch between your pages in your dashboard.
- The footer will display some legal information such as a disclaimer or whatever you want.
- The navbar menu displays some useful links such a documentation.
You can navigate between the first page and the second page by expanding the Hamburger menu.
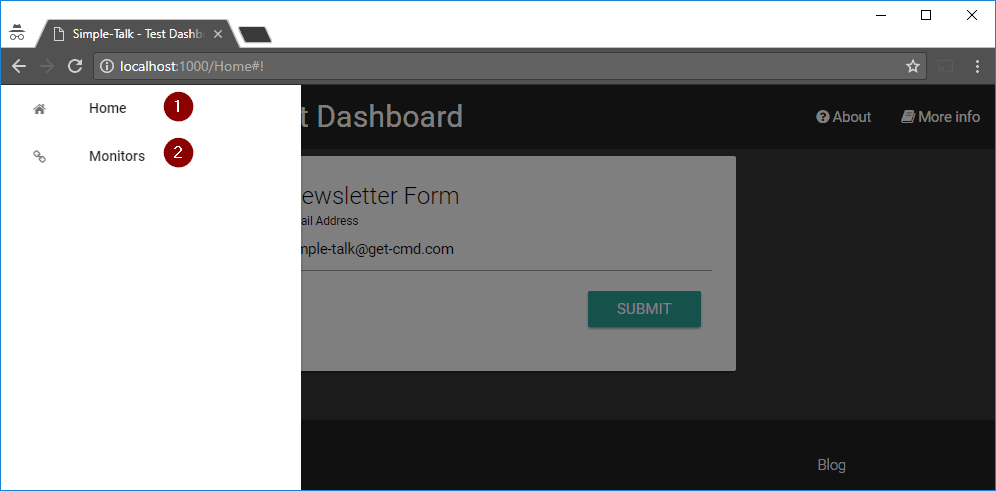
On the second page, you can see the monitors in real-time.
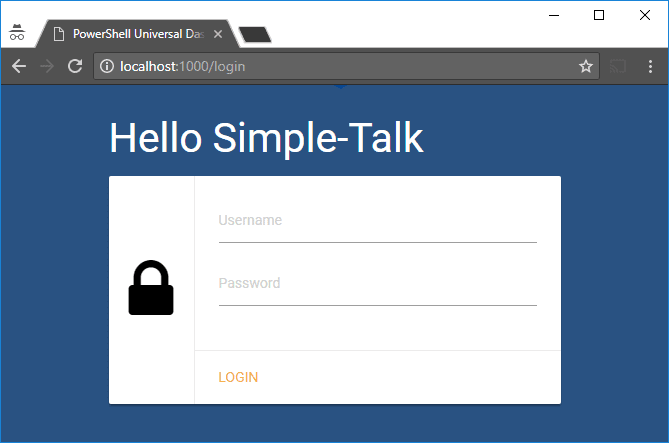
You can customize your dashboards as much as you want. It would be impossible to explain all the components in this article but note that you can create REST APIs or add a login page very easily and force https access to your dashboard. Use the New-UDLoginPage and New-UDAuthenticationMethod cmdlets:
On top of that, PoshUD is updated on a very regular basis, so do not forget to update the module to get the latest features added by Adam. To finish, note that you can check your license by running the Get-UDLicense cmdlet.
Conclusion
Keep in mind that PowerShell Universal Dashboard is a new tool, but I never noticed any bugs or strange behaviors. This module will help you to save a lot of time and easily create dashboard to monitor your infrastructure. You can create a very simple dashboard to quickly save time in your day-to-day task or create very complex dashboards if you wish. You also can run PoshUD in a Docker Container which is cool!
You can see more PowerShell Dashboard examples created by the community here. If you need more help, you can read the official documentation. There are more and more examples on internet to help you to create your dashboards.
Finally, I would like to congratulate Adam for his awesome work. This module will help many sysadmins, so please give a try to this tool, at least to test the potential of this module. I hope this article will help this tool to be more popular.
FAQs: PowerShell Day-to-Day Admin Tasks – Part 6: Real-Time IT Dashboard
1. What is PowerShell Universal Dashboard (PoshUD)?
PowerShell Universal Dashboard, or PoshUD, is an open-source PowerShell module that generates live web dashboards using PowerShell cmdlets. It runs as an ASP.NET Core web server in the background and renders dashboards using ReactJS. You write all dashboard definitions in PowerShell – adding monitors, charts, gauges, and tables – and access the dashboard through a browser at localhost or a configured URL. No web development skills are required.
2. How do I create a real-time monitoring dashboard with PowerShell?
Install the UniversalDashboard module from the PowerShell Gallery (Install-Module UniversalDashboard). Create a dashboard definition using New-UDDashboard, add monitors with New-UDMonitor (which accepts a PowerShell script block that returns metric values), and start the dashboard server with Start-UDDashboard. The dashboard polls each monitor’s script block at a configurable interval and updates the display in real time.
3. Is PowerShell Universal Dashboard free?
PoshUD was originally open-source and free. The project has since evolved – Universal Dashboard is now part of the PowerShell Universal platform by Ironman Software, which has both free community and paid licensed versions. For production IT monitoring dashboards, check the current licensing terms at ironmansoftware.com. The community edition provides the core dashboard functionality covered in this article.
4. Can I use PowerShell Universal Dashboard to monitor SQL Server?
Yes. Any metric that PowerShell can query can be displayed in a PoshUD dashboard. For SQL Server monitoring, use Invoke-SqlCmd or a .NET SqlConnection within a New-UDMonitor script block to query DMVs, wait stats, or custom queries, and return the values as dashboard metrics. Combined with the SQL Server monitoring capabilities in other articles in the PowerShell Day-to-Day Admin Tasks series, PoshUD is a practical tool for self-hosted SQL Server dashboards.
This document contains proprietary information and is protected by copyright law.
Copyright © 2026 Red Gate Software Limited. All rights reserved
Load comments