

Multiple tools are available for working with Azure Database for PostgreSQL flexible server. One of these is the psql command-line utility, which I introduced you to in the previous article in this series. Another valuable tool is pgAdmin, a much more robust product. It provides a graphical user interface (GUI) for managing and querying PostgreSQL instances, including ADP flexible server. The tool enables DBAs, developers, and other users to easily interact with their ADP instances, while providing intuitive features for working with databases and their data.
If you’ve used SQL Server Management Studio to work with SQL Server, you’ll find many similar features in pgAdmin. For example, you can easily navigate database objects or quickly modify those objects in a few steps. The pgAdmin interface enables you to perform a wide range of tasks using simple point-and-click operations. You can also create and execute scripts, as well as run individual SQL statements. In addition, pgAdmin includes a built-in version of the psql tool, making it easy to switch between the GUI environment and a command-line interface, all within a single window.
As with any tool, the best way to learn about pgAdmin is through hands-on experience. To help you get started, this article explains numerous features in pgAdmin and demonstrates their use. You’ll learn how to define a connection to an ADP instance and navigate the server and database object hierarchy. You’ll also learn how to create database objects and how to launch a query window and run SQL statements. In addition, I’ll demonstrate how you can launch psql so you can work from the command line within the pgAdmin window.
Note: To follow along with the examples in this article, you need to have a running ADP instance and know the necessary connection information, including the full endpoint name, port number, user name, password, and target database. If you haven’t set up ADP yet, refer to the first article in this series.
How to install pgAdmin on your system
Before you can use pgAdmin to connect to ADP flexible server, you must install it on your computer. You can run pgAdmin on Windows, macOS, and Linux computers, as well as in Docker containers. The installation process will depend on the platform you choose. The best place to start is by going to the pgAdmin Download page, which provides the information you need for installing pgAdmin on different systems.
To prepare for this article, I installed pgAdmin on my Mac, which was a very straightforward process. I clicked the macOS link on the Download page, and downloaded the .dmg installation file for the latest pgAdmin release, which is currently version 9.4. I then opened the file to launch the installation process and followed the prompts. Once that was complete, I opened pgAdmin and was ready to go.
Step-by-step guide to connecting pgAdmin to Azure PostgreSQL flexible server
When you first launch pgAdmin, you’re presented with two main sections, as shown in the following figure. The left section is a pane that contains Object Explorer. This is where you’ll navigate the object hierarchy after you’ve connected to a PostgreSQL instance. Initially, it includes only the Servers node:
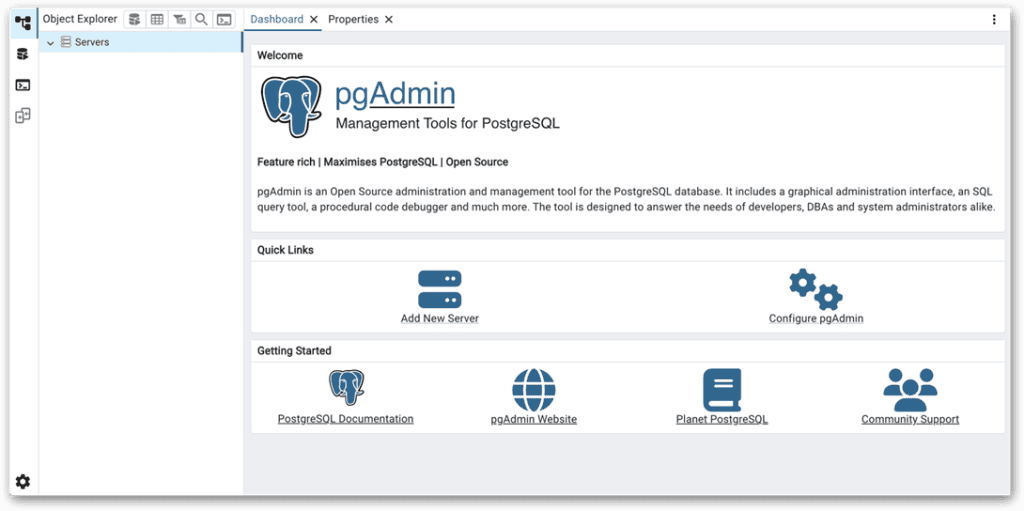
The right section is the main window where you’ll carry out many of your operations. When you open pgAdmin, the window contains only the Dashboard tab and Properties tab. The Dashboard tab provides links for connecting to a server instance and for configuring pgAdmin. It also provides links to additional information. The Properties tab contains object properties. However, it will show few details at this point. As with Object Explorer, you need to connect to a PostgreSQL instance before you can view any meaningful information.
To connect to your ADP instance, click the Add New Server link on the Dashboard tab. This will launch the Register – Server dialog box, where you can enter the connection information for your ADP instance. This is the same information you used in the previous article when establishing a connection in psql. The following figure shows the General tab in the Register – Server dialog box, where you should enter a name for your connection. I named my connection adp:
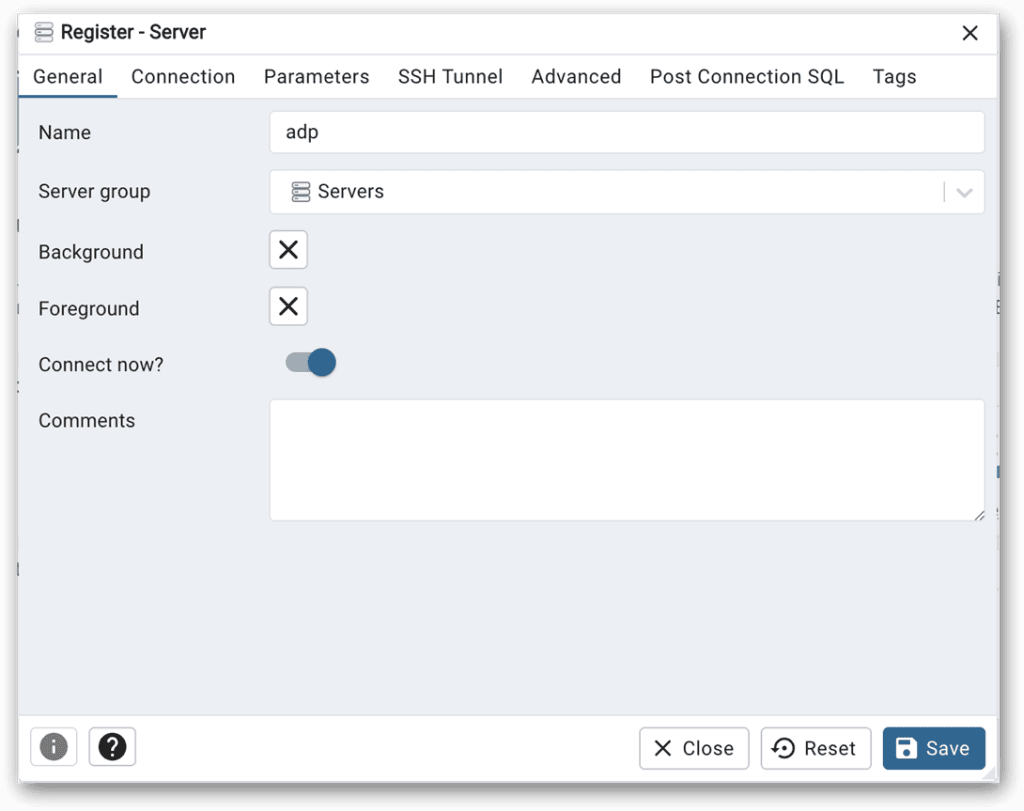
For now, you can leave all the other options on the General tab at their default values. Next, go to the Connection tab and configure the following settings:
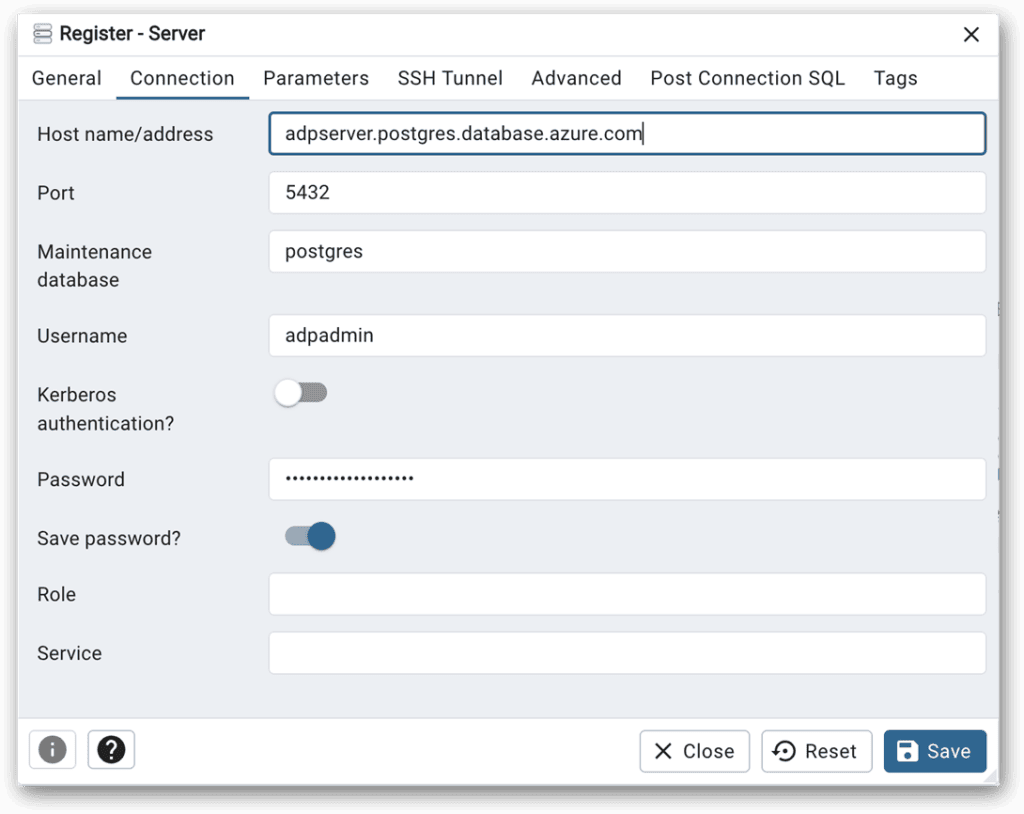
- Host name/address. Specify the address that Azure generated for your ADP instance. For my instance, I used adpserver.postgres.database.azure.com.
- Port. Use port 5432 for your ADP instances.
- Maintenance database. Use the default database, postgres, for this connection. You can still work with other databases after you connect to your ADP instance.
- Username. Enter the PostgreSQL administrative account name you specified when you created your ADP instance. For my ADP instance, I created the adpadmin account.
- Password. Enter the password for the PostgreSQL administrative account.
- Save password. Enable this option if you don’t want to be prompted for a password every time you connect to the server instance.
You can leave the other options at their default values for now. The following figure shows the Connection tab after I configured it on my system. Once you’ve configured all the options, click Save to create the connection and connect to your ADP instance:
After you’re connected to your ADP instance, you can access the server and database objects in Object Explorer and carry out a wide range of other tasks. For example, you can create databases and their tables, add data to those tables, and retrieve and modify that data.
Note. The pgAdmin documentation sometimes refers to Object Explorer as Tree Control. For this article and those to follow, I’ll stick with Object Explorer because that is the name used in the interface.
Navigating Object Explorer in pgAdmin
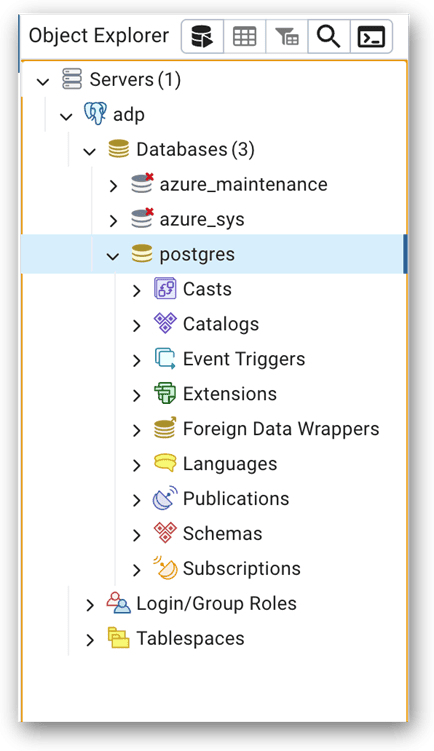
When you connect to your ADP instance, the connection you defined is listed as a subnode beneath the Servers node in Object Explorer. For example, I named my connection adp, so after I connected to my ADP instance, Object Explorer listed the adp subnode under the Servers node, as shown in the following figure:
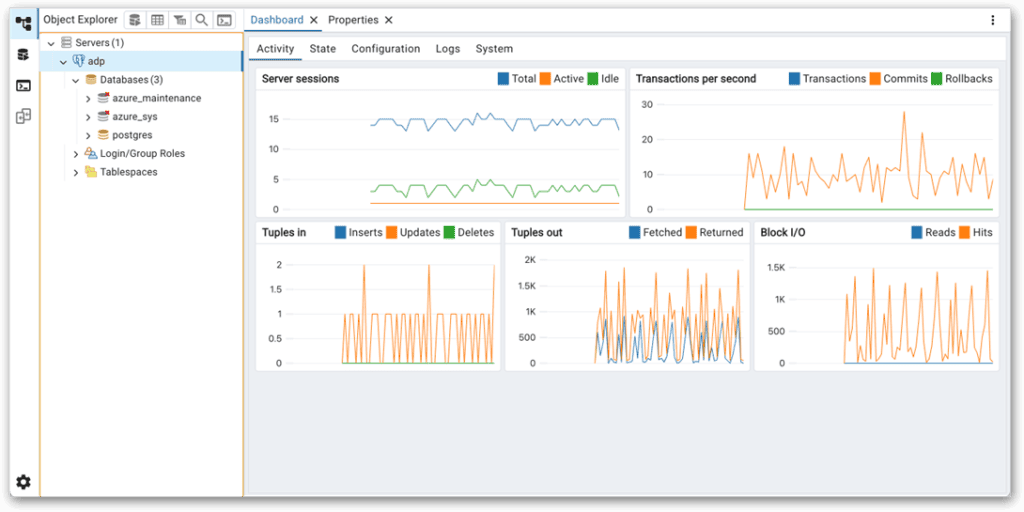
In this figure, the adp connection is expanded to display the three top-level categories in the server’s object hierarchy:
- Databases. The system and user databases that currently exist on your PostgreSQL instance. When you first create an ADP instance, PostgreSQL creates the following three databases: azure_maintenance, azure_sys, and postgres. The node does not show the template databases.
- Login/Group Roles. The user and group roles that are defined at the cluster level. These are shared by all databases in the cluster. Here you can manage them and assign privileges and memberships. We’ll be digging more deeply into user and group roles later in the series.
- Tablespaces. The tablespaces that are defined on the server instance. A tablespace is an alternative storage location on the filesystem for storing database objects such as tables and indexes.
The Databases node in the figure is also expanded to show the three databases. In all likelihood, you’ll be spending the majority of your time working with the Databases node, where you can access the objects specific to each database. For example, if you expand the postgres node, you can drill down into the various subnodes, such as Catalogs, Event Triggers, Extensions, and Schemas, as shown in the following figure:
Managing databases and schemas in pgAdmin
As we work through this series, we’ll be digging into the different object types in more detail, but for now, let’s focus on the Schemas node, which is where you’ll find the database tables.
Note. At the top of Object Explorer, you’ll see a set of icons for quickly accessing database tools such as the Query Tool or PSQL Tool, which we’ll be getting to shortly. The tools are available only if you’ve selected a database node or one of its subnodes in Object Explorer.
When a database is added to an ADP instance, the service creates the public schema, which serves as the default schema when adding tables or other database objects. The ADP service might also add other schemas. For example, the service creates both the cron and public schemas for the postgres database, as shown in the following figure. The cron schema is used to store metadata related to scheduled jobs. You can also create your own schemas for organizing database objects:
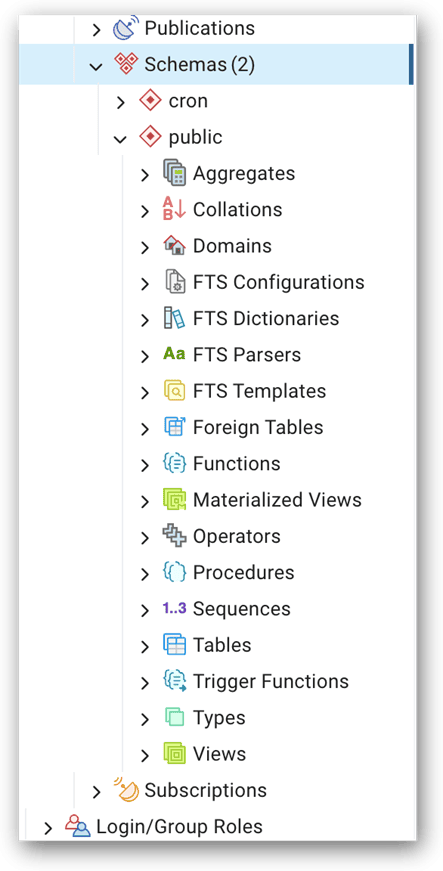
The figure also shows the public schema node expanded. When you expand a schema, you can drill into the object nodes associated with that schema, such as Aggregations, Collations, Sequences, and Tables. Once again, I’ll be spending more time on these concepts as we progress through this series. Just know that if you create any objects in the public schema, they will be listed in their associated node. For example, if you add a table to the public schema in the postgres database, it will be listed beneath the Tables node.
When you connect to a PostgreSQL instance, the Dashboard tab displays multiple panels, with the Activity panel selected by default, as shown in the following figure. The Activity panel displays graphs that provide real-time information about current server or database activity, based on the node selected in Object Explorer. In this case, the adp connection node is selected, so the activity reflects the entire server instance. If you were to select a database in Object Explorer, the graphs would be specific to that database:
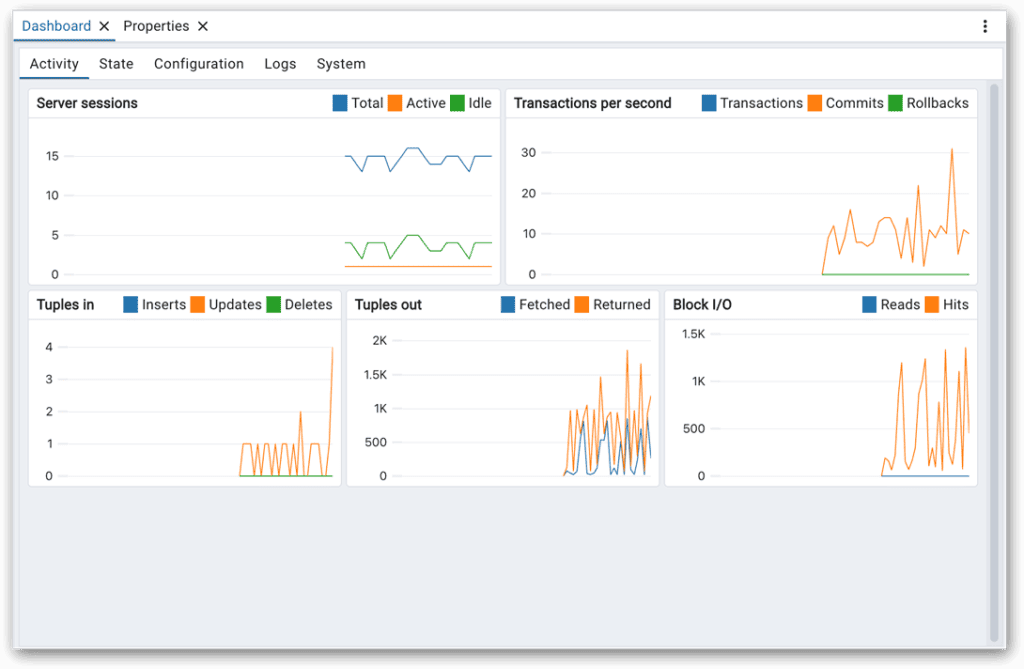
In addition to the Activity panel, the Dashboard tab includes four other panels:
- State. Provides details about sessions, locks, and prepared transactions. The information is specific to the node selected in Object Explorer.
- Configuration. Displays the current server configuration settings.
- Logs. Lists the server logs. You must be granted permission to the pg_stat_file function to view the logs. I’ll be discussing permissions and logging later in this series.
- System. Displays system statistics about the CPU, memory, and storage resources. To view the statistics, the system_stats extension must be installed. I’ll be discussing extensions later in this series.
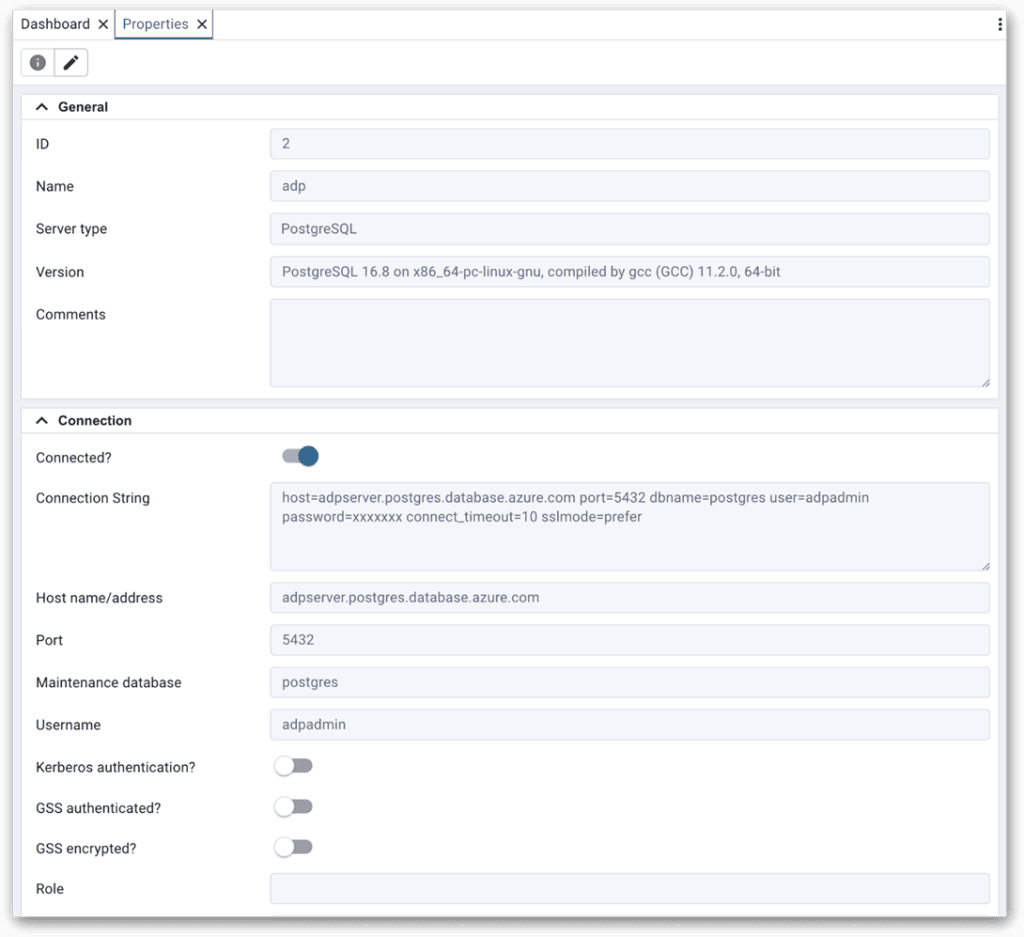
The main pgAdmin window also includes the Properties tab, which displays the property settings for the node selected in Object Explorer. For example, the following figure shows the properties for the adp connection, which is selected in Object Explorer. If a different object were selected, the properties would be specific to that.
The pgAdmin interface also lets you configure settings (preferences) for the tool’s environment. To access the settings, click the Settings button in the bottom left corner of the pgAdmin interface. This will launch the Preferences dialog box, shown in the following figure:
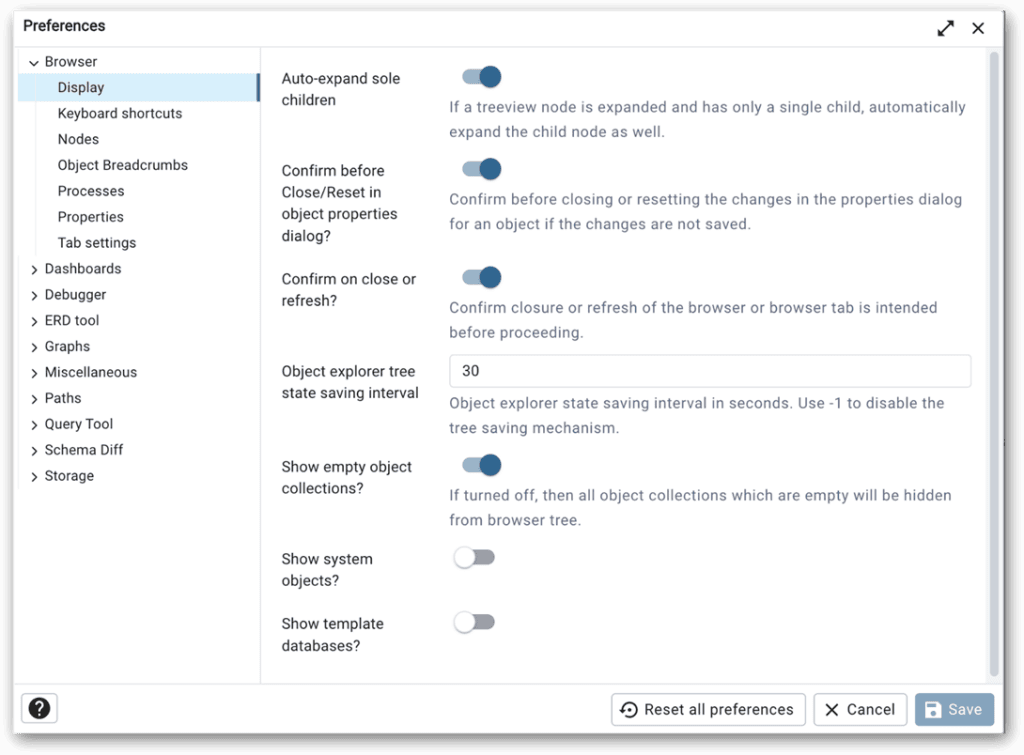
The settings are organized into multiple categories, such as Browser, Debugger, Query Tool, and Storage. Each category contains a set of related configuration subcategories, and each subcategory contains a set of related settings that you can configure for your environment.
Using the pgAdmin GUI to create database objects
The pgAdmin interface provides point-and-click capabilities for creating database objects and working with data. Many DBAs and other advanced users will likely focus more on running SQL scripts and other commands directly, rather than using GUI features, but it is still a good idea to be familiar with these options.
For example, you can use point-and-click features to create a table in the postgres database. To create a table, drill down to Databases > postgres > Schemas > public > Tables in Object Explorer. Right-click the Tables node and click Create > Table. This will launch the Create – Table dialog box, with the General tab selected, as shown in the following figure:
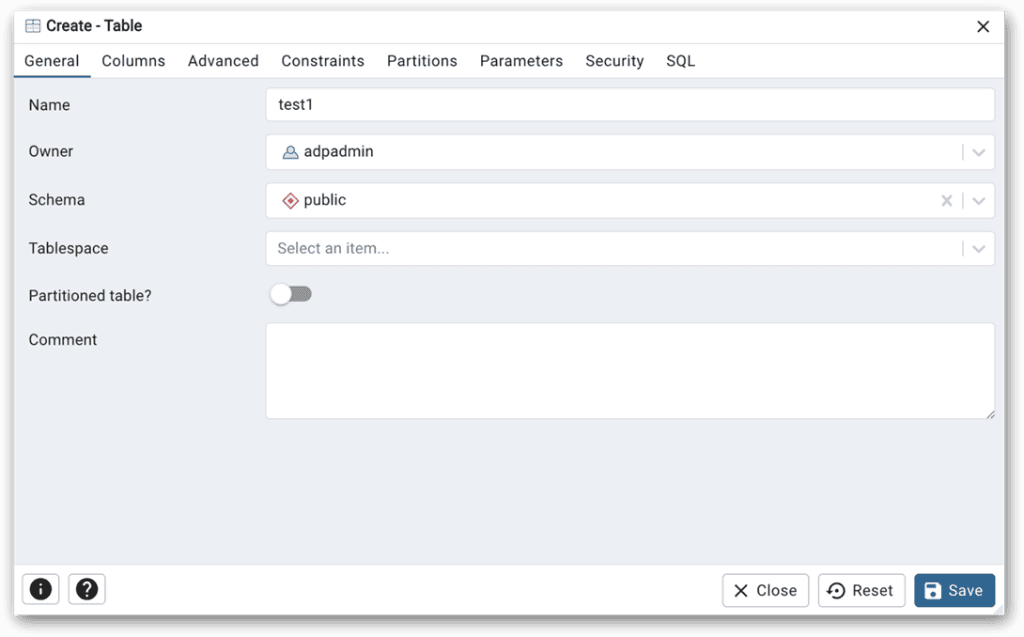
I’ve already provided a name for the table (test1), but you can use a different name. I’ve also left all the other options with their default settings, which you don’t need to be concerned with at this point.
Next, go to the Columns tab and define a couple of columns. For example, the following figure shows the two columns I defined—col1 and col2—which are configured with the smallint and text data types, respectively. To add a column, click the plus sign near the upper right corner. This adds a row, where you can fill in the necessary details. For this example, I kept it simple and provided only the column names and data types:

Once you’ve defined your table, click the Save button. PostgreSQL will then add the table to the database and list it beneath the Tables node in Object Explorer. To delete the table, right-click it in Object Explorer and click Delete. When prompted to confirm your deletion, click Delete again.
You can do a lot more with the GUI capabilities in pgAdmin, such as create other objects, return a table’s data, or import or export data. Most operations are fairly intuitive. I suggest that you try out different GUI capabilities to get a better sense of what you can do.
Running SQL queries using pgAdmin’s Query Tool
One of the handiest features in pgAdmin is Query Tool, which you can use to run SQL statements and SQL scripts against your ADP server instance. You must launch the tool within the context of a specific database. It will then provide you with a workspace for interacting in real-time with that database. You can change the database context, if necessary, but not as easily as you can in SQL Server or MySQL because they both support the USE statement. PostgreSQL does not.
To launch Query Tool, select the target database or one of its nodes in Object Explorer, and then click the Query Tool icon at the top of Object Explorer. You can also launch the tool by right-clicking the node and then clicking Query Tool. The tool will open in its own tab in the main pgAdmin window, as shown in the following figure. You can open multiple Query Tool tabs if necessary, which can be useful when carrying out certain task. For example, you might want to compare the results of two different queries or query two different databases.
In Query Tool, you can run any SQL statement that is supported by PostgreSQL. For information about how SQL is implemented in PostgreSQL, refer to the support document: Part II. The SQL Language.
An important feature of Query Tool is the toolbar at the top of the tab, which is shown in the following figure. The toolbar includes a number of icons that enable you to carry out tasks such as saving or opening a script file, editing the current script, or executing one or more statements.

As you can see, I’ve outlined two of toolbar options in red because I wanted to call these out specifically. The two options enable you to execute SQL statements and scripts in different ways:
- Execute script. The first of the two options executes all the SQL script in the Query pane, unless some of the code is selected (highlighted), in which case it will execute only the selected code.
- Execute query. The second option executes the SQL statement in which the cursor is currently positioned. However, it will instead execute only the highlighted code, if any is selected, just like the Execute script icon.
The PostgreSQL topic Query Tool Toolbar provides a detailed breakdown of the different options on the toolbar and the shortcuts available for those options.
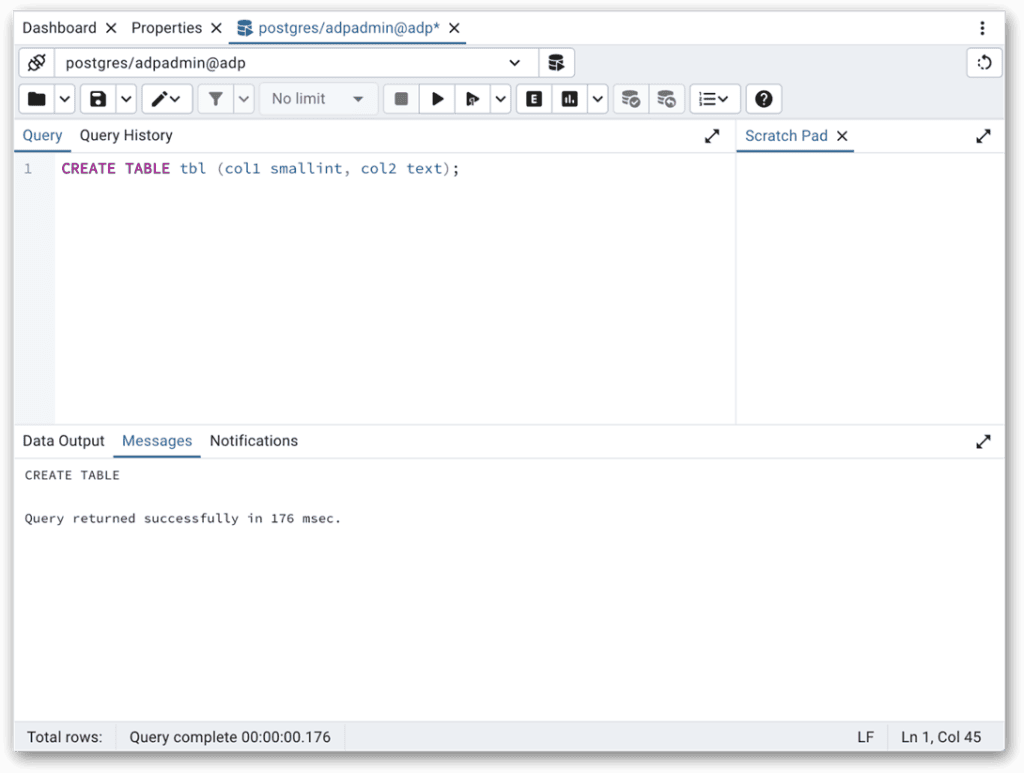
To try out Query Tool, select the postgres database node in Object Explorer, and click the Query Tool icon at the top of Object Explorer. When the Query Tool tab appears, type the following code in the Query pane and click the Execute script icon on the toolbar:
|
1 |
CREATE TABLE tbl (col1 smallint, col2 text); |
The Messages pane should display a message indicating that the statement successfully executed. You can then verify that the table has been created by checking the Tables node in Object Explorer. You might need to refresh the node to see the new table. To do so, right-click the node and click Refresh. The new table should now be listed as one of the tables.
After you create the table, insert a couple lines after the CREATE TABLE statement in the Query pane and then type the following INSERT statement, which will add data to the new table:
|
1 2 3 4 5 6 7 |
INSERT INTO tbl values (101, 'abc'), (102, 'def'), (103, 'ghi'), (104, 'jkl'), (105, 'mno'); |
To execute the INSERT statement only (and not the CREATE TABLE statement again), place your cursor within the statement or directly after it and then click the Execute query icon on the toolbar. This will insert the data into the table and return a message indicating that the data has been added. You can then run the following SELECT statement to confirm that the data has been inserted:
|
1 |
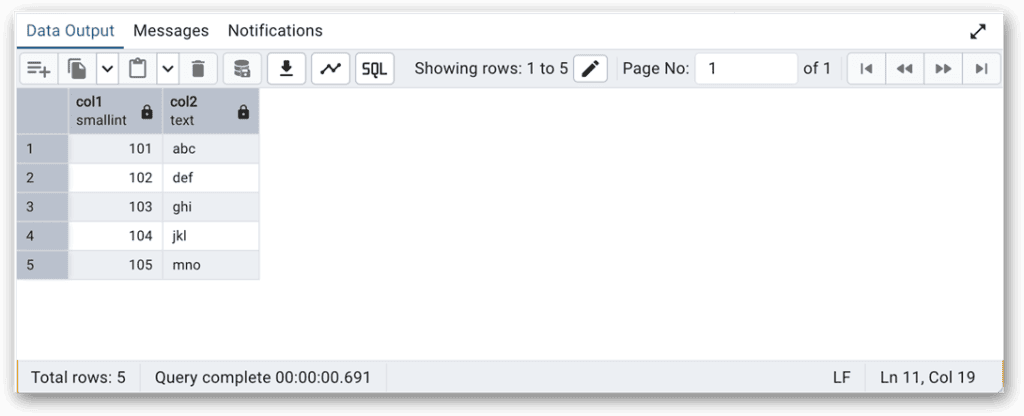
SELECT * FROM tbl; |
When you query data in this way, the results are displayed in the Data Output pane, as shown in the following figure. Notice that the pane includes its own toolbar for working with the query results. The toolbar includes icons for carrying out tasks such as adding a row, copying or pasting data, or saving the results to a file:
After you’re finished experimenting with the Data Output options, delete the table by running the following DROP TABLE statement:
|
1 |
DROP TABLE tbl; |
You can confirm that the table has been deleted by right-clicking the Tables node in Object Explorer and then clicking Refresh.
Working with psql in the pgAdmin GUI
One other pgAdmin feature I want to point out is the built-in psql utility, which you learned about in the last article. The psql feature—referred to as PSQL Tool in pgAdmin—lets you interact directly with an ADP instance, just like you saw with the version of psql that you run in your system’s command-line interface (CLI).
To launch PSQL Tool, select the target database or one of its nodes in Object Explorer, and then click the PSQL Tool icon at the top of Object Explorer. You can also launch the tool by right-clicking the node and then clicking PSQL Tool. The utility will open in its own tab in the main pgAdmin window, as shown in the following figure. As with Query Tool, you can open multiple PSQL Tool tabs if necessary.
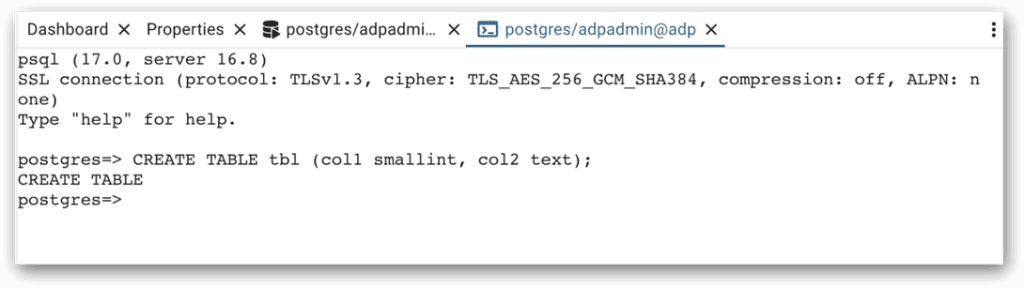
In this case, the tool was opened in the context of the postgres database, as indicated by the command prompt. I took this screenshot after I ran the same the CREATE TABLE statement you saw earlier. As with Query Tool, you can run any of the SQL statements supported by PostgreSQL. You can also run psql meta-commands (described in the previous article).
Being able to switch between Query Tool and PSQL Tool offers greater flexibility for working with your ADP instances. You can use each one in whatever way best suits your current needs and workflow. The pgAdmin interface also has the advantage of providing Object Explorer, which gives you an immediate visual of your database objects, along with quick and easy access to those objects.
Next steps, and what’s to come
As you’ve seen in this article, pgAdmin offers a powerful and feature-rich interface for working with ADP instances and other PostgreSQL deployments. However, we’ve barely skimmed the surface on the many ways you can use pgAdmin to work with PostgreSQL. I encourage you to play around the tool to get more comfortable with how to use it and the many features it offers. You can find more information about the tool in the pgAdmin docs, which cover many aspects of pgAdmin.
As we progress through this series, I’ll be relying on pgAdmin to explain concepts and demonstrate different operations. Many of the examples will be demonstrated in Query Tool and PSQL Tool. The better you understand how these tools work and how to navigate Object Explorer, the more time you can spend learning about ADP and getting the most out of your PostgreSQL instance.
This document contains proprietary information and is protected by copyright law.
Copyright © 2026 Red Gate Software Limited. All rights reserved


Load comments