Many times I’ve been told, by developers who are using live data to develop a database, that it is impossible to anonymise or pseudonymize their data to comply with privacy legislation. One recurring explanation is that one can’t duplicate the distribution of data by faking it. In a sense, this is true, because if you change data you always upset some part of it, such as the number of people called ‘Nigel’, living in Montana. However, this is likely to be a minor inconvenience compared with the risks of exposing personal, financial or business data. Other than this, it is relatively easy to have as much data as you want that looks convincing and conforms to the distribution of the real data. Not only that, but to do it, you need never have access to the real data. All you need to know is the distribution of data.
This article sets the scene for a whole ‘spoofing data…‘ series:
- Spoofing Data Convincingly: Altering Table Data
- Spoofing Data Convincingly: Masking Continuous Variables
- Spoofing Data Convincingly: Credit Cards
- Spoofing Data Convincingly: Doing the Shuffle and Zip
Generating fake country names
Let’s take a simple example. Imagine that you need to have a number of fictitious countries for your database. You feed in the actual countries and you get out fictitious, randomized, countries. Actually, you get fifteen percent of real countries and the rest are fictitious unless you filter out the real ones as we will be doing. This is a tweakable algorithm.
Let’s do it in a simple batch and see what happens. I’ll explain later.
|
1 2 3 4 5 6 7 8 9 10 11 12 13 14 15 16 17 18 19 20 21 22 23 24 25 26 27 28 29 30 31 32 33 34 35 36 37 38 39 40 41 42 43 44 45 46 47 48 49 50 51 52 53 54 55 56 57 58 59 60 61 62 63 64 65 66 67 68 69 70 71 72 73 74 75 76 77 78 79 80 81 82 83 84 85 86 87 88 89 90 91 92 93 94 95 96 97 98 99 100 101 102 103 104 105 106 107 108 109 110 111 112 113 114 115 116 117 118 |
/* we start off with a list of strings. In this case, it is the names of countries. this can come from a file or from a table column. It could come from anywhere */ DECLARE @RawValues TABLE (theString nVARCHAR(30)) INSERT INTO @RawValues(theString) SELECT country FROM (values('Afghanistan'), ('Albania'), ('Algeria'), ('American Samoa'), ('Andorra'), ('Angola'), ('Anguilla'), ('Antarctica'), ('Argentina'), ('Armenia'), ('Aruba'), ('Australia'), ('Austria'), ('Azerbaijan'), ('Bahamas'), ('Bahrain'), ('Bangladesh'), ('Barbados'), ('Belarus'), ('Belgium'), ('Belize'), ('Benin'), ('Bermuda'), ('Bhutan'), ('Bolivia'), ('Botswana'), ('Brazil'), ('Bulgaria'), ('Burkina Faso'), ('Burundi'), ('Cambodia'), ('Cameroon'), ('Canada'), ('Cape Verde'), ('Chile'), ('China'), ('Colombia'), ('Comoros'), ('Congo'), ('Cook Islands'),('Costa Rica'), ('Côte d''Ivoire'), ('Croatia'), ('Cuba'), ('Cyprus'), ('Czech Republic'), ('Denmark'), ('Djibouti'), ('Dominica'), ('Ecuador'), ('Egypt'), ('Eire'), ('El Salvador'), ('Eritrea'), ('Estonia'), ('Ethiopia'), ('Falklands'), ('Fiji'), ('Finland'), ('France'), ('French Guiana'), ('Gabon'), ('Gambia'), ('Georgia'), ('Germany'), ('Ghana'), ('Gibraltar'), ('Greece'), ('Greenland'), ('Grenada'), ('Guadeloupe'), ('Guam'), ('Guatemala'), ('Guernsey'), ('Guinea'), ('Guinea-Bissau'), ('Guyana'), ('Haiti'), ('Honduras'), ('Hong Kong'), ('Hungary'), ('Iceland'), ('India'), ('Indonesia'), ('Iran'), ('Iraq'), ('Isle of Man'), ('Israel'), ('Italy'), ('Jamaica'), ('Japan'), ('Jersey'), ('Jordan'), ('Kazakhstan'), ('Kenya'), ('Kiribati'), ('Kuwait'), ('Kyrgyzstan'), ('Latvia'), ('Lebanon'), ('Lesotho'), ('Liberia'), ('Libya'), ('Liechtenstein'), ('Lithuania'), ('Luxembourg'), ('Macao'), ('Macedonia'), ('Madagascar'), ('Malawi'), ('Malaysia'), ('Mali'), ('Malta'), ('Martinique'), ('Mauritania'), ('Mauritius'), ('Mayotte'), ('Mexico'), ('Micronesia'), ('Moldova'), ('Monaco'), ('Mongolia'), ('Montenegro'), ('Montserrat'), ('Morocco'), ('Mozambique'), ('Myanmar'), ('Namibia'), ('Nauru'), ('Nepal'), ('Netherlands'), ('New Caledonia'), ('New Zealand'), ('Nicaragua'), ('Niger'), ('Nigeria'), ('Niue'), ('North Korea'), ('Norway'), ('Oman'), ('Pakistan'), ('Palau'), ('Panama'), ('Paraguay'), ('Peru'), ('Philippines'), ('Pitcairn'), ('Poland'), ('Portugal'), ('Puerto Rico'), ('Qatar'), ('Réunion'), ('Romania'), ('Russia'), ('Rwanda'), ('Saint Helena'), ('Saint Lucia'), ('Samoa'), ('San Marino'), ('Saudi Arabia'), ('Senegal'), ('Serbia'), ('Seychelles'), ('Sierra Leone'), ('Singapore'), ('Slovakia'), ('Slovenia'), ('Somalia'), ('South Africa'), ('South Georgia'), ('South Korea'), ('Spain'), ('Sri Lanka'), ('Sudan'), ('Suriname'), ('Swaziland'), ('Sweden'), ('Switzerland'), ('Syria'), ('Taiwan'), ('Tajikistan'), ('Tanzania'), ('Thailand'), ('Timor-Leste'), ('Togo'), ('Tonga'), ('Trinidad'), ('Tunisia'), ('Turkey'), ('Tuvalu'), ('Uganda'), ('Ukraine'), ('United Kingdom'), ('United States'), ('Uruguay'), ('Uzbekistan'), ('Vanuatu'), ('Vatican City'), ('Venezuela'), ('Vietnam'), ('Virgin Islands'), ('Western Sahara'), ('Yemen'), ('Zambia'), ('Zimbabwe') )f(country) --Drop our Markov table if is already exists IF OBJECT_ID('tempdb..#markov') IS NOT NULL DROP TABLE #markov CREATE TABLE #Markov ( trigraph NCHAR(3) NOT NULL, iteration TINYINT NOT NULL, frequency INT NOT NULL, runningTotal INT NOT NULL ); /* in our table, we will take every three-character trigraph in the word sequence and calculate the frequency with which it appears in the collection passed to the routine. This is simple to do with a GROUP BY clause. The quickest way I've found of doing this is by a cross-join with a number table (I've used a VALUE table here to reduce dependencies). The result is then fed to a window expression that calculates the running total of the frequencies. You'll need this to generate the right distribution of three-character triads within the list of sample words */ INSERT INTO #Markov(trigraph,iteration , frequency , runningTotal ) SELECT Frequencies.trigraph, Frequencies.Iteration, Frequencies.frequency, Sum(Frequencies.frequency) OVER (PARTITION BY Frequencies.Iteration ORDER BY Frequencies.frequency,trigraph) AS RunningTotal FROM ( SELECT Substring(' ' + Coalesce(theString, '') + '|', f.iteration, 3) AS trigraph, f.iteration, Count(*) AS frequency FROM @RawValues AS p CROSS JOIN (VALUES(1),(2),(3),(4),(5),(6),(7),(8),(9),(10), (11),(12),(13),(14),(15),(16),(17),(18),(19),(20), (21),(22),(23),(24),(25),(26),(27),(28),(29),(30), (31),(32),(33),(34),(35),(36),(37),(38),(39),(40) ) f(iteration) WHERE Substring(' ' + Coalesce(theString, '') + '|', f.iteration, 3) <> '' GROUP BY Substring(' ' + Coalesce(theString, '') + '|', f.iteration, 3), f.iteration ) AS Frequencies(trigraph, Iteration, frequency) ORDER BY Frequencies.Iteration; /* we create a primary key on iteration and trigraph. */ ALTER TABLE #Markov ADD CONSTRAINT PK_Markov PRIMARY KEY NONCLUSTERED (iteration,trigraph); DECLARE @GeneratedWord TABLE (name VARCHAR(30)) DECLARE @RowsWanted INT = (SELECT Count(*) FROM @RawValues) DECLARE @jj INT = 1,@RowCount INT, @ii INT, @NewWord VARCHAR(50) = ' '; DECLARE @EntireRange INT --for matching the sample distribution = (SELECT Sum(frequency) FROM #Markov WHERE iteration=3) WHILE (@jj <= @RowsWanted) --for as many data items needed BEGIN --insert the first trigraph randomly, randomly choosing tied ranks DECLARE @random float=Rand(); SELECT @NewWord = trigraph FROM #Markov WHERE iteration=3 AND (@random * @EntireRange) BETWEEN (runningTotal-frequency) AND runningtotal DECLARE @MaxLength INT = 50; --now we can use markov chains to assemble the word SELECT @ii = 4, @RowCount = 1; WHILE ((@ii < @MaxLength) AND (@RowCount > 0)) BEGIN--we can make our choice based on its distribution but --it tends to reproduce more of the real data and less made up SELECT TOP 1 @NewWord = @NewWord + Right(M.trigraph, 1) FROM #Markov AS M WHERE M.iteration = @ii AND M.trigraph LIKE Right(@NewWord, 2) + '_' ORDER BY NewId(); SELECT @RowCount = @@RowCount; SELECT @ii = @ii + 1; END; INSERT INTO @GeneratedWord SELECT Replace(LTrim(@NewWord), '| ', ''); SELECT @jj = @jj + 1; END; --we will just select the made-up names. Otherwise just select all SELECT [@GeneratedWord].name FROM @GeneratedWord LEFT OUTER join @rawvalues ON name= TheString WHERE TheString IS NULL |
The results are like this but different every time, and all in a different order.
Palaysia, Jape of Man, Sermark, Monduras, Ukragaledone, Tanuatu, Sudandi, Bulginique, Belgary, Ghainia, Viribati, Soman, Czerbati, Huninica, Myan, Vataragua, Zamor-Ledor, Palta Rino, Freen, Huninica, Zamal, Tuvalia, Mauru, Amerra Leone, Madagal, Namboutica, Montserlands, South Arabia, Montserrabia, Zamanica, Costragua, Bulgary, Irazilla, Grence, Switria, Souta Republic, Kuwaica, Andia, Zamibatica, Barbabwe, Ukrael, Camanon, Andia, Sinlan, Swanada, Tontemala, Antarus, Puerra Leonia, Nepanon, Alba, Netherla, Icelanistates, Costerlands, Aussia, Aussia, Phinida, El Saltar, Virgyzstan, Siech Republic, Bolarus, Lestralia, New Cal, Andor-Ledone, Pordan, Marbia, Mayotho, Mexicana, Guinadad, Vieritania, Tuvalia, Myanda, Mayottenste, Honted Stan, Sriti, Eston, Indon, Thaila, Perbia, Armer, Camor-Lestein, Moli, Namen, Afghand, Branma, Virgyzstan, Berbia, Gerbabwe, Persey, Alba, Naurit, Fraq, Cubanica, Germuda, Souta, Braq, Arubabwe, Polawi, Nicronegro, Bolomboupe, Camorra, Côte of Man, Puerral, Guint Luciands, Spaila, Alba, Kuwaicania, Azech Korea, Siech Republic, Gibya, Kuwaitan Samoa, Unitzerrat, Vire, Domin, Saitenesia, Palivia, Eston, Romaican, Soutan, Mozakhstan, Indon, Green, Swanadad, Cambabwe, Latvinistan, Parba, Naudi Arat, Malvia, Saitrea, Armer, Réunidad, Kyrgium, Haitern City, Maudi Arabia, Montenistates, Colawi, Switina Faso, Rustanique, Philippino, Hainea, Domorras, Rominame, Phina, Nethuand, Andonesia, Rwazilan, Mauru, Leba, Serba, Sinlan, Giberia, Nortugala, Azech Korea, Timbodia, Alger, Senegalesh, Costreal, Yemeria, Hongapore, Amerto Rico, Denisia, South Arabia, Guina, Bermany, Sinlanistates, Camain Islands, Kire, Haiwanique, Azech Arabia and Mauru
How did we do this? We started with a table that took each word, added two spaces at the beginning and a |, followed by two subsequent spaces, at the end. This allowed us to map the frequency of each three-letter combination in a collection of words. Any language is made up of common combinations of characters with a few wild exceptions. For words to look right, they must follow this distribution. This distribution will change in various parts of a word, so you need all this information.
So what would happen if, instead of feeding the name of countries into the batch, we do the names of people?
We can pull them from a file, one name per line, like this (changing the path to the file, of course)
|
1 2 3 4 5 6 7 8 9 10 |
DECLARE @RawValues TABLE (theString nVARCHAR(30)) INSERT INTO @RawValues(theString) SELECT Value FROM OpenJson( (SELECT '["'+Replace(String_Escape (Replace(Convert(VARCHAR(MAX),BulkColumn),Char(13)+Char(10),'|') ,'json') ,'|','","') +'"]' FROM OPENROWSET(Bulk 'C:\data\RawData\NamesFirstMale.txt', SINGLE_BLOB) [rowsetresults])) |
And we get …
Clydent, Abeldon, Joelby, Coycent, Dary, Nath, Clex, Lorey, Alaig, Ellan, Coristine, Demuel, Jossel, Jimonso, Dono, Tronzo, Bricence, Wile, Bredd, Jefferly, Sebarow, Brahallus, Donal, Camun, Jaynelin, Dantiso, Ezrared, Jodrifer, Willy, Anto, Amosevel, Jarwin, Reynallus, Vantiago, Taug, Ivoryl, Linstanie, Bra, Tormelan, Sim, Robingo, Ahman, Blanett, Seattin, Pablory, Rahsance, Jametrius, Sterrey, Arien, Alfone, Noraine, Loycent, Ran, Mackiell, Brycey, Bobene, Stant, Samun, Richolph, Tonelo, Aubricey, Ezrac, Cyrust, Tomad, Judsonso, Dunist, Criente, Gernonder, Eltoin, Fede, Cortiney, Jaymund, Kevil, Marcence, Thadfore, Rictos, Noey, Abraelas, Demastian, Darik, Sans, Dewelio, Sheod, Kelsel, Bobb, Albenzo, Emark, Allipe, Mituro, Ceddy, Kenionso, Cormain, Carredo, Jam, Waysses, Stevin, Bary, Emmelo, Adandore, Briastian, Kenver, Steryl, Colbenzo, Eduari, Erne, Edgare, Chasevel, Barcolm, Daval, Gonovani, Wyatty, Simonso, Efraelas, Lucarton, Traviell, Traiah, Lenjam, Huguston, Leidro, Chelby, Brew, Emmald, Garyl, Angenzo, Jeanles, Jac, Abraine, Chuce, Zacques, Cesuelo, Nicke, Benell, Masence, Jeral, Eddiert, Gracy, Edgart, Jendony, Lormaing, Micenzo, Vituron, Roeltobal, Migen, Clayne, Tobiandro, Miturow, Edmothan, Adandre, Derlon, Kylero, Stanco, Carrayne, Collacey, Stevine, Veric, Nelis, Judsony, Delvis, Lanaron, Cruck, Guishall, Angerick, Ellerow, Zack, Clishan, Chanuel, Neaunce, Colert, Ronneline and Donelio
…and so on. The more data we use for our Markov table, the more convincing the generated strings. The drawback to this sort of data generation comes for the person who has a very uncommon name with unusual combinations of characters. It might be possible to detect from the generated names that this person was on the original list. This is something we have to deal with later on by detecting and eliminating outliers , but I’ll explain that later in this series.
Mimicking Discrete Distributions
Rand(), like most random number generators, will give you random numbers between 0 and 1. It is a flat continuous distribution. If you’ve read my blogs, you’ll know how to get continuous normally distributed random numbers from this. You need far more flexibility than even this. You need to mimic the distribution of your data.
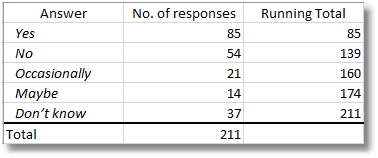
We will do this with discrete rather than continuous data. Imagine you have a column in a questionnaire. You allow “Yes”, “No”, “Occasionally”, “Maybe” and “Don’t know”. 85 people said ‘yes’, 54 said ‘no’, 21 said ‘occasionally’, 14 said ‘Maybe’ and 37 said “don’t know’
So how do you choose randomly in a way that matches this distribution?
You multiply RAND() by 211 in order to give you a number between 0 and 211 You then pick the answer whose running total is greater but nearest to your number
Here is the algorithm sketched out in SQL
|
1 2 3 4 5 6 7 8 9 10 11 12 13 14 15 16 17 18 19 20 |
DECLARE @QuestionnaireData TABLE (Question VARCHAR(15), Responses INT, RunningTotal INT); INSERT INTO @QuestionnaireData (Question, Responses, RunningTotal) SELECT results.Question, results.Responses, results.RunningTotal FROM ( VALUES ('Yes', 85, 85), ('No', 54, 139), ('Occasionally', 21, 160), ('Maybe', 14, 174), ('Don’t know', 37, 211) ) AS results (Question, Responses, RunningTotal); DECLARE @result TABLE (answer VARCHAR(15) NOT null); DECLARE @ii INT = 1, @iiMax INT = 211; WHILE (@ii <= @iiMax) BEGIN INSERT INTO @result (answer) SELECT TOP 1 [@QuestionnaireData].Question FROM @QuestionnaireData WHERE Rand() * 211 < [@QuestionnaireData].RunningTotal ORDER BY [@QuestionnaireData].RunningTotal; SELECT @ii = @ii + 1; END; SELECT answer, Count(*) AS responses FROM @result GROUP BY answer; |
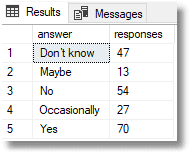
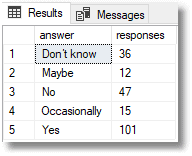
This will give you a different result every time you try it, but you’ll see that the results stay close to the original distribution of answers. This is just a sketch of the algortithm, and you’ll notice that there is an easier and quicker way of doing the join, but we’ll demonstrate that later on in the article, once we go set-based.
Using Markov Data
We will use this principle to choose the first three characters for our words, which for empty strings will be spaces and an end-stop, which are subsequently removed. For subsequent characters we can use the Markov data. What characters will be likely to follow the preceding two at a particular position in a word? We can even adjust the choice according to the probability, though this is likely to generate more of the original strings.
Here, as an example is the distribution data for the fourteenth position in the string.
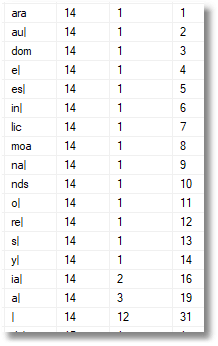
The second column gives the character position in the string. The first column gives the three-character trigraph. At this stage, whatever the last two characters in your string may be, you have no choice: it is a simple lookup. If they are ar, then the next character must be ‘a’, if au, then you can only have l, and so on. If there had been two or more trigraphs starting ar or au then you would be able to roll the dice to decide. The column on the right after the frequency of the trigraph is the running total. We need this to select the appropriate character. The design of the Markov table I use has more information in it than is strictly necessary for the algorithm I’m using, but it allows you to try out different techniques according to the requirements you have. I select the third position in the string to start and select the entire trigraph randomly based on its frequency, because that will give a good approximation to the distribution of the original data. Then I select each character in turn entirely randomly so as to get a livelier divergence.
Going Set-based
We don’t much like iteration in SQL Server, in fact we don’t like it at all. However, any process that relies on random number presents difficulties, and we need to resort to modest trickery. We use a view that is as precious to keen data-spoofers like myself as a number table or calendar is to other SQL Server developers. It is a simple thing.
|
1 2 3 4 5 6 7 8 |
CREATE VIEW dbo.random AS SELECT number from ( VALUES (RAND()), (RAND()), (RAND()), (RAND()), (RAND()), (RAND()), (RAND()), (RAND()), (RAND()), (RAND()), (RAND()), (RAND()), (RAND()), (RAND()), (RAND()), (RAND()), (RAND()), (RAND()), (RAND()), (RAND()), (RAND()), (RAND()), (RAND()), (RAND()) ) AS random (number) |
…except I have much larger tables than this. With a 4000 row random table (SQL Server 2017), I do this….
|
1 2 3 4 5 6 7 |
SELECT answer, (count(*)/4000.00)*211.00 FROM ( VALUES ('Yes', 85, 85,1), ('No', 54, 139,2), ('Occasionally', 21, 160,3), ('Maybe', 14, 174,4), ('Don’t know', 37, 211,5) ) AS results (answer, Responses, RunningTotal,theOrder) INNER JOIN random ON (number*211) BETWEEN (runningTotal-responses) AND runningTotal GROUP BY answer |
This gives the result …
|
1 2 3 4 5 6 7 |
answer proportions ------------ --------------------------------------- Yes 85.402250000 No 53.224750000 Occasionally 19.886750000 Maybe 14.506250000 Don’t know 37.980000000 |
…which tells us that our distribution almost exactly matches the one we originally specified. We can now fake a questionnaire very closely!
One huge advantage we now have is that we are allowed to put this in a table-valued function. We can’t do this with anything that has the rand() function because there is a risk to having functions that don’t return the same outputs for the same input. They restrict optimisation. By cheating we run a risk because we now have a function that has to be executed afresh every time. This, however, is what we want.
So with, health warnings, here is the table-valued function. Here we are working to percentages rather than actual figures for the distribution.
|
1 2 3 4 5 6 7 8 9 10 11 12 13 14 15 16 17 18 19 20 21 22 23 24 25 26 27 28 29 30 31 32 33 34 35 36 37 38 39 40 41 42 43 |
IF Object_Id('RandomAnswers') IS NOT NULL DROP function RandomAnswers GO CREATE FUNCTION RandomAnswers /** Summary: > gives responses randomly, given a distribution of Yes', 51% 'No', 22% 'Occasionally', 16% 'Maybe', 7% 'Don’t know', 4% Author: Phil Factor Date: 12/07/2018 Examples: - Select * from RandomAnswers(50) Returns: > table with a simple list of random answers **/ ( @RowsToReturn int ) RETURNS TABLE AS RETURN ( SELECT TOP (@RowsToReturn) results.answer FROM ( VALUES ('Yes', 51, 51), ('No', 22, 73), ('Occasionally', 16, 89), ('Maybe', 7, 96), ('Don’t know', 4, 100) ) AS results (answer, Responses, RunningTotal) INNER JOIN ( SELECT random.number, Row_Number() OVER (ORDER BY (SELECT 1)) AS theorder FROM dbo.random ) AS f(number, theOrder) ON (f.number * 211) BETWEEN (results.RunningTotal - results.Responses) AND results.RunningTotal ORDER BY f.theOrder ) GO |
Onwards
So, we now seem to have an effective way of generating all sorts of data, and, in particular, the names of things for pseudonymizing data. At this stage, we have plenty of questions still. How effective is it for rule-based strings such as book numbers or postcodes? Just how far can we use this algorithm to generate data? How can we, in practical terms, do the work? How can you generate convincing data without seeing the original data? How do you generate continuous as well as discrete distributions?
We will continue!



Load comments