When you are creating test data, you will, at some stage, hit the problem of simulating a distribution. There are plenty of different distributions. In the real world, variables such as height, rainfall, or examination results conform to a Normal or Gaussian distribution, where the mean is the median, and variables are more likely to have their values close to the median. The natural world is full of examples of variables that conform to the normal distribution, and exhibit the easily-recognised bell-curve when graphed by frequency. This is because the final distribution is the sum of a number of factors that are subject to chance variation.
Were you to have, for example, a cat database that included their weights, and wanted to get some data in there to simulate real data, you might think of using the RAND() function. This would end up giving you a ‘flat’ or ‘Uniform’ distribution, providing you a range including microscopic cats at the same frequency as cats the size of tigers, with an equal chance of everything in between. This is quite unlike the experience of a normal vet’s practice. No. You would probably want a normal distribution though if you were specialising in cats with weight problems, it would be skewed.
In a normal distribution, the shape of the bellcurve is determined by the standard deviation of the variable. This is the dispersion from the average within which 68.2% of all observations will fall. Double the value of this range and 95% of observations will fall within it. (this is used as the classic ‘margin of error’). If we have cats that range widely, then the population with have a high standard deviation. The standard deviation of a population is easily got from a table using the StDev() aggregate function.
So, to return to our tests for our cat database, we need to get the distribution of weights right because the distribution of values of any indexed column are likely to be stored in a special database object and used by the query optimiser to choose the best strategy for getting the data that you request via a SQL Query. If the distribution of your test data is different to your production data then you are unlikely to get the same performance characteristics as in your production system.
Male cats average around 2.8 Kg for a male and 2.4 Kg for a female and we guess at the standard deviation in both cases being around 0.5 Kg. You don’t have the problem of getting these figures because you can get the mean and standard deviation from the production data via a simple SQL Call.
Here, in the following SQL, we have used the values for male cats. We can now generate the data for them
|
1 2 3 4 5 6 7 8 9 10 11 12 13 14 15 16 17 |
DECLARE @RandomNumbers TABLE(number FLOAT); --a simple table of numbers DECLARE @Mean FLOAT; --the mean (and median if normally distributed) DECLARE @StandardDeviation FLOAT; --(the Standard deviation you want) DECLARE @ii INT; --counter DECLARE @TotalWanted INT; --counter SELECT @Mean = 2.8, @StandardDeviation = 0.5, @ii = 1, @TotalWanted = 10000; /* now we generate the numbers we want, with the mean and standard deviation we want */ WHILE @ii <= @TotalWanted BEGIN INSERT INTO @RandomNumbers (number) SELECT ((RAND() * 2 - 1) + (RAND() * 2 - 1) + (RAND() * 2 - 1)) * @StandardDeviation + @Mean; SELECT @ii = @ii + 1; END; |
–now we see what we’ve got and check its mean and standard deviation
|
1 2 3 |
SELECT COUNT(*) AS count, AVG([@RandomNumbers].number) AS avg, STDEV([@RandomNumbers].number) AS stDev FROM @RandomNumbers; |
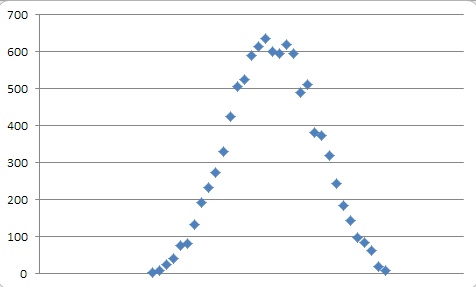
And here are the values of the population that we’d expect.
|
1 2 3 |
count avg stDev ----------- ---------------------- ---------------------- 10000 2.79952921818089 0.697902053383761 |
…and the characteristic bell-curve
What, I hear you ask, about the Box-Muller transform? Surely this will give a better result? OK, we’ll do them together and see.
|
1 2 3 4 5 6 7 8 9 10 11 12 13 14 15 16 17 18 19 20 21 22 23 24 25 26 27 28 29 30 31 |
DECLARE @RandomNumbers TABLE ( number FLOAT, BoxMullerNumber FLOAT ); --a simple table of numbers DECLARE @Mean FLOAT; --the mean (and median if normally distributed) DECLARE @StandardDeviation FLOAT; --(the Standard deviation you want) DECLARE @ii INT; --counter DECLARE @TotalWanted INT; --counter SELECT @Mean = 2.8, @StandardDeviation = 0.5, @ii = 1, @TotalWanted = 10000; /* now we generate the numbers we want, with the mean and standard deviation we want */ SET NOCOUNT ON; WHILE @ii <= @TotalWanted BEGIN INSERT INTO @RandomNumbers (number, BoxMullerNumber) SELECT ((RAND() * 2 - 1) + (RAND() * 2 - 1) + (RAND() * 2 - 1)) * @StandardDeviation + @Mean, @Mean + @StandardDeviation * SQRT(-2.0 * LOG(RAND())) * SIN(2.0 * (22 / 7) * RAND()); --The Box Muller algorithm ; SELECT @ii = @ii + 1; END; SELECT COUNT(*) AS count, AVG([@RandomNumbers].number) AS Mean, STDEV([@RandomNumbers].number) AS stDeviation, AVG([@RandomNumbers].BoxMullerNumber) AS MeanBM, STDEV([@RandomNumbers].BoxMullerNumber) AS stDeviationBM FROM @RandomNumbers; |
Which gives
|
1 2 |
count Mean stDeviation MeanBM stDeviationBM 10000 2.81205294021003 0.50147506201475 2.79670395074757 0.510929926404496 |
There you have it. Nothing much in it but I reckon that my version gives a consistently better standard deviation
So we would have two populations, depending on the sex of the cat and each time we wanted a value, we’d use the SQL Call with the correct mean and standard deviation. Three calls to RAND() will be the minimum to give you the normal distribution. You can add them, of course to get it even finer but this is good enough for me.
There are, of course, plenty of other types of elliptical distributions and then there is the Pareto distribution which corresponds to the way wealth tends to be distributed. Most distributions will be skewed so that the mean and median don’t correspond. Beyond simple distributions such as these, the mathematics begin to get rather complex so we’ll leave it there for this blog. For more details on the various types of non-uniform distributions see Dwain Camps’ excellent article on the subject on SQL Server Central called Generating Non-uniform Random Numbers with SQL


Load comments