In any real numeric data from a database , you are only rarely going to see any sort of normal distribution of the values. Sales data will rise and fall according to the time of year and the economic cycle. The date of input of a record will vary with the workload. If you plot any real data, you are unlikely to see that bell-curve or straight line. It will look more like the welsh hills. (or, technically ‘multimodal’). Truly independent data will tend to conform with the bell-curve whereas dependent data tends to be multimodal.
Imagine that you have a table giving invoice values. You will want your spoof data to conform with the same ups and downs of the real data over time. You may be able to get the overall distribution the same as the real data, but the resulting data would be useless for seeing the effect of last years sales promotion. The invoice values will depend on your sales promotions if your marketing people have done their job properly.
By making your data the same distribution as your production data, you don’t necessarily get the same strategy chosen by the query analyser, but you dramatically increase the chances of getting it. SQL Server uses a complex paradigm to select amongst its alternative plans for a query. It maintains distribution statistics for every column and index that is used for selecting rows. These aren’t actually histograms in the classic sense, but they perform a similar function and are used by the SQL Server engine to predict the number of rows that will be returned.
The easiest numeric data to spoof is an independent variable, so we can start with that.
We will collect the current values and use them to create a histogram. We then use this to select the bin (I prefer the alternative term ‘bucket’ as the word ‘bin’ is too overloaded!) from which we then generate the random number. This will result in a distribution that is a bit more jagged than it should be, but any sort of interpolation is a bit of a distraction at this stage. It is good enough, because pseudonymization can lack finesse, yet be fit for the intended purpose.
We aim to produce a simple function to produce a random float that can be used to stock the ModifiedDate column of AdventureWorks2016.Person.Person (which we have, of course, copied for the purpose.
|
1 2 |
UPDATE AdventureWorksCopy.Person.Person SET modifiedDate=Convert(DATETIME,dbo.RandomFloat(@dh)) |
@dh is our distribution Histogram. The rest is mere detail!
|
1 2 3 4 5 6 7 8 9 10 11 12 13 14 15 16 17 18 19 20 21 22 23 24 25 26 27 28 29 30 31 32 33 34 35 36 37 38 39 40 41 42 43 44 45 46 47 48 49 50 51 52 53 54 55 56 57 58 59 60 61 62 63 64 65 66 67 68 69 70 71 72 73 74 75 76 77 78 79 80 81 82 83 84 85 86 87 88 89 90 91 92 93 94 95 96 97 98 99 100 101 102 103 104 105 106 107 108 109 110 111 112 113 114 115 116 117 118 119 120 121 122 123 124 125 126 127 128 129 130 131 132 133 134 135 136 137 138 139 140 141 142 143 144 145 146 147 148 149 150 151 152 153 154 155 156 157 158 159 160 161 162 163 164 165 |
IF Object_Id('dbo.RandomFloatTable') IS NOT NULL DROP function dbo.RandomFloatTable IF Object_Id('dbo.RandomFloat') IS NOT NULL DROP function dbo.RandomFloat IF Object_Id('dbo.CreateDistributionHistogram') IS NOT NULL DROP function dbo.CreateDistributionHistogram GO IF EXISTS (SELECT * FROM sys.types WHERE types.name LIKE 'DistributionHistogram') DROP TYPE DistributionHistogram IF EXISTS(SELECT * FROM sys.types WHERE name LIKE 'ContinuousVariable') DROP TYPE ContinuousVariable CREATE TYPE ContinuousVariable AS TABLE (number FLOAT NOT null) GO CREATE TYPE [dbo].[DistributionHistogram] AS TABLE( Bucket INT NOT NULL, --the number in the sequence 1..40 StartValue FLOAT NOT NULL,--the starting value for membership of the bucket EndValue FLOAT NOT NULL,--the end value for membership of the bucket "distribution" INT NOT NULL, --the number of values in this bucket RunningTotal INT NOT NULL, --the number of values in or lower than this point PRIMARY KEY CLUSTERED ( [runningtotal] ASC, [distribution] ASC )WITH (IGNORE_DUP_KEY = OFF) ) GO IF Object_Id('dbo.RandomFloatTable') IS NOT NULL DROP function dbo.RandomFloatTable GO CREATE FUNCTION dbo.RandomFloatTable /** Summary: > This returns a random float from a population described by the distibution histogram Author: sa Date: 18/07/2018 Database: PhilFactor Examples: - Select * from dbo.RandomFloat(@dh) - Select * from MyTable cross apply dbo.RandomFloat(MyColumn) Returns: > A table with a single result **/ ( @dh DistributionHistogram readonly ) RETURNS TABLE --WITH ENCRYPTION|SCHEMABINDING, .. AS RETURN ( SELECT [@dh].StartValue + ((SELECT randomnumber FROM SingleRandomNumber) * ([@dh].EndValue - [@dh].StartValue)) AS RandomNumber FROM @dh CROSS JOIN ( SELECT randomnumber * (SELECT Max(RunningTotal) FROM @dh) FROM SingleRandomNumber ) AS f(choice) WHERE f.choice BETWEEN [@dh].RunningTotal - [@dh].distribution AND [@dh].RunningTotal ); go IF Object_Id('dbo.RandomFloat') IS NOT NULL DROP function dbo.RandomFloat GO CREATE FUNCTION dbo.RandomFloat (@dh DistributionHistogram READONLY --our distribution histogram ) RETURNS FLOAT AS BEGIN DECLARE @where INT, @randomnumber FLOAT; /*a bucket on our distribution histogram where we create our number */ SELECT @where = randomnumber * (SELECT Max([@dh].RunningTotal) FROM @dh) FROM SingleRandomNumber; SELECT @randomnumber = --we create a random number within the range of the bucket StartValue + ((SELECT randomnumber FROM SingleRandomNumber) * (EndValue - StartValue) ) FROM @dh --the distribution histogram WHERE @where BETWEEN RunningTotal - distribution AND RunningTotal; RETURN @randomnumber; END; GO IF Object_Id('dbo.CreateDistributionHistogram') IS NOT NULL DROP function dbo.CreateDistributionHistogram GO CREATE FUNCTION dbo.CreateDistributionHistogram /** Summary: > This creates a Distribution histogram from a table that is just a list of FLOATs Author: Phil Factor Date: 18/07/2018 Database: PhilFactor Examples: - Select * from dbo.CreateDistributionHistogram(@InVar) Returns: > A table Bucket, StartValue, EndValue, "distribution", RunningTotal **/ ( @InVar ContinuousVariable readonly ) RETURNS @histogram TABLE -- create our distribution map (--Bucket, StartValue, EndValue, "distribution", RunningTotal Bucket INT NOT NULL, StartValue FLOAT NOT NULL, EndValue FLOAT NOT NULL, "distribution" INT NOT NULL, RunningTotal INT NOT NULL ) AS -- body of the function BEGIN DECLARE @Maximum float,--the maximum value in the set @Minimum float ,--the minimum value in the set @increment FLOAT; --the span of values in each grouping --find the maximum and min imum values in the set SELECT @Maximum = MAX(number)+StDev(number), @minimum = MIN(number)-StDev(number) FROM @InVar; --find the width of each grouping, allowing for random outliers SELECT @increment= (@Maximum-@Minimum)/40.00; WITH buckets AS (SELECT OneToForty.value AS Bucket, @Minimum + (@increment * OneToForty.value) AS StartValue, @Minimum + (@increment * (OneToForty.value + 1)) AS EndValue FROM ( VALUES --the range of each 'bucket' (1), (2), (3), (4), (5), (6), (7), (8), (9), (10), (11), (12), (13), (14), (15), (16), (17), (18), (19), (20), (21), (22), (23), (24), (25), (26), (27), (28), (29), (30), (31), (32), (33), (34), (35), (36), (37), (38), (39), (40) ) AS OneToForty (value) ) INSERT INTO @histogram (Bucket, StartValue, EndValue, "distribution", RunningTotal) SELECT allbuckets.Bucket, allbuckets.StartValue, allbuckets.EndValue, Coalesce(Goodbuckets.coun, 1) AS "distribution", Sum(Coalesce(Goodbuckets.coun, 1)) OVER (ORDER BY allbuckets.Bucket) AS RunningTotal FROM buckets AS allbuckets LEFT OUTER JOIN ( SELECT buckets.Bucket, Count(*) AS coun FROM @InVar iv INNER JOIN buckets ON iv.number BETWEEN buckets.StartValue AND buckets.EndValue GROUP BY buckets.Bucket ) AS Goodbuckets ON Goodbuckets.Bucket = allbuckets.Bucket ORDER BY allbuckets.Bucket RETURN END GO |
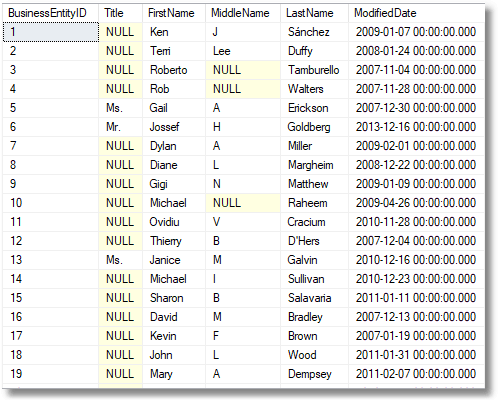
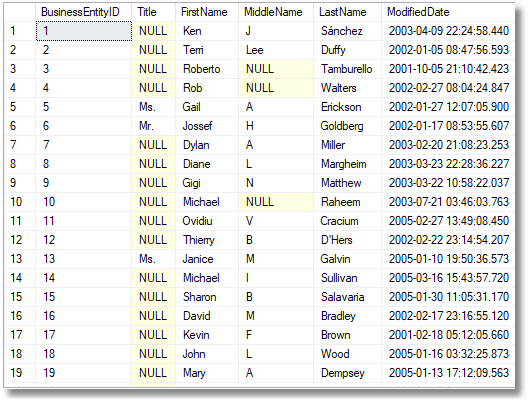
Here are the first few rows with selected columns from the original table
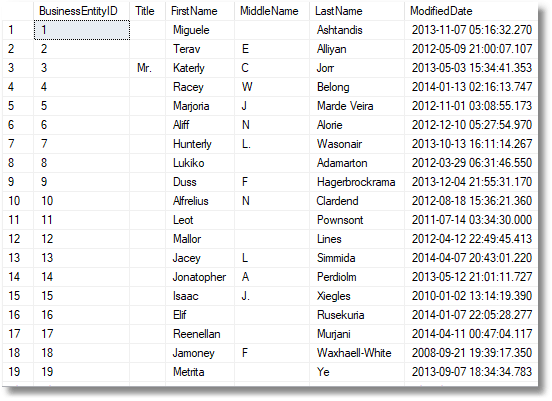
…and the same rows, now pseudonymized
We can now compare the distribution of the old and new data, using the routine I published here in ‘Visual Checks on How Data is Distributed in SQL Server’
|
1 2 3 4 5 6 7 8 9 10 11 12 13 14 15 16 17 18 |
DECLARE @FirstVariable IndependentVariable; --a simple table of numbers INSERT INTO @FirstVariable (number) SELECT Convert(FLOAT,(Person.ModifiedDate)) FROM Adventureworks2016.Person.Person; SELECT ColumnHistogram.line AS 'Original Modified date' FROM dbo.ColumnHistogram(@FirstVariable) ORDER BY ColumnHistogram.y DESC; GO DECLARE @SecondVariable IndependentVariable; --a simple table of numbers INSERT INTO @SecondVariable (number) SELECT Convert(FLOAT,(Person.ModifiedDate)) FROM AdventureworksCopy.Person.Person; SELECT ColumnHistogram.line AS 'Spoofed Modified date' FROM dbo.ColumnHistogram(@SecondVariable) ORDER BY ColumnHistogram.y DESC; GO |
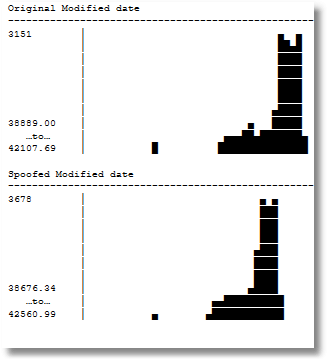
The difference is due to the changed size and ranges of the buckets. It is good enough
We now have a way of randomising independent data, but what if we need to retain the relationship between, for example, date of invoice and invoice amount, We’d need this if we were needing to use data for practice and training in BI, for example. You’ll see that there was a relationship between the modified date and the BusinessEntityID. The easiest way of doing this is to use the original value as a starting point.
|
1 2 3 4 5 6 7 8 9 10 11 12 13 14 15 16 17 18 19 20 |
IF Object_Id('dbo.BlurredFloat') IS NOT NULL DROP function dbo.BlurredFloat GO CREATE FUNCTION dbo.BlurredFloat (@dh DistributionHistogram READONLY,@OriginalNumber float) --our distribution histogram RETURNS FLOAT AS BEGIN DECLARE @where INT, @randomnumber FLOAT; /*a bucket on our distribution histogram */ SELECT @randomnumber = --we create a random number within the range of the bucket StartValue + ((SELECT randomnumber FROM SingleRandomNumber) * (EndValue - StartValue) ) FROM @dh --the distribution histogram WHERE @OriginalNumber BETWEEN StartValue AND EndValue; RETURN @randomnumber; END; GO |
Which gives a Modification date closer to the original, possibly at the cost of some loss in the degree of obfuscation.
So we are now making progress. A way of generating continuous variables as floats either entirely randomly or just blurred is going to be very useful because we can coerce a lot of datatypes into floats and back again. What about strings made up of several words? Perhaps it is time to show a way of doing this for a database.


Load comments