
You’ve probably tried out the database reports that are available in the Performance Dashboard, and decided how useful they are, but did you know that you can create your own dashboard reports?
SQL Server Management Studio (SSMS) was modified in SQL Server 2005 SP2 to display rendered Reporting Services reports (RDL files) without requiring that Reporting Services be installed. You can now use your Reporting Services reports, or build new reports, to extend the reporting capabilities within SSMS. This modification was done primarily to allow performance reporting on the server to be accessible from within SSMS, and Microsoft supplies a special set of Report Definition Language (RDL) files known as the “Performance Dashboard”. This set of RDL files can be used to monitor and pin point performance problems within your server, and can be used and modified in Reporting Services as well. You can even create your own reports and access them by right-clicking on the object you wish to investigate in the object browser pane
The Performance Dashboard
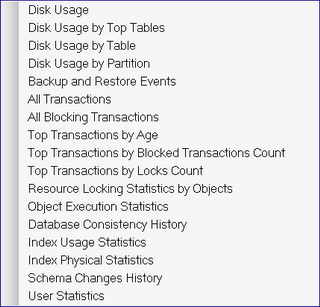
The Performance Dashboard is a series of Reporting Services RDL files that allow you to obtain SQL Server 2005 performance information. The dashboard allows you to start looking at performance information starting from the 100,000 foot level and then drilling down until you get to ground level. At the lowest level the dash board will identify the specific queries that are causing performance issues within your SQL Server instance, such as those consuming the most CPU, taking the longest time, most I/O’s, and most CLR Time. It will report on missing indexes, blocking, latch contention and other performance issues;
The Performance Dashboard is available as a downloadable msi file from Microsoft. You can obtain the msi download file here:
Installing the Performance Dashboard
The first step to install the Performance Dashboard is to install the msi file you downloaded from the link above. The installation process is similar to most msi installs. As you are going through the msi installation you may want to pause when you get to the “Feature Selection” panel of the installation. Here you will be given the opportunity to identify the “Installation Path” for the RDL files. The Installation path defaults to “C:\Program Files\Microsoft SQL Server\90\Tools\PerformanceDashboard\”. You can install the files associated with the dashboard anywhere, but you might want to consider a couple of things before you select a location.
If you have a number of SQL Server machines, and a number of people that will want to use the Performance Dashboard then you might as well identify a network Installation path that is accessible by everyone that will be running the dashboard dashboard RDL files which might someday include your own custom reports.
Once the msi installation completes, you will need to run the “Setup.sql” script that can be found in the installation directory you identified in step 1. The “Setup.sql” file is just a TSQL script that will installs a number of objects (functions and strored procedures) in the msdb database. The objects installed will be used to gather database performance information to help populate the different Performance Dashboard RDL reports. You will need to run the “Setup.sql” script on every instance that you want Performance Dashboard information from.
The SQL Server instance being monitored must be running SP2 or later. After completing the installation, you must:
Run the Setup.sql file on each instance of SQL Server 2005 that you wish to monitor with the SQL Server 2005 Performance Dashboard Reports. Open the performance_dashboard_main.rdl file with the Custom Reports functionality new to Management Studio in Service Pack 2.
Quick Preview of Using the Performance Dashboard
To view the Performance Dashboard you must first bring up SSMS, and connect to one of the SQL Server 2005 instances where you installed the msdb components of the dashboard. Then right click on the server name in object explore, navigate to the “Reports” item, then click on the “Custom Reports” item. This will bring up an “Open File” panel. Use this panel to “Open” the “performance_dashboad_main.rdl” file from the location where you installed the msi file. When you do this the main menu for the “Performance Dashboard” should be displayed, and should look similar to this:
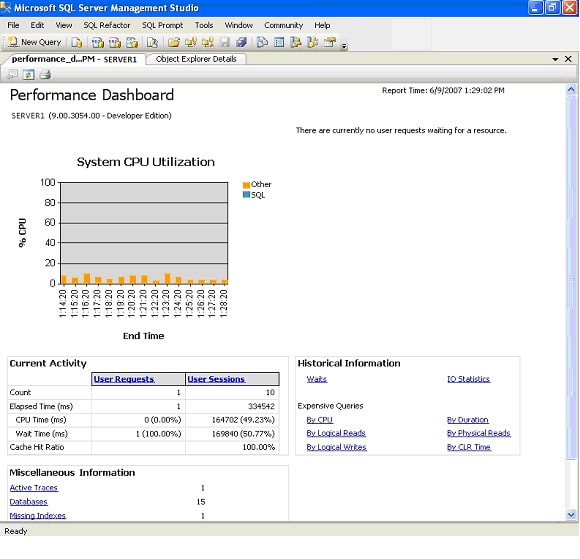
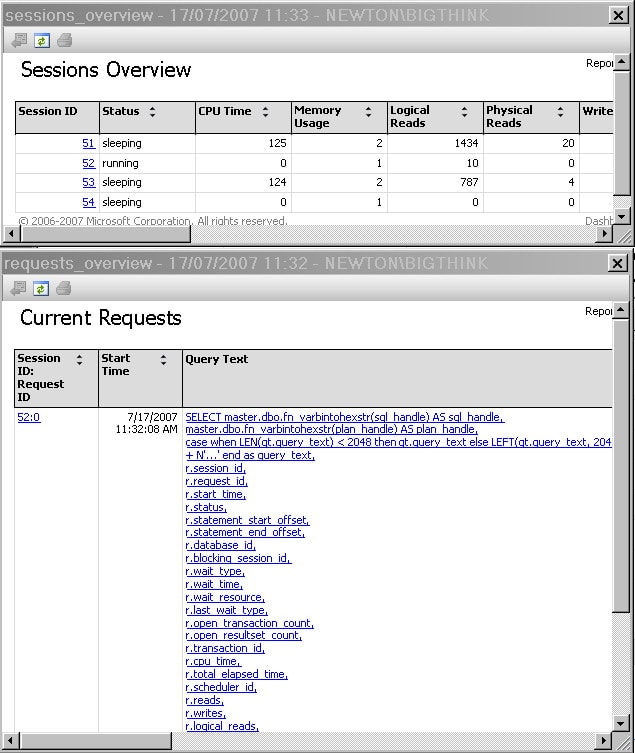
This main menu screen is displaying overall performance statistics for the developer edition of SQL Server 2005 running on my SERVER1 instance. On this report you can see overall “System CPU Utilization”, whether or not there are any requests are waiting for resources, as well as some current, historical and miscellaneous activity or information. There are a number of hyperlinks on this page that allows you to drill down and get more specific information regarding your server performance. Below are a couple of drill down reports, one showing current sessions and the other that shows the most expensive requests.
This report will show you the top 20 cached query plans that have accumulated the most CPU. From this report you can drill down even more to review query plans for an individual cached command. To see all 20 cached query plans you will need to use the scroll bar.
The Performance Dashboard is a useful tool. I would suggest you install it and browse around all the hyperlinks to see all the valuable performance data this tool brings to SSMS. This tool demonstrates lots of different reporting capabilities that can be incorporated into SSMS by building custom Report Services reports.
So now let me show you how you can build your own custom reports.
Incorporating Your Own Custom Reports into SSMS
The Performance Dashboard reports are just a series of Reporting Services RDL files. These RDL files query the instance you are on when you open dashboard and generate useful reports from the query result sets. You can use similar reporting capabilities to build your own custom reports.
To build your own custom report is as simple as creating a Reporting Services RDL file and then referencing the RDL from SSMS. When SSMS renders your RDL file, it also provides your reports with SSMS node information as parameters. The following object node parameters, which are self-explanatory, are available:
- ObjectName,
- ObjectTypeName,
- Filtered,
- ServerName,
- FontName
- DatabaseName.
By using these object node parameters you can customize your report based on the object node you are on when you right click to display you custom report. We’ll look at a couple of example RDL files to demonstrate how this works.
For my first example I am going to use the “DisplayObjectNodeInfo.rdl” file. This RDL file merely displays the SSMS object node parameters based on where you are at in the SSMS object explorer tree when you display this custom report. To run this report, copy the above file and store it somewhere that you have access to from a machine in which has the SSMS tool installed. Then within the object explorer of SSMS expand a database node, then the table node, and then right click on a particular table. On the menu place your mouse on the “Report” item and the click on the “Custom Report” menu item. From the “Open File” panel open the DisplayObjectNodeInfo.rdl from the location where you saved it. When you do this you should see the report being rendered, and upon completion of the rendering you should see an “AllReportParameters” report. This report shows you all the values of the object node parameters for the specific object you where on when you opened this customer report, like ObjectName, ObjectTypeName, Filtered, etc.
If you review the RDL file for the “AllReportParameters” report you can find the parameter specifications for the object node parameters. If you want to include one of these object node parameters in your custom report all you have to do is add that parameter to your report using the appropriate parameter name and data type as identified in the following table:
| Parameter Name | Data Type |
| ObjectName | String |
| ObjectType | String |
| Filtered | Boolean |
| ServerName | String |
| FontName | String |
| DatabaseName | String |
To show you how you might use the object node parameters to make your report parameter driven I will show you a report that displays the record counts for every table in a databases.
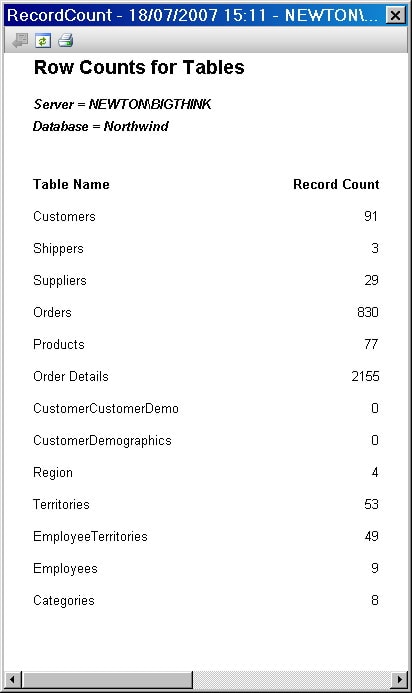
To run this demo you need to save the “RecordCount.rdl” file to some location where you can get at in from SSMS. After saving the RDL file, right click on a database in SSMS, go to “Reports” item, then click on the “Custom Reports” item. In the “Open File” dialog box browse to the location where you saved the above RDL file and open it. When you do that you will see a report that will show a record count for all the tables in your database for the specific database node you were on when you opened my custom “Record Counts” report. Now navigate to a different database node in SSMS, and bring up the report again using the same steps as above. This time the report should render a different report containing the record counts for the new node you selected.
Here is a fragment from the RDL file that shows the actual SQL Query that generates the data
|
1 2 3 4 5 6 7 8 9 10 11 12 13 14 15 16 17 18 19 20 |
<DataSet Name="DataSet1"> <Query> <rd:UseGenericDesigner>true</rd:UseGenericDesigner> <CommandText>SELECT b.row_count, a.name table_name FROM sys.objects a join sys.dm_db_partition_stats b on a.object_id = b.object_id WHERE a.type='u' AND b.index_id < 2</CommandText> <DataSourceName>DataSource1</DataSourceName> </Query> <Fields> <Field Name="row_count"> <rd:TypeName>System.Int64</rd:TypeName> <DataField>row_count</DataField> </Field> <Field Name="table_name"> <rd:TypeName>System.String</rd:TypeName> <DataField>table_name</DataField> </Field> </Fields> </DataSet> |
There is a limitation you should know about when using the any one of the object node parameters. These parameters are only populated for the first report rendered. So if you try to include one of these parameters in a drill down report it will not be populated with a value when the report is rendered. To get around this you need to pass an object node parameters you need in your drill down report from the first report rendered when selecting a custom report. Review Books Online for other limitations.
While working with the custom reporting capability of SSMS I found a feature or, should I say, a quirk regarding the rendering process. When a report is rendered the information for your data source and database in your report is not used. But, instead, the node information from SSMS is used to determine what server and database your query should run against. This is great for those reports that you want to select data based on the database context. If you want your query to run against a specific database then you will need to use a three part naming convention (<databases>.<owner>.<object>) to fully qualify the objects you reference. To demonstrate this functionality save my RecordCount.rdl file to a location you can get at with SSMS. Bring up SSMS and right click on a database, then go to the “Reports” item, click on “Custom Report” and then browse and open up the “RecordCount.rdl” file. When this report is rendered you should notice that it displays records counts for the database you right clicked on. Now close the custom report and right click on another database then open up the “RecordCount.rdl” file again. This time you should see the new set of database record counts based on the second node you clicked on.
For more information on the SQL server 2005 Performance Dashboard Reports, please refer to the help file (PerfDash.chm) located in the installation directory.
Conclusion
With the installation of SP2 for SQL Server 2005 you now have the ability to easily incorporate your own Reporting Services reports into SSMS, without having to install Reporting Services. Being able to do this allows you to build your own reports to augment those provided with SQL Server 2005. By placing your own reports into SSMS you can now make SSMS your one stop shopping for all your reporting and database management needs. Next time you have a need to build a custom Reporting Services report related to database management, consider incorporating it into SSMS by using the custom report option.
Load comments