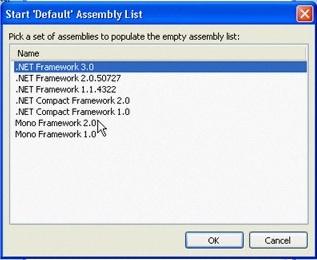
When you first run .NET Reflector, you will be asked pick a version of the NET Framework to populate the assembly list.
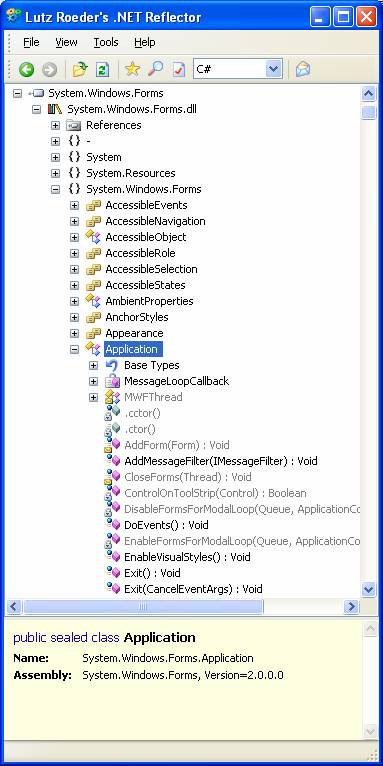
When you want to browse an assembly, all you will need to do is to run NET Reflector, drag the file from Windows explorer and drop it onto NET Reflector. You can also open and .exe, .dll or .mcl file from the file menu in .NET Reflector.
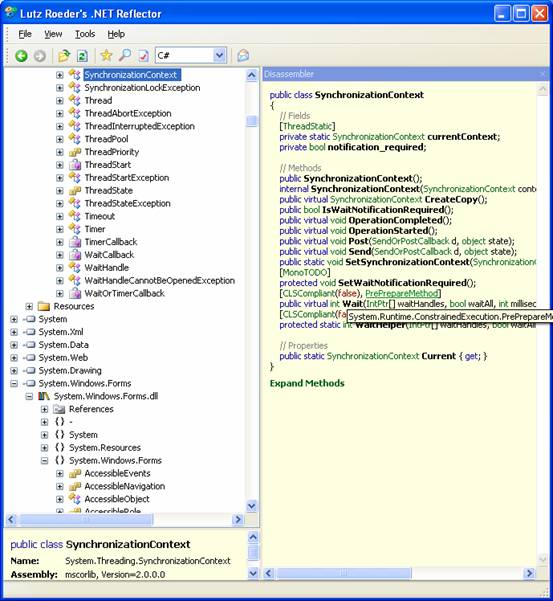
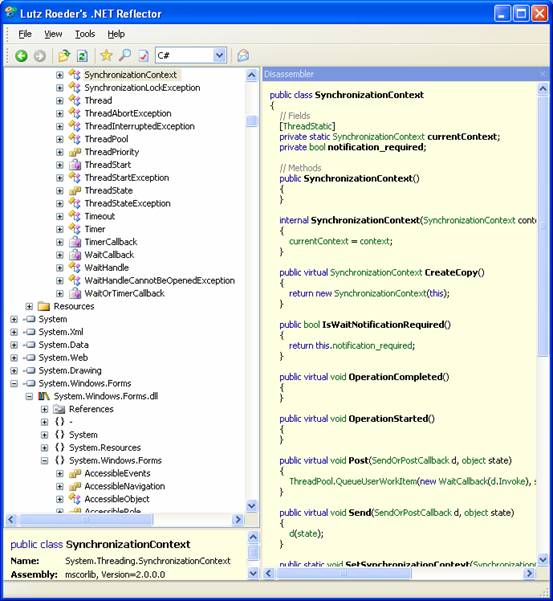
Then you can drill down into namespaces, class and functions and down there, you have a bit of information about each of the components – you can see where the assembly is, its name, version, what type of assembly it is…
Here, we are browsing System.Windows.Forms
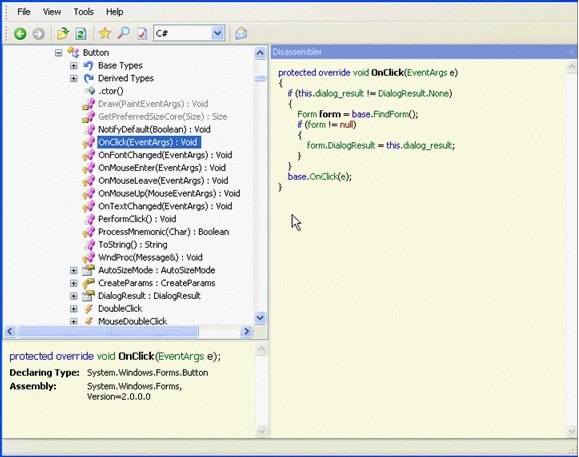
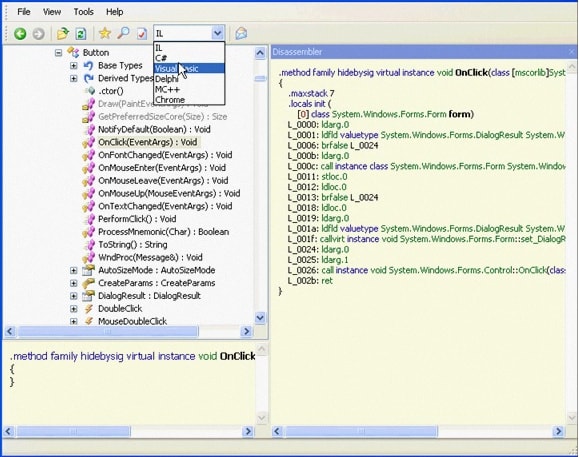
The main functionality of .NET Reflector is the disassembler. So let’s say I want to understand what happens during a particular event because something is not behaving the right way, or my app is not behaving as expected. You can drill down to the method of your choice, right-click and choose Disassemble. And there you have it:
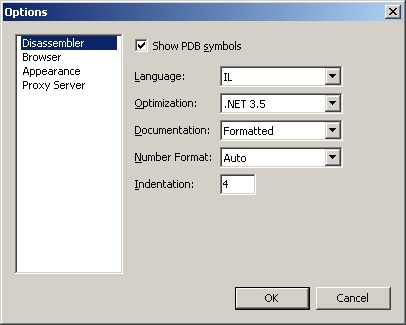
You may, at this stage, need to choose the version of NET Framework that the assembly was developed with by using the View->options dialog box.
you can see the code for that function and see what it does in the Disassembler pane on the right.
I can choose to view the code in C#, or VB.NET or IL code.
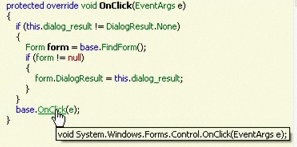
The other cool thing you can do with .NET Reflector is navigating the code view. You can browse the source code by clicking on a function name and that’s really useful because you can explore code quickly, and understand what’s happening behind the scenes.
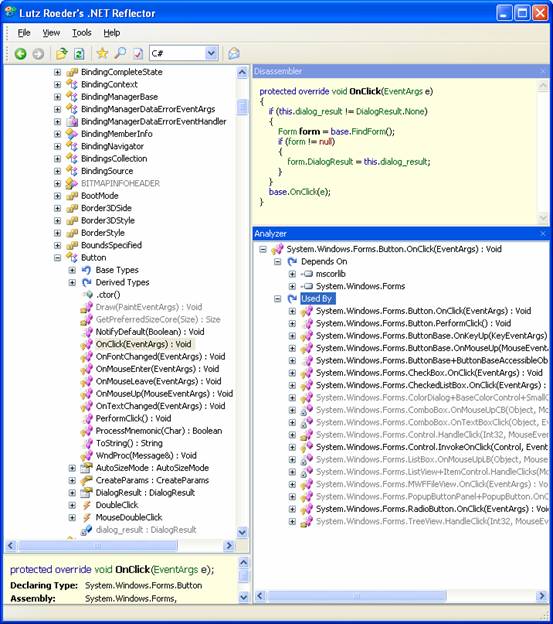
You can navigate the disassembly view,so if I click here in the onclick method
… it will take me to method OnClick
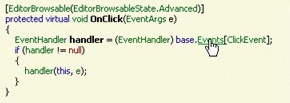
Right down there, we can see that we have the ability to Expand Methods.
When we click on it, it expands and decompiles all the methods in one go.
The other thing you can do with .NET Reflector, is to Analyze a class or a function, so say we pick the function called OnClick(EventArgs) and we right click and choose the command Analyze, we’ll have the Analyzer come up here on the right and we can see what that function depends on, and see the functions that it uses…so we can see the interaction between the different functions.
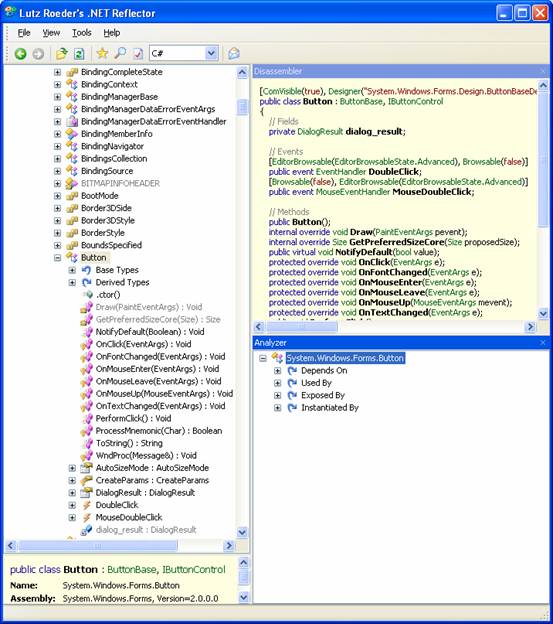
It’s the same principle with a Class. If you pick a class, say Button, you can see the same thing plus, we can also see what the type is exposed by and instantiated by.
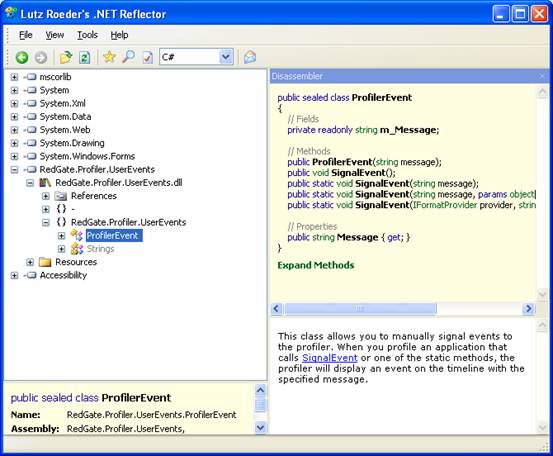
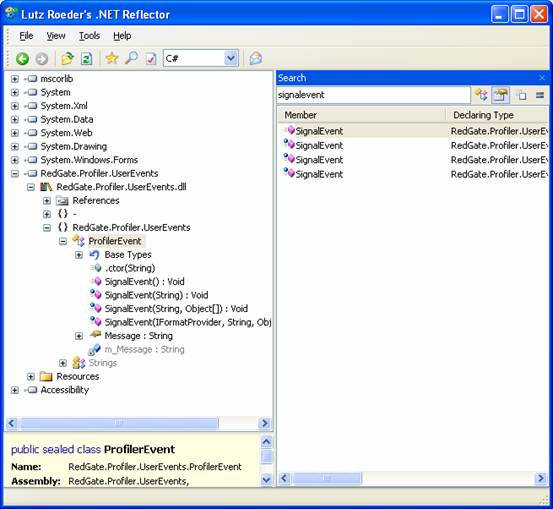
You can also access documentation with .NET Reflector. So if I pick an assembly for which there’s xml documentation available, we can see the documentation for that class or function appearing down on the right. Here we’ll look at a class from ANTS Profiler.
.NET Reflector also has a search functionality (<View<Search). You can set it so it searches on classes or functions.
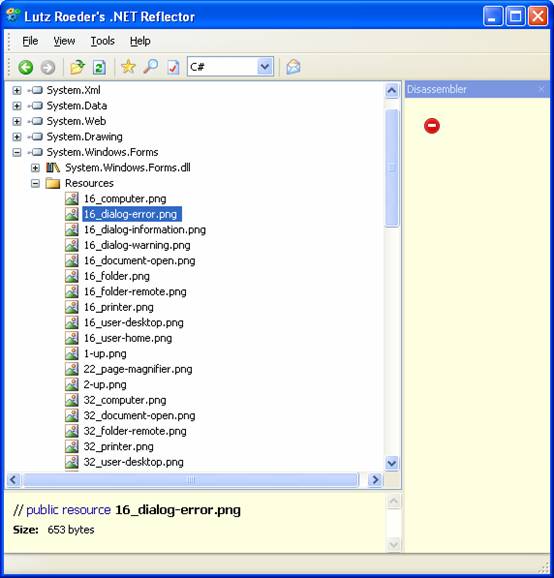
You’ll also note that .NET Reflector lets you access and save resource files.
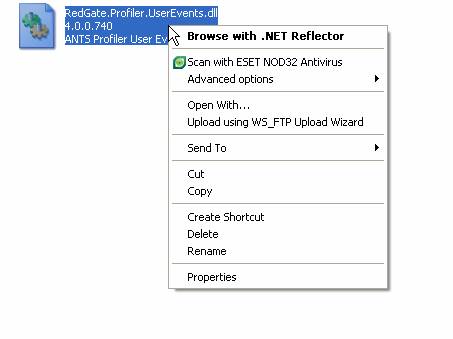
Finally, one last thing I wanted to show you is the Windows Shell integration. We’ll close Reflector, bring up the command line (run – cmd), we’ll drag the Reflector.exe in here and add ” /register”
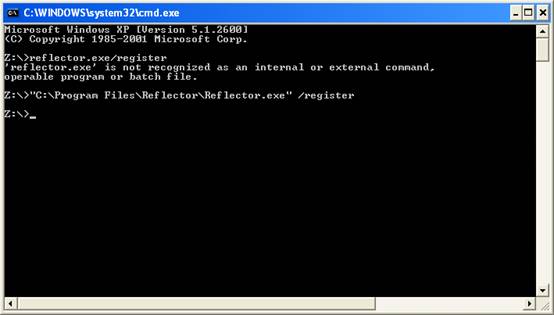
Now if we find a dll and right-click on it, we get a “Browse with .NET Reflector” in the context menu!
If you press Control Alt C when you have selected an item in an assembly in NET Reflector’s browser, you will have a reference on your clipboard that is just like a URL. If you paste it into any web-page or browser-based page, you can then use the URI as a short-cut to bring that item up in NET Reflector.
Load comments