
Contents
FitNesse is a wiki-based framework for writing acceptance tests for software systems. If you are not familiar with FitNesse, Part 1 of this series walks through a complete .NET example from writing the test in your browser to writing the C# code-behind. While FitNesse provides a rather nifty and user-friendly way to write acceptance tests in general, in practice there are plenty of quirks and glitches to watch out for. This and the subsequent parts of this series provide “tips from the trenches”, i.e. an accumulation of tips collected from intensive use of FitNesse on a daily basis to alleviate or avoid many of those pain points.
Here is your roadmap to the series, showing where you are right now:
|
|
|
|
|
|
|
|
|
|
|
Part 4: Debugging, Control Flow, and Tracing |
|
|
|
|
|
|
|
|
Most sections in this article have references with actual hyperlinks to the FitNesse, fitSharp, or DbFit reference material. Some also have references to the sample test suite accompanying this series of articles, e.g. CleanCode.ConceptNotes.LayoutShowingEmbeddedNewlines. That path refers to a page on your FitNesse server. Thus if you are running on port 8080 on your local machine, the full URL to visit that page would be:
http://localhost:8080/CleanCode.ConceptNotes.LayoutShowingEmbeddedNewlines
Debugging
Use Diagnostics to Get Up And Running
When you first attempt to configure FitNesse for your .NET environment, you launch the FitNesse server (fitnesse.jar or fitnesse-standalone.jar) and then you go to your browser and attempt to browse (e.g. http://localhost:port). You should typically be able to see that top-level page and other static pages. But when you attempt to run a test you may just see… nothing. The critical configuration, as described in Differentiating Java from .NET in Part 2 of this series, is getting the COMMAND_PATTERN and TEST_RUNNER variables set just right. If you do not, you may get an error or you may get a blank page. One diagnostic you can use to see if you are in fact getting to the appropriate test runner is to go the root page (either click on root at the bottom of most any page or browse directly to http://localhost:port/root), edit the page, and modify your definition of TEST_RUNNER. You did put that here in the root page, right? Change the test runner from Runner.exe to RunnerW.exe:
|
1 |
!define TEST_RUNNER {your_path\RunnerW.exe} |
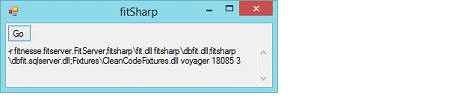
Save that, return to your test page, and again attempt to run it with the Test button. That should pop up a window before it starts running that tells you you have been able to specify a valid path to the TEST_RUNNER and have at least made it that far.
Reference: Using FitNesse
Connect Your Tests to Visual Studio’s Debugger
The standard FitNesse documentation walks you through a couple simple examples-equivalent to “Hello, World” in FitNesse dialog-so I do not need to repeat that here. So let us say you have some basic tests working and you want to debug your C# test fixture code with Visual Studio’s debugger. There are actually several ways to do that, presented here in order of decreasing cumbersomeness:
Method 1:
This might sound familiar. Go to your root page and redefine TEST_RUNNER from Runner.exe to RunnerW.exe. Then, when you launch a test, FitNesse presents a pop-up dialog, effectively pausing the run, giving you time to go over to Visual Studio and attach a debugger to the process. This certainly works, but it involves a lot of clicks to do the job.
This method applies globally to any test or suite you choose to run.
Method 2:
FitSharp provides a simple fixture for invoking the debugger:
|
1 |
!|debug| |
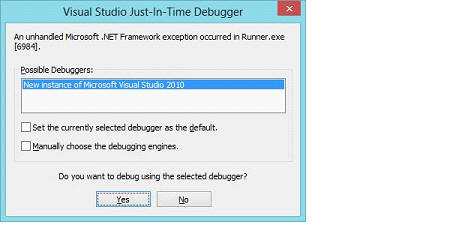
When this table is executed, you receive a prompt to start or reuse a Visual Studio instance. You land in Visual Studio, with execution stopped at the definition of this fixture code. From there you can set breakpoints and step into your own code. To disable debugging here, you need to edit your test and either comment out the above table or delete it.
This method may apply to a specific test (if you put the test table in a specific test), multiple tests (put it in a suite setup page or multiple test pages), or globally (put it in a top-level setup or suite setup page that is inherited by all tests).
Method 3:
My CleanCode fixture library (included in the attached project) allows you to enable or disable debugging with an external switch meaning that, using Windows shortcuts, you can enable or disable debugging with a single click or single key combination of your choosing. Here is how you do it.
Instrument one or more tests (or setup page) with the Debugger test table below.
That will change nothing about your test execution because debugging is disabled by default. Included in the library are two simple command files-EnableDebug.cmd and DisableDebug.cmd-which provide the external trigger. Run EnableDebug.cmd to enable debugging then try executing your test again. This time, when that test table is hit, you get the familiar prompt to start or reuse a Visual Studio instance for debugging. You land in Visual Studio, with execution stopped at the definition of this fixture code. From there you can step into and set breakpoints in your own code.
|
1 2 3 |
!|Debugger | |LaunchWithExternalTrigger()| | | |
Set up Windows shortcuts to the two command files and/or use a keyboard accelerator utility (e.g. SlimKeys) so you could enable/disable debugging with a double click or with a key combination.
You can use this fixture in a couple ways. Put it in your top-level, inherited SetUp page. Then essentially every test will go to the debugger at startup. Alternately, sprinkle it at any one or more points in a given test where you wish to debug. If you just want to pause, though, the Continuation fixture provides a Pause method that is even easier to use, discussed in the next section.
Method 4:
You can compile into your application code a different debug mechanism that you can also enable or disable at will without recompiling. Add this line in your fixture code where you want to pause to allow time to attach a debugger:
|
1 |
DebuggerWait.WaitForDebuggerIfFlagged(); |
By default it will not wait at all, i.e. debugging will be disabled. To enable it just create a file named application.WAIT (e.g. myprog.exe.WAIT) in the same directory as your executable. Then when the above line is reached, the program sleeps, giving you time to attach the debugger. To resume execution simply delete the WAIT file.
Summary of the techniques to connect to a debugger
|
Method |
Applies |
Enabling/Disabling |
Attach debugger |
|
Runner/RunnerW |
globally |
Traverse to root and edit each time |
manual |
|
FitSharp debug fixture |
globally or locally |
edit each time |
automatic |
|
CleanCode debugger fixture |
globally or locally |
edit just once; then use external trigger |
automatic |
|
CleanCode DebuggerWait |
locally |
edit just once; then use external trigger |
manual |
Reference: debug fixture
Control Flow
These elements that affect control flow should usually only be used on a temporary basis as you are working out the issues with your test code because they change the workflow of the tests.
Pause To Examine Resources
If you want to pause a test to examine some external resource manually, use the Pause method in the Continuation fixture.
|
SOURCE |
!|Continuation | |Pause | |Review data in DB if desired…|
|
|||
|
OUTPUT |
|
|||
|
RUN |
|
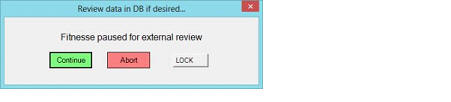
When the test gets to that test table, it pops up the dialog box shown. You can click Continue or Abort as appropriate after you have examined your external resource. Because pressing Return will also activate the button having focus, you can use the Lock button to prevent that from inadvertently happening as you switch between the many windows typical of a developer, assured that the Pause will not continue or abort until you are explicitly telling it to do so.
Reference: CleanCode.ControlFlow.PausingTestsToExamineExternalResources
Abort Conditionally
Caution: Use aborts only during test development. Remove them promptly and never commit files to source control containing aborts. An abort, when triggered, halts the entire FitNesse run, not just a single test!
The AbortIfValue method is a conditional abort; it will only abort if the object has a value; otherwise execution continues seamlessly. You may use a symbol, variable or a SQL query (of course, you need to setup your database connection in advance if using the latter). In this example, if any rows are returned, testing is aborted.
|
1 2 3 |
!|Abort | |AbortIfValue | |select * from Prices where ProgramNumber like 'A%'| |
Here is an example using a symbol (described in a later section). The test will abort only if the symbol is defined (i.e. it has a value) and it is not null:
|
1 2 3 |
!|Abort | |AbortIfValue| |<<foobar | |
Similarly you can use the AbortIfNoValue method to abort on the opposite condition.
Reference: CleanCode.ControlFlow.AbortTests
Abort Unconditionally
Caution: Use aborts only during test development. Remove them promptly and never commit files to source control containing aborts. An abort, when triggered, halts the entire FitNesse run, not just a single test!
In the event that you want to temporarily stop your test unconditionally, you can use this table to abort and return the exit code you specify.
|
1 2 3 |
!|Abort | |ExitCode|Abort| |23 | | |
Reference: CleanCode.ControlFlow.AbortTests
Tracing
Besides being able to debug sometimes it is useful just to be able to have a permanent trace log. My fixture library includes a tracing facility wherein you may instrument your fixture code or instrument your test pages, or both, depending on your needs.
Step 1: Instrument your FitNesse Tests
The goal here is to bracket each suite in a BEGIN…END block and each individual test page in a BEGIN…END block. There are a variety of brute force ways to do that but the approach detailed in this table provides an almost maintenance-free technique.
|
Put here… |
This table… |
|
In each SetUp page |
|CleanCodeFixtures.Common.Diagnostic| |Begin | |${PAGE_NAME} |
|
|
In each TearDown page |
|CleanCodeFixtures.Common.Diagnostic| |End | |${PAGE_NAME} |
|
|
In each SuiteSetUp page |
|CleanCodeFixtures.Common.Diagnostic| |Begin | |${PAGE_PATH}.${PAGE_NAME} |
|
|
In each SuiteTearDown page |
|CleanCodeFixtures.Common.Diagnostic| |End | |${PAGE_PATH}.${PAGE_NAME} |
|
Note that if you only have a top-level SetUp or TearDown page, you only need the SetUp or TearDown table there; inheritance will take care of the rest.
For SuiteSetUp or SuiteTearDown pages, however, you need one explicitly for each suite, even if it is just for this markup. Inherited ones will not show the proper page paths! Note that you can reduce code duplication by putting this markup and anything else you need for your SuiteSetUp into a common file (I have a SuiteSetUpCommon at the top-level of my tree) then the entire contents of every SuiteSetUp file is this exact, single line:
|
1 |
!include -setup .CleanCode.SuiteSetUpCommon |
References: CleanCode.DataBaseNotes.SpecifyingFieldsToMatch
Step 2: Instrument your C# code
Each non-trivial fixture method should be bracketed with Diagnostic.Enter() and Diagnostic.Leave(). It is important that these always balance so you need to pay careful attention to multiple exit points and particularly exception handling. If you have multiple exit points, just put a Diagnostic.Leave() immediately before each of them. If your method may throw exceptions but you want them to bubble up, you should add an explicit try-catch-finally using something like this template to both balance the Enter/Leave and to report the exception:
|
1 2 3 4 5 6 7 8 9 10 11 12 13 14 15 16 17 18 19 20 |
public bool Ok() { string exitMessage; Diagnostic.Enter(); try { . . . } catch (Exception ex) { exitMessage = ex.Message; throw; } finally { Diagnostic.Leave(exitMessage); } return true; } |
References: WordFrequency.cs
Step 3: Enable Tracing
In your config file set the FitnesseLogging parameter to true. Here you may also change the target logging file (FitnesseLogFileName) if desired–the default is log\fitnesse.log. Note that you may use an absolute or a relative path; a relative path is relative to the location of the FitNesse JAR file. Also, the directory must exist; if it does not no logging occurs and no error is reported.
Here is a sample trace from running the entire test suite in the accompanying project. This shows tracing of both test pages and fixture code. Test pages show the results upon exit (number right, number wrong, etc.). You can see how it nicely indents based on suites and, for just the one C# file instrumented (WordFrequencyDemo), how it further indents right into the C# code.
|
1 2 3 4 5 6 7 8 9 10 11 12 13 14 15 16 17 18 19 20 21 22 23 24 25 26 27 28 29 30 31 32 33 34 35 36 37 38 39 40 41 42 43 44 45 46 47 48 49 50 51 52 53 54 55 56 57 58 59 60 |
07/25/13 03:43:42.053 ENTER CleanCode.GeneralUtilityFixtureNotes.SuiteSetUp 07/25/13 03:43:42.113 ENTER ConcatFixture TEST PAGE 07/25/13 03:43:42.240 TOOK : 00:00:00.1251302 07/25/13 03:43:42.242 LEAVE ConcatFixture TEST PAGE :: 17 right, 0 wrong, 0 ignored, 0 exceptions 07/25/13 03:43:42.250 ENTER ConvertSymbolsFixture TEST PAGE 07/25/13 03:43:42.316 TOOK : 00:00:00.0635422 07/25/13 03:43:42.318 LEAVE ConvertSymbolsFixture TEST PAGE :: 2 right, 0 wrong, 0 ignored, 0 exceptions 07/25/13 03:43:42.322 ENTER CountFixture TEST PAGE 07/25/13 03:43:42.334 TOOK : 00:00:00.0097753 07/25/13 03:43:42.336 LEAVE CountFixture TEST PAGE :: 4 right, 0 wrong, 0 ignored, 0 exceptions ... 07/25/13 03:43:43.201 TOOK : 00:00:01.1458121 07/25/13 03:43:43.207 LEAVE CleanCode.GeneralUtilityFixtureNotes.SuiteTearDown 07/25/13 03:43:43.219 ENTER CleanCode.DataBaseNotes.SuiteSetUp 07/25/13 03:43:43.754 TOOK : 00:00:00.5083228 07/25/13 03:43:43.759 LEAVE CrudOperations TEST PAGE :: 26 right, 0 wrong, 0 ignored, 0 exceptions 07/25/13 03:43:43.767 ENTER HelloDbTest TEST PAGE 07/25/13 03:43:43.785 TOOK : 00:00:00.0136828 07/25/13 03:43:43.790 LEAVE HelloDbTest TEST PAGE :: 2 right, 0 wrong, 0 ignored, 0 exceptions 07/25/13 03:43:43.803 ENTER SimpleFetch TEST PAGE 07/25/13 03:43:43.883 TOOK : 00:00:00.0762491 07/25/13 03:43:43.887 LEAVE SimpleFetch TEST PAGE :: 2 right, 3 wrong, 0 ignored, 0 exceptions 07/25/13 03:43:43.895 TOOK : 00:00:00.6696259 07/25/13 03:43:43.899 LEAVE CleanCode.DataBaseNotes.SuiteTearDown 07/25/13 03:43:43.905 ENTER CleanCode.ConceptNotes.SuiteSetUp 07/25/13 03:43:43.916 ENTER AccessWindowsEnvironmentVariables TEST PAGE 07/25/13 03:43:43.923 TOOK : 00:00:00.0039126 07/25/13 03:43:43.927 LEAVE AccessWindowsEnvironmentVariables TEST PAGE :: 2 right, 0 wrong, 0 ignored, 0 exceptions 07/25/13 03:43:43.935 ENTER AppSettingsTestPage TEST PAGE 07/25/13 03:43:43.950 TOOK : 00:00:00.0117319 07/25/13 03:43:43.956 LEAVE AppSettingsTestPage TEST PAGE :: 2 right, 0 wrong, 0 ignored, 0 exceptions ... 07/25/13 03:43:44.439 TOOK : 00:00:00.5298449 07/25/13 03:43:44.443 LEAVE CleanCode.ConceptNotes.SuiteTearDown 07/25/13 09:14:41.430 ENTER DefineAndUseSymbolsAndVariables TEST PAGE 07/25/13 09:14:41.450 TOOK : 00:00:00.0127083 07/25/13 09:14:41.456 LEAVE DefineAndUseSymbolsAndVariables TEST PAGE :: Test Case Counts: 6 right, 0 wrong, 0 ignored, 0 exceptions 07/25/13 09:14:41.468 ENTER WordFrequencyDemo TEST PAGE 07/25/13 09:14:41.483 ENTER WordFrequency.MostFrequentDetails 07/25/13 09:14:41.490 ENTER WordFrequency.GenerateWordFrequencyList 07/25/13 09:14:41.499 ENTER WordFrequency.RawWordList 07/25/13 09:14:41.506 TOOK : 00:00:00 07/25/13 09:14:41.512 LEAVE WordFrequency.RawWordList 07/25/13 09:14:41.525 TOOK : 00:00:00.0273735 07/25/13 09:14:41.532 LEAVE WordFrequency.GenerateWordFrequencyList 07/25/13 09:14:41.561 TOOK : 00:00:00.0733245 07/25/13 09:14:41.566 LEAVE WordFrequency.MostFrequentDetails 07/25/13 09:14:41.675 ENTER WordFrequency.GenerateWordFrequencyList 07/25/13 09:14:41.680 ENTER WordFrequency.RawWordList 07/25/13 09:14:41.683 TOOK : 00:00:00 07/25/13 09:14:41.687 LEAVE WordFrequency.RawWordList 07/25/13 09:14:41.691 TOOK : 00:00:00.0117296 07/25/13 09:14:41.695 LEAVE WordFrequency.GenerateWordFrequencyList 07/25/13 09:14:41.701 ENTER WordFrequency.RawWordList 07/25/13 09:14:41.705 TOOK : 00:00:00 07/25/13 09:14:41.708 LEAVE WordFrequency.RawWordList 07/25/13 09:14:41.712 TOOK : 00:00:00.2395055 07/25/13 09:14:41.716 LEAVE WordFrequencyDemo TEST PAGE :: Test Case Counts: 12 right, 0 wrong, 0 ignored, 0 exceptions ... |
References: CleanCode.ConceptNotes.InstrumentingYourCodeForTracing, CleanCode.SetUp, CleanCode.SuiteSetUp, CleanCode.SuiteSetUpCommon
More to Come…
Part 5 continues with everything you ever wanted to know about using symbols and variables effectively, and why those terms are themselves rather problematic!
Load comments