In this article I am going to continue on from my last article, Don’t Give me none of your VS, by looking at how to debug in the mysterious world where the debugging tools for Windows hold sway, and sos.dll turns CLR internals into a veritable fountain of knowledge. Specifically, I will discuss the exception handling framework that is in place, talking about .Net exceptions such as System.Exception and what I call ‘CPU exceptions‘ such as Access Violation (C0000005): You might know them as Win32 or hardware exceptions. I will then explain how we can create, and use, memory dumps to find and fix bugs after the fact; in other words, post-mortem debugging.
Finally, I will show an example of debugging using cdb and also using Visual Studio. In the first article (Don’t Give me none of your VS), I was advocating the practice of just using cdb, but I now realise that this is quite a big jump: In this article, therefore, I will show an example using cdb and sos.dll and then go on to discuss how you can achieve the same thing in Visual Studio although, in this particular example, you will need a degree of patience. However, I want to be clear in that I am not personally anti Visual Studio or Microsoft, I think it is a very good IDE, I use it every day and am happy with it, I just believe that the debugging tools for Windows give you more control and power when debugging and when you don’t have the option of installing Visual Studio (i.e. a production server) or you don’t have source code readily available then you can’t beat cdb and sos.dll for debugging managed applications.
What is an exception?
Let’s start at the beginning. An exception is an event that, under normal operations, shouldn’t happen at any time, but may do. If it is not handled, it can stop your application from running. An exception is analogous to your car stopping dead while you are driving. There are many possible causes for the stop; you may have applied the brake, the engine may have seized, a passenger inside the car may have yanked at the hand brake or someone external may have put something fairly solid in your way. Whatever has happened, if you handle the situation, some things you can recover from and some you can’t.
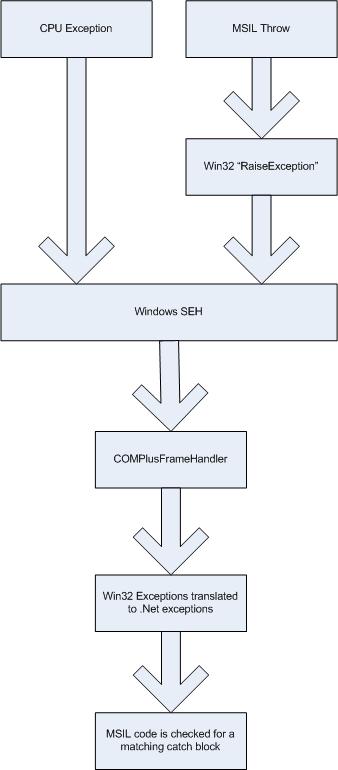
An exception is either raised by the CPU; something maybe like a divide by zero or access violation. This happens because the CPU has a set of rules for how an operation works: If it doesn’t like the parameters, it will shout and ask you (the developer) what it is you want to do. I also include soft exceptions such as user breakpoints as these will end up causing the same result. The second way for an exception to occur is for an application to ask Windows to raise an exception, which then does the asking rather then the CPU. To raise an exception, the application uses the win32 function RaiseException.
How are exceptions handled?
To provide a framework around exceptions, Windows provides, and the CLR uses, structured exception handling. What happens is that you register a handler using SetUnhandledExceptionFilter, and Windows stores the methods registered in a chain ordered by how recently these were added, visiting each in turn until the exception is handled or the application is terminated.
What about .NET Exceptions?
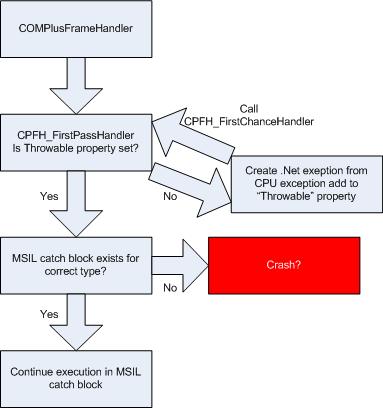
You may well be wondering why, in a .NET article, I have described what happens in a C++ Win32 application. Surely this is all old hat, and we are in the all-whizzy CLR world? Well the CLR is written in c++ and when your program runs, and an exception is raised, it is a CLR function that is called COMPlusFrameHandler. This is in mscorwks.dll.
If you have the rotor or sscli code and want to find out more about how the CLR handles exceptions, you can find it in "sscli20\clr\src\vm\i386\excepx86.cpp", this does a number of things, but of particular note is that it takes the CPU exception such as a Access Violation and creates an actual .NET Systm.AccessViolationException or System.NullReferenceException (it will translate a access violation into either, see MapWin32FaultToCOMPlusException in sscli20\clr\src\vm\excep.cpp).
The COMPlusFrameHandler is also called for managed exceptions, because the MSIL code calls RaiseException which then causes the structured exception handling (SEH) to be invoked.
Whether it is a .NET or CPU exception, the CLR, uses the JIT manager in order to find a MSIL handler for the type of exception that has been raised. If a handler is found, then execution continues at that point; if not, then the SEH chain is checked for further handlers.
Let’s now take a look at a memory dump file to verify this. In true showbiz style, I will use a memory dump that I made earlier. This is available for you to download, if you wish, in the links at the end of the article. If you do, make sure you have the debugging tools for Windows. This first example cannot be done with Visual Studio, so it will just be in cdb.
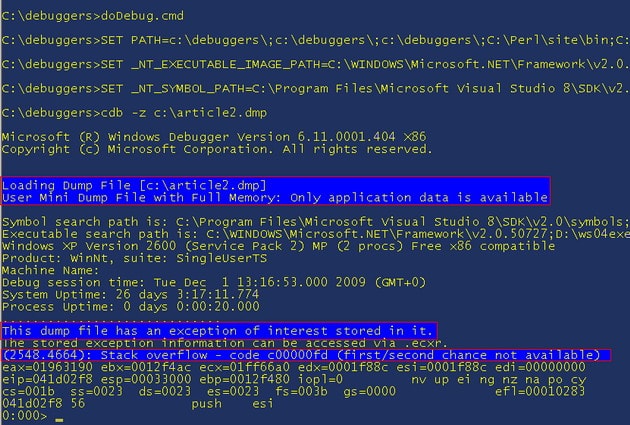
Start a command prompt, and then run the doDebug.cmd file from the previous article and then do “cdb -z c:\pathToDumpFile\sampleCrash.dmp“. It should open the dump file and show something like:
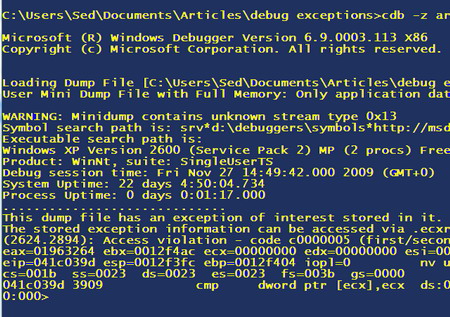
This tells us that it can open the file, and that it is sitting at the point of an exception (“This dump file has an exception of interest stored in it”). Let’s first of all have a look at the SEH chain: so type "!exchain":
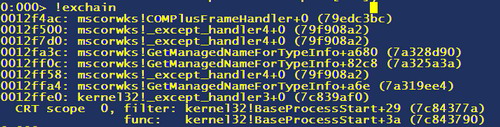
This shows that the first handler is COMPlusFrameHandler, and then we have a number of other handlers which ultimately end up with kernel32 which, if it gets to that point, will terminate the program. For now we just need to understand that there is, in fact, a CLR handler (the CLR used to be called com+ for some reason I am not aware of). It is also important to understand that COMPlusFrameHandler internally uses CPFH_RealFirstPassHandler to actually do the work of handling the exception.
We should now load the sos.dll so do “.loadby sos mscorwks“. This should just return you to the command prompt without any errors.
Let’s take a look at some sample code:
|
1 2 3 4 5 6 7 8 9 10 |
namespace SampleCrash { class Program { static void Main(string[] args) { throw new System.InvalidOperationException(); } } } |
This raises a new exception, so why don’t we see what the MSIL looks like? First we need the method description, so do "!Name2EE * SampleCrash.Program.Main". This shows the details we need:
|
1 2 3 4 5 |
Module: 00752f2c (SampleCrash.exe) Token: 0x06000001 MethodDesc: 007532c0 Name: SampleCrash.Program.Main(System.String[]) JITTED Code Address: 007f0070 |
Let’s now take a look at the MSIL code, “DumpIL 007532c0”
|
1 2 3 4 5 |
0:000> !DumpIL 007532c0 ilAddr = 00802050 IL_0000: nop IL_0001: newobj System.InvalidOperationException::.ctor IL_0006: throw |
This creates a new InvalidOperationException and calls the MSIL function “throw” – let’s now take a look at the assembly code for this, by taking the “JITTED code address” (007f0070) and running "!U 007f0070". Here we see that the InvalidOperationException constructor is called and then “JIT_Throw“
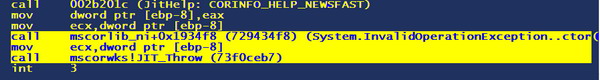
If you use the sscli code or disassemble JIT_Throw (sscli20\clr\src\vm\jithelpers.cpp or “uf JIT_Throw”) you can see that it calls “RaiseTheExceptionInternalOnly” which then calls “RaiseException“:
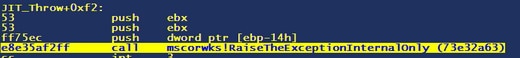

This shows us that "throw new System.InvalidOperationException();" in c# does in fact call RaiseException and shows how an exception ends up in the SEH handler.
How does the CLR handle exceptions?
When the CLR exception handling is called from a CPU exception, it needs to create a .NET exception object because a managed catch block needs a managed object derived from System.Exception. The CLR creates a specific exception based on a simple switch statement which takes the CPU exception and decides which of the CLR exceptions to raise. When the exception is created, CPFH_FirstPassHandler then stores it on the managed thread’s “throwable” property. CPFH_FirstPassHandler is then called again and at this point because the “throwable” property has an exception object, it goes through the logic of handling it. When a .NET exception is raised, the “throwable” property is already set so it doesn’t need to then create the exception.
Things to note when debugging
When debugging a managed process under Visual Studio, the exception is always translated to the .NET variant i.e. a System.AccessViolationException instead of the CPU exception code that you see in cdb i.e. C0000005 so you might think you are getting a different result running under cdb to Visual Studio, but it is actually the same. When you debug a dmp file then, because you are debugging it as if it was an unmanaged application, it is not translated.
What happens if you don’t handle an exception?
This depends on the type of application, all .NET apps have a handler higher in the SEH chain than ComPlusFrameHandler (if you want to see the chain in cdb, the command as noted earlier was “!exchain“). Console programs display the details of the exception and then exit. Windows apps close, as do services, and you may see a message written in the event log.
ASP.NET apps are most interesting because normally unhandled exceptions do not kill the process, instead they write a message to the web client, aka the yellow screen of death (this can be turned off using the web.config), a message is added to the event log and the connection is terminated but all other web clients using the same process are fine. Certain exceptions like a stack overflow may well cause the asp.NET worker process to crash, so don’t always expect your web app to continue running.
So, if you find that your application or service just stops running then there is a very high chance that you are getting unhandled exceptions. In certain versions of Windows in certain configurations, you may see the trustworthy “Dr Watson” spring into life, capture a memory dump and then ask you if you want to send it off to Microsoft to check to see if there is a known fix for it. If you choose to queue the dump until later (via the GUI or group policy) then you can grab it from C:\WINDOWS\pchealth\ERRORREP\QSIGNOFF where there may be a number of cab files with dump files in.
Memory Dumps
What is a memory dump?
A memory dump is a file containing all or part of the memory of a process. They can either be very useful or of limited use depending on how they are created, and which portions of memory they contain.
Process Memory
Let’s take a quick look at how a process is laid out and how it uses memory to give us enough detail to be able to decide which type of dumps we need and why sometimes we don’t get the detail that we need. When you start a process, the binary CPU instructions are read from the exe or dll file and copied into memory: Then, the address of the bytes are passed to the CPU to execute. This is called the code portion; we need it for debugging so as to be able to tell what the current CPU command is, and where it happened. If we have full symbols, then we can also find out the location in the source code where the current command is.
At some point in the process, we get the space for the stacks. These store .NET value types and allow both the CPU and our debugger to keep a trace of where we are exactly; by which I mean the method calls that led up to the current location. If we didn’t include the stack space in the dump, then we wouldn’t be able to tell how we ended up at a specific location and which parameters were passed in.
The last part is the heap. This is where .NET reference and large objects get created: Without these we would know what types of objects we have but without knowing the properties of those types.
How are memory dumps created?
There is an API function called MiniDumpWriteDump which helps to create memory dumps, and quite a few different applications use it to create them. In cdb it is simply a case of attaching to the process, and then running ".dump /ma c:\pathToDump.dmp". The /ma switch causes all stack space, code and the heap to be added to the file.
Other tools are DrWtsn32 (use -p then the process id), and debug diag which is used mainly for IIS based applications but can be used to create a dump of any process. One thing to note with debug diag is that it creates two files, one .dmp is just the stack portion, the second is called a .hdmp which includes the heap so it is of much more use.
Why would you debug using a memory dump?
There are two main cases where you would probably need to debug using a memory dump. The first case is that your application has had an unhandled exception and crashed, and all you have is a memory dump. The second case is where you get an exception, or a specific behaviour in a production environment, and you can’t leave a debugger attached while you troubleshoot as it could interrupt the user service. Instead you could attach cdb, create the dump file at the right place and then detach the debugger, this would mean that the application continues with only a small interruption in service. Of course, depending on your environment, this is not always possible but can be sometimes be your only option.
Let’s take a practical look at debugging using a memory dump in cdb and Visual Studio. This is from the example2.exe application which is attached to the article. It has a number of options but the one we will look at highlights why cdb is faster than Visual Studio.
First, you should start a command prompt and change to the directory with the debugging tools, then run the "doDebug.cmd" file as in the previous article (also attached in the zip file). Then “cdb -z c:\pathToDumpFile\stackOverflow.dmp”. This should open as per:
This shows that we have a mini dump with full memory, so we have the portions we need. We have an exception, in this case a “Stack overflow” exception.
We know we have a stack overflow but we don’t know if this is a managed or unmanaged problem, so let’s get a native stack trace “kf”
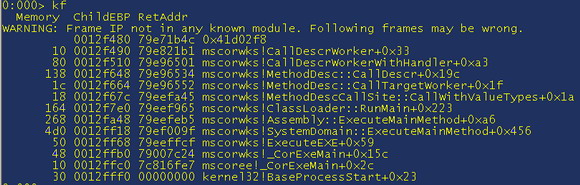
This shows that the mscorwks!CallDescrWorker method called a unknown method. The reason it is unknown is that the debugger uses the module list to determine the name of the module (do “lm” to get a module list) – because the CLR JIT’s the MSIL into assembly then there is no actual module as it is hanging around somewhere in the process.
Because mscorwks called a unknown function, then this is very likely to be a managed problem. In the stack trace above, I used kf as this shows us how much memory each stack frame is using. It actually works out the distance between two frames so the first doesn’t have a memory usage. The reason the memory is important is that there are two types of stack overflows; the first is when you create too many, or too large, objects on the stack; and the second is when a function recurses and uses up all of the memory.
So where are we? we know that it is likely to be a managed code problem, so let’s load sos.dll “.loadby sos mscorwks” and let’s get a stack trace. Note that, because this is a problem with recursion, if you do a "!CLRStack" the debugger will go mad showing frame after frame – in cdb. To stop it do “Ctrl+C” and it will interrupt the trace. A tip for using cdb is that, if you need to do something that will output a lot of data, minimise the window and it will take no time at all.
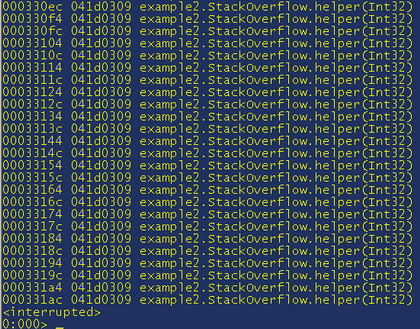
So we now have a stack trace showing the name of the function that is causing the stack overflow: If we have the source code we can examine it and see what might be going on, but let’s take a quick look at the MSIL for fun.
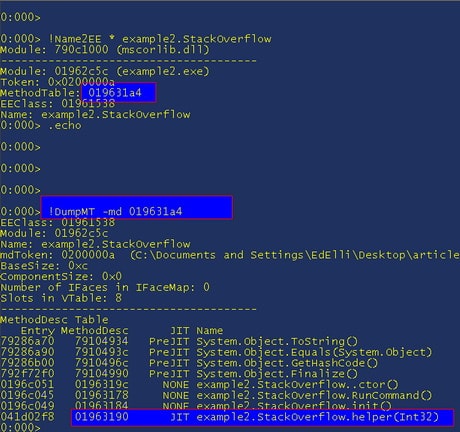
As always, we need to get the method description for the helper method; so we get the method table of the StackOverflow class by doing "!Name2EE * example2.StackOverflow“. Then we take the value from “MethodTable:” and do “!DumpMT -md 019631a4”
Then, to get the MSIL, do “!DumpIL 001963190” and we get:
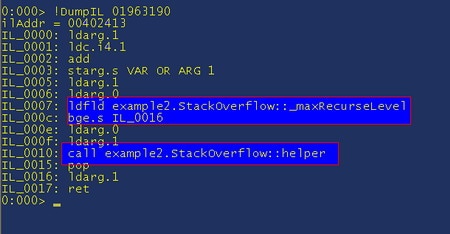
So this is interesting, "ldarg.1" grabs the first parameter, “ldc.i4.1” grabs the value 1 and the "add" adds them together; so it is incrementing some sort of counter, and then it is checking the result against _max_RecurseLevel and if it is greater than or equal to it then it quits the function ("bge.s IL_0016"). This is a fairly simple example, but now all we need to do is have a look at _maxRecurseLevel and the value passed in to see where we are.
Incidentally, these are the links for the msil documentation, when you don’t understand what the msil is doing, it is fairly simple to use msdn to see what each operator does:
Ldarg.1 http://msdn.microsoft.com/en-us/library/system.reflection.emit.opcodes.ldarg_1.aspx
Ldc.i4.1 http://msdn.microsoft.com/en-us/library/system.reflection.emit.opcodes.ldc_i4_1.aspx
Bge_s http://msdn.microsoft.com/en-us/library/system.reflection.emit.opcodes.bge_s.aspx
Add http://msdn.microsoft.com/en-us/library/system.reflection.emit.opcodes.add.aspx
Ok so let’s get back to looking at where we are and what parameters are passed in. Get ready with ctrl+c again and do "!CLRStack -a” to show all parameters and local variables:
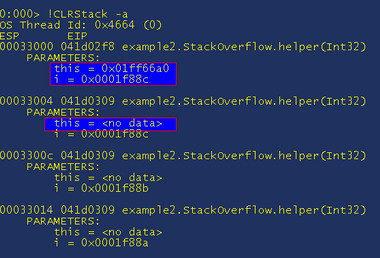
Notice how the “this” pointer is passed as a parameter, it is always first, also note how we only see it on the top method. This is because the CLR optimizes the code and instead of passing the reference on the stack which would use up more space, it stores it in a register and uses that instead. It is a CPU level optimization that means your application is faster but debugging can sometimes be harder. Let’s now dump out the value of “this” by doing "!do 0x01ff66a0"
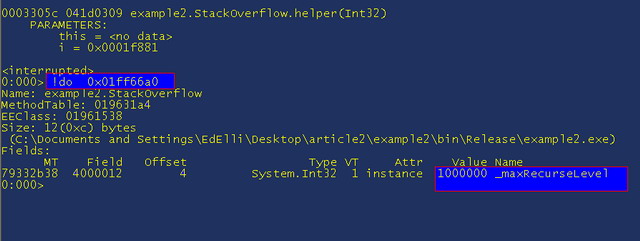
This shows us that _maxRecurseLevel is 1 million, which is probably too high, so we know what we need to do to fix it. If we want to guess an accurate figure to use then we can see the current value of the other parameter which we know increments by one each time it is run to see how many we have. The value on the first stack frame is "i = 0x0001f88c" so we just need to translate that hex number into something readable “? 0x0001f88c”
![]()
So we know it bombs out on around 130 thousand recursive calls.
What if we wanted to know how it got into the recursive function? Well we have no choice but to do a "!CLRStack" and let it finish, I would suggest adding -a so you get all the parameters and also minimising the window after you do it (remember it has 129164 frames to dump, before it gets to the rest of the code!)
If you wish to run, "!CLRStack -a" and when this has finished, which will take a moment or two, you should get:
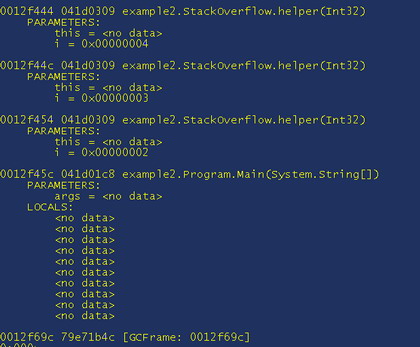
This shows us that the Main method called our helper – this isn’t strictly true if you look at the source code. Because it is a release build, a lot of code gets optimized out and also the values of many parameters have gone as well. To see all the values that are readily available and stored on the stack, or have a reference on the stack, do "!dso". Using all this information we should have enough information to track down the bug and fix it.
As promised, I said I would cover the example where possible in Visual Studio 2008. If you start up Visual Studio, go to file à open solution and browse to the dmp file. When it has loaded, go to the solution explorer and right-click the dump file. Then choose “Debug à Step into new instance”. When this starts, you will be prompted with the exception a “Stack overflow” so we know what went wrong. If you click "break" you can get into the debugger.
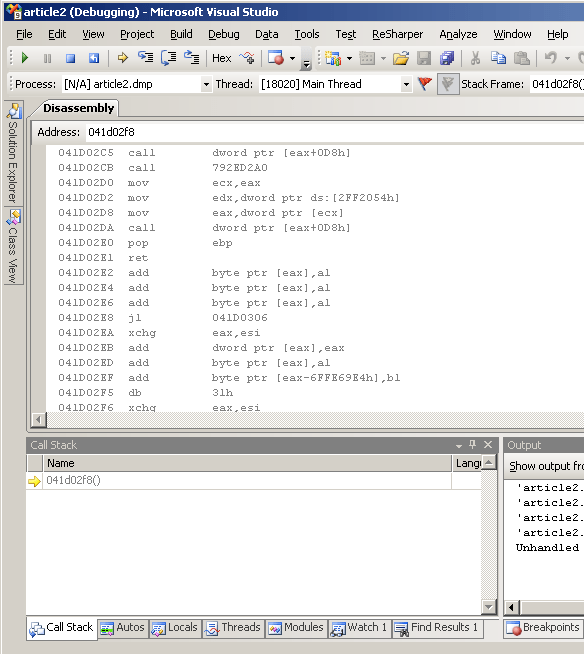
Things to note are that the call stack is wrong, it just shows one function which is obviously not right and it shows a page of disassembly, but it isn’t easy to see where you are. To find the current line you need to show the registers window, and look at the value for eip which gives the address you are currently at..
So we are unable to get a native stack trace to see where we are. Instead, let’s just go ahead and load the sos.dll and get a "!CLRStack". If you open the command window (ViewàOther WindowsàCommand Window) when this opens, if you have a “>” prompt then type "immed" to get into the immediate mode.
If you then type ".load sos" – I have to admit here that the syntax is indeed easier in Visual Studio to load sos.dll than in cdb. This should show that the dll is loaded, now do "!CLRStack -a": But be warned it will take a long time to complete, and while it is doing it you won’t be able to use it or stop it unless you kill Visual Studio. I have always killed Visual Studio after about 20 minutes, if you have a faster machine or more patience then it might well finish.
When it has finished, you can continue from where we get the trace in cdb so “!Name2EE * example2.StackOverflow” and take the value from “MethodTable:” and do "!DumpMT -md 019631a4” which then gives you the method description, which you can then run "!DumpIL" against.
Obviously this was a demo rigged in cdb‘s favour but Visual Studio really is slower and there are other times when it is noticeably so. Another one that I will go into further in a future article is the wonderful command "!DumpHeap -stat" – this is what we use to track down memory leaks as it shows a list of all the different types of objects and how much memory they are using so you can see at a glance exactly where your memory is going. Let’s do "!DumpHeap -stat" in cdb:
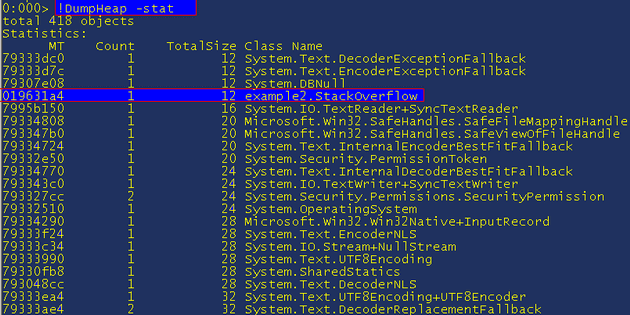
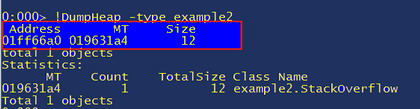
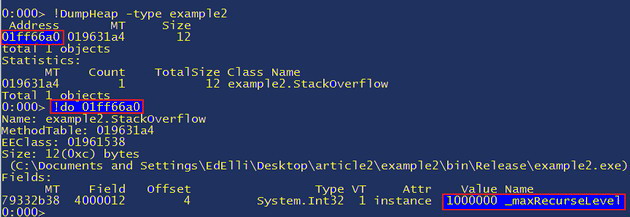
This shows us all the objects ordered by increasing memory usage, so the further down the list the more memory that type is using. In this view we get the method table, the count and also the total size. I have highlighted example2.StackOverflow because it is another simple way to get the details of a class that we want to explore further, in this case we have one instance of it so it is trivial, if it was System.String, or an often-used class, then there would be more work involved in tracking down the right one. To find specific instances of classes do "!DumpHeap -type example2" (or -type example2.StackOverflow, as it is a substring match, both will work):
If you did !DumpHeap -type System.String or some other class then, as mentioned, there would be far more than one listed. If we want to view the object we simply do “!do 01ff66a0” which is the address of the object and again we can see the value of _maxRecurseLevel:
Summary:
I have covered quite a range of topics in this article and hopefully have explained how the CLR handles exceptions in the context of the unmanaged runtime. It is important to understand how it works, because the use of exceptions within your own code is such a fundamental part of .NET programming; understanding how it works will help when you are debugging an issue in cdb and you are not even getting .NET exceptions.
If you can take a memory dump from a customer or a live production server, then it is such an easy way to fix problems because you can easily see the cause of a crash or other event. If you want an example of how these are used, Microsoft has a service where, when you get a crash, it can suggest a kb or support page to help solve the issue. Dr watson (dw20) can take a memory dump of the process, and this dump is then uploaded to their servers; then stacks are analyzed against known issues to automatically redirect you to a kb or support page to help solve the issue. Microsoft reviews the most common crashes in each product, and it is a very good way for them to fix issues that are actually affecting users. If you supply software yourselves, then I would recommend adding something to your products so you can get user memory dumps as and when necessary.
As for cdb / Visual Studio, I believe if you take the time to learn how the debugging tools for Windows work, you will find the effort pays off. I can’t promise that you will need to use the skills regularly, but I will guarantee that, at some point, they will be invaluable.
Load comments