
Microsoft’s Language-Integrated Query (LINQ) technology is fast approaching its tenth anniversary. The earliest reference I’ve found is from February, 2007, which was a lengthy article by Don Box and Anders Hejlsberg. Since then, you might think that everything that needs to be said about LINQ has been said. It hasn’t, in fact, all been said, because I need to point out in this article LINQ has at last got the Debugger it always deserved and needed, thanks to a new feature coming in the next release of OzCode. OzCode is a Visual Studio extension that improves the debugging experience immensely: It is relatively new so it is not that well known, but it has been around long enough, more than two and a half years, to prove its mettle with many developers.
Since the 2.0 release of OzCode, the development team at OzCode has focused on the flagship feature of the next release, LINQ debugging. As an early adopter of OzCode, I jumped at the chance to participate in their early access program for this upcoming release. I rarely write about products per se—I think I have done it twice in my last hundred or so articles—as I do not want to appear like a huckster for the company. But this LINQ debugging capability is so useful it really deserves the attention here. Just to be clear, I have no association with OzCode other than being an avid user. (Ed: OzCode is nothing to do with us either)
I am going to jump right in and show you how LINQ visualization works with OzCode in Visual Studio. I’ll skip my usual type of preamble that, in this case, would include discussing command pipelining, method chaining, LINQ logistics, and debugging limitations & options before OzCode. The reason is that my prior article, LINQ Secrets Revealed: Chaining and Debugging, already covers those in depth and I urge you to review that article before continuing. Though that article is six years old (to the day!), the vast majority of it is still relevant today. And it is a great stepping stone for today’s topic. In fact, to show the improvements provided by OzCode I am going to continue the same set of examples.
Visualizations Before OzCode
The first code sample is the simple LINQ chain in ProcessWordList1. (This code is available in the LinqMethodChaining project of the LinqDebuggingWithOzCode solution attached to this article.)
|
1 2 3 4 5 6 7 8 9 10 11 12 13 14 15 16 17 18 19 20 21 22 23 24 |
class Program { static readonly string[] Words = {" KOOKABURRA", "Frogmouth", "kingfisher ", "loon", "merganser"}; static void Main() { var newWords = ProcessWordList1(Words); foreach (var word in newWords) { Console.WriteLine(word); } Console.ReadLine(); } private static IEnumerable ProcessWordList1(string[] words) { return words .Select(word => word.Trim()) .Select(word => word.ToLower()) .Where(word => word.StartsWith("k")) .OrderBy(word => word); } } |
In the prior article, I showed how to instrument that code to inject watchers that would allow a very crude visualization on the console. In Figure 1, you can see movement of each input element through the LINQ chain. The output on the left comes from injecting the custom EnumerableDebugger with default settings, whereas the output on the right shows the same thing with some customization arguments passed in.
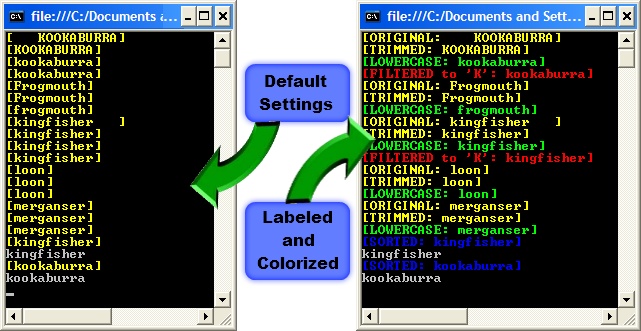
Figure 1
The figure—particularly the right side—certainly provides useful information, but it requires extensively instrumenting your code to get that output, and even then it is console output rather than something that is available in the debugger.
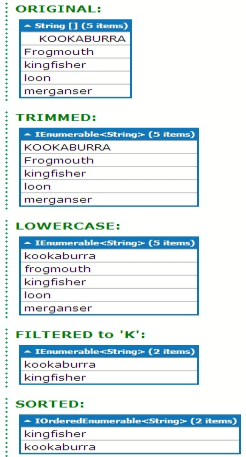
Figure 2
The next step I introduced was to take the code over to Joseph Albahari’s LINQPad, a very handy sandbox for sketching out your code, because its forte is LINQ visualization. In Figure 2, you have a clearer picture of the data moving through the LINQ method chain, but this also has a number of drawbacks. First, it is divorced from Visual Studio completely so quite disruptive in terms of workflow: You need to copy code from Visual Studio into LINQPad. You also have to manually instrument the code with LINQPad’s Dump method to output the visualizations. Here’s what it looks like:
|
1 2 3 4 5 6 7 8 9 10 11 12 13 14 15 16 17 18 |
string[] Words = new string[] { " KOOKABURRA", "Frogmouth", "kingfisher ", "loon", "merganser" }; Words .Dump("ORIGINAL:") .Select(word => word.Trim()) .Dump("TRIMMED:") .Select(word => word.ToLower()) .Dump("LOWERCASE:") .Where(word => word.StartsWith("k")) .Dump("FILTERED to 'K':") .OrderBy(word => word) .Dump("SORTED:"); |
The final approach I offered in my previous article was that of using Robert Ivanc’s LINQPad Visualizer, a plug-in of sorts for Visual Studio that lets you generate the same LINQPad visualizations within Visual Studio using the Watch window. That technique allowed you to stay in Visual Studio, and also removed the impediment of having to decorate the code (i.e. it did not require adding the Dump method calls), but I assume it never really garnered enough interest as the web page shows support only through Visual Studio 2012.
All of these debugging techniques are ways to dance around the true issue; needing to visualize a LINQ chain in situ. That is, ideally it should require no code instrumentation, should allow interacting with a LINQ chain with the same ease that Visual Studio allows you when interacting with variables and objects while stopped at a breakpoint. Let’s explore how OzCode delivers this experience.
OzCode: A First Look at LINQ Exploration
In Figure 3, I am in the debugger in Visual Studio 2015 and have just stepped onto the return statement of ProcessWordList1. Visual Studio has highlighted the entire LINQ chain in yellow.
The first thing to notice, unrelated to LINQ, is the decoration of the method signature, that string[5] above the parameter sitting in a shallow tray. That is OzCode’s standard Heads Up display. Like its namesake from the automotive industry, it is a feature that presents data right in front of you, so you do not have to look in your Locals window, Watch window, etc. Here it is just letting us know the passed in array has five elements. More on that shortly.
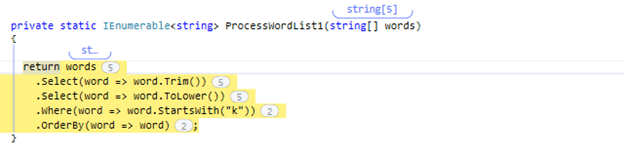
Figure 3
The second thing to notice is that each expression in the LINQ chain is decorated with a numerical marker, e.g. ![]() . Those numbers indicate how many elements are in the sequence at that point in the chain. In other words, the source (words) starts with five elements then goes through a couple Select expressions. Since Select does not change the cardinality of a sequence, it shows five on both of those as well. Then, the Where expression filters the list down to two, and OrderBy maintains that list size, also showing two elements.
. Those numbers indicate how many elements are in the sequence at that point in the chain. In other words, the source (words) starts with five elements then goes through a couple Select expressions. Since Select does not change the cardinality of a sequence, it shows five on both of those as well. Then, the Where expression filters the list down to two, and OrderBy maintains that list size, also showing two elements.
Note that, if the size or complexity of your sequences are great enough, OzCode will not automatically execute the sequence in case that impedes Visual Studio’s responsiveness. When OzCode detects that this might happen, you will see a question mark ![]() rather than a number in each marker; clicking on any one will evaluate the sequence and fill in the numbers.
rather than a number in each marker; clicking on any one will evaluate the sequence and fill in the numbers.
Next I click on the first marker, shown by the arrow I have added on the left side of Figure 4.
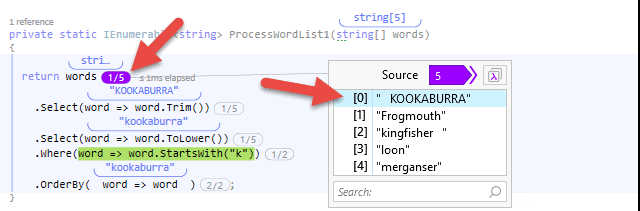
Figure 4
The action of clicking on that marker …
- Inverts the colors and darkens the selected marker to show it is the current sequence in the chain.
- Changes the contents of the marker to show both the position of the current element in the current sequence and the length of that sequence.
- Opens a DataTip-like window enumerating the current sequence.
- Activates the current sequence so you can navigate around it with the mouse or the arrow keys.
Note carefully the distinction between current sequence and current element in the above.
In Figure 4, the current sequence is the list of data elements as it exists at some point in the LINQ chain. I clicked on the very first marker, so the current sequence at that point is just the input (or source as OzCode prefers to call it), which is the contents of the variable words. That’s just what you see in the DataTip on the right of the figure.
A current sequence always has to have a current element, i.e. one member of the sequence that is highlighted and notated in some fashion. When you click on a sequence and activate it, the first element in that sequence automatically becomes the current element. Thus, the ![]() expression you see in the marker that I just clicked on means the first element in the sequence is the current element and there are five elements in the current sequence. Over on the right of the Figure 4, the second arrow I have added is pointing to the current element—the first element at the moment—that, from a list perspective, is at index zero.
expression you see in the marker that I just clicked on means the first element in the sequence is the current element and there are five elements in the current sequence. Over on the right of the Figure 4, the second arrow I have added is pointing to the current element—the first element at the moment—that, from a list perspective, is at index zero.
Walking through Elements
To recap Figure 4, the current sequence is just the input, words. The current element is the first element, “ KOOKABURRA” (with some extra leading spaces). So now let’s advance to the next element in the current sequence. There are three ways to do that:
- Press the down arrow key to advance to the next element.
- Hover over the marker and use your mouse wheel to scroll down the list.
- Click on the second element in the DataTip.
Whichever technique you use to do this, the marker values and the DataTip highlight remain in sync, advancing in lockstep together. The arrows in Figure 5 shows that I have now bumped the current element to the second value in the input but have not changed the current sequence
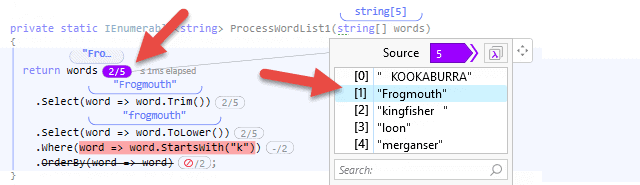
Figure 5
Note that if your sequence is long enough, the DataTip will show a vertical scrollbar. You can then hover over the DataTip and use your mouse wheel to scroll up and down in the list, but it will not affect the current element, only the portion of the sequence that you are viewing.
Now I want to draw your attention back to the source code, jumping back to Figure 4 (that’s 4, not 5). Notice the Heads Up display in Figure 4 shows the transformations of the first element as it progresses through each sequence! So in the figure, you see just above the first Select expression (which does a Trim) the leading spaces on “ KOOKABURRA” have been stripped off. In the second Select, which does a ToLower, it shows that the value has indeed been converted to lower case, and it remains that way through to the OrderBy expression. Similarly, in Figure 5 now, you see the transformations of the second element in the sequence. But here a curious thing happens: the second element does not pass the filter embodied by the Where expression: since it no longer exists in the list after the Where is executed, there is no position in the list to report, hence the ![]() marker. That represents the fact that there was input but no output. Whereas in the final sequence, the OrderBy, there is not even any input—with respect to the current element—so that is represented as a null in the marker (
marker. That represents the fact that there was input but no output. Whereas in the final sequence, the OrderBy, there is not even any input—with respect to the current element—so that is represented as a null in the marker ( ![]() ).
).
Also note that the green shading represents a true result (Figure 4) and red shading represents a false result (Figure 5) on the Boolean expressions. Those expressions are trivial here but OzCode will individually color-code each Boolean sub-expression in a complex expression so you can see at a glance what is happening. Figure 6 is taken from OzCode’s web site. Here you can instantly see what was true and what was false. (And the Simplify tool even allows you to walk through the Boolean expression tree to analyze its components further, should you need to.)
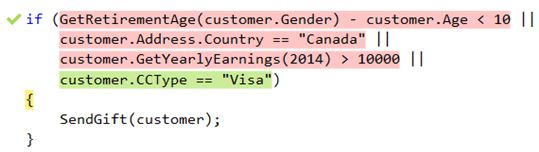
Figure 6
Walking Through Sequences
The previous section described how to move between elements in the current sequence. To move among the different sequences, there are again several options.
First, you can click the marker adjacent to a given sequence in the code. That will move the element highlighting to that marker and update the DataTip context to display the selected sequence. (Actually, you do not even have to click; just hovering over a marker is sufficient!)
Second, inside the DataTip you can effectively see two sequences—the input and output of any given LINQ method in the chain. For example, in Figure 7 I have hovered over the Select expression that calls Trim and the DataTip shows the output of that Select.
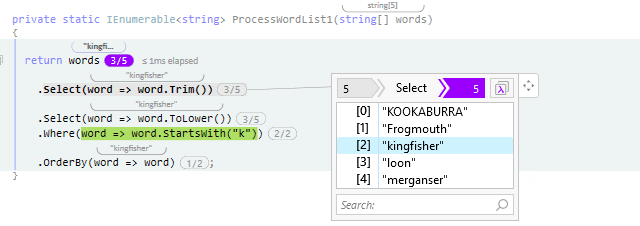
Figure 7
But inside the DataTip you can switch to showing the inputs, effectively showing the sequence prior to the current sequence. In Figure 8 I have clicked on the input icon of the Select in the DataTip—just where the red arrow is pointing. So the highlighting of the top bar in the DataTip has moved from the output (Figure 7) to the input (Figure 8), and the body of the DataTip in Figure 8 correspondingly shows the input list (notice the extra leading spaces on element 0 and extra trailing spaces on element 2).
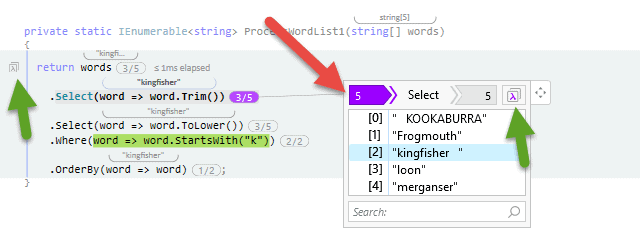
Figure 8
The final approach to moving among sequences is with the LINQ analysis window. Open the LINQ analysis window by pressing either lambda button highlighted with the green arrows in Figure 8; the result appears in Figure 9.
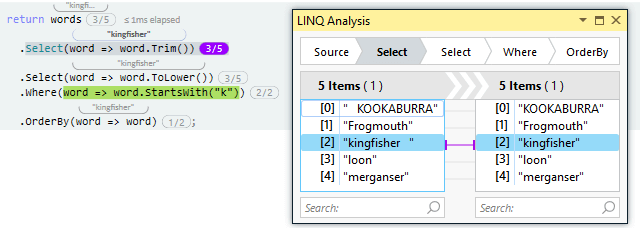
Figure 9
The added benefit you get from this LINQ analysis window is that you can see each LINQ sequence along with the input and transformations that created that sequence. That is, you see both the input and output sequences (or the “before” and “after” if you prefer), and you see precisely how the input elements map to the output elements with connecting lines. Those connecting lines are faint grey except for the current element, which is highlighted in purple—the same current element still shown in the code in the main editor window! Yes, even though this is now a first-class window rather than just a DataTip, it is still intimately tied to your code. If you select a different current element in the code, it reflects in the window, and vice versa.
Similarly, notice that the current sequence is highlighted in the LINQ analysis window in the top bar of LINQ keywords—the first Select in this case. That same Select expression is also highlighted in the code editor. If you select a different LINQ keyword in the window it is reflected back in the code, and vice versa. To navigate amongst the different LINQ sequences in the analysis window, just click on one of those keywords in the top row.
The mapping in Figure 9, though, is rather uninteresting: a Select is just a one-to-one mapping. In Figure 10, though, where I have clicked on the Where expression, the mapping provides much more useful information. Here you can see for the entire sequence which elements passed the filter and which did not, along with how their positions shifted in the sequence.
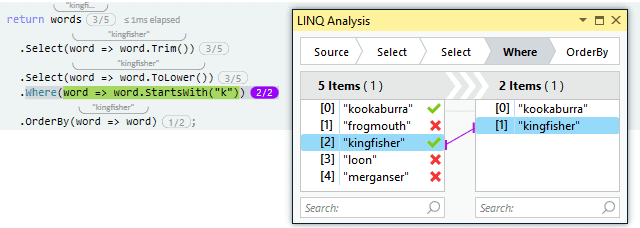
Figure 10
More on the LINQ Analysis Window
In this next example, taken from the samples provided when you install OzCode, the code uses a SelectMany, a LINQ operator that is less familiar and thus a bit less intuitive to understand at first glance. Figure 11 shows the code.
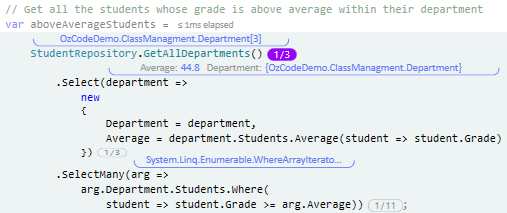
Figure 11
The first thing to notice is the Heads Up display on the code. From that you can see that there are 3 departments, and the average for the first department is 44.8. If you walk through the sequence, you’ll see the averages for each of the departments there. We’ll come back to the code in a bit to see what more we can glean in a moment. But first, take a look at the LINQ analysis window for this code in Figure 12. Here I have opened up the SelectMany sequence.
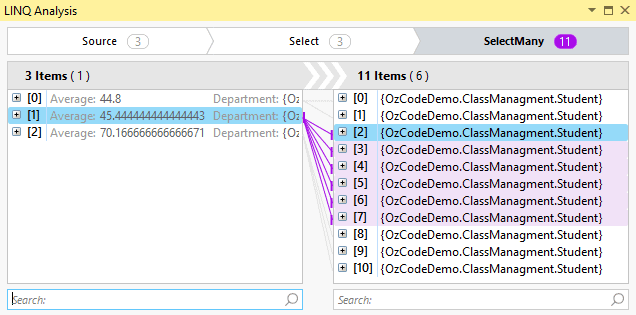
Figure 12
This helps you visualize what a SelectMany actually does. The second element (index 1) on the input side expands into 6 elements (indices 2 through 7) on the output side. But theStudent instances listed in the output are not providing any useful information. Because the Student class does not have an override for the ToString method you just see the class name repeatedly. Here we leverage another base OzCode feature (i.e. independent of the LINQ capabilities) called Reveal. In Figure 13 I have expanded the fourth item in the output (nothing special about the fourth one; any one will do). I have also clicked on the star next to the Grade and Name properties so those have changed from grey to gold.
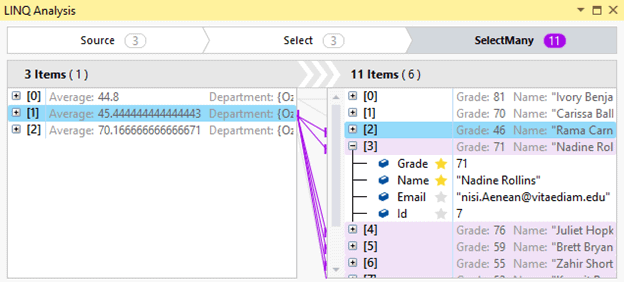
Figure 13
As soon as I did that, notice what happened not just to that fourth element but to every element on the output side in Figure 13: the properties I selected have effectively generated a ToString method for the Student class on-the-fly! And that information is not transient; you can close the LINQ analysis window, close the project, even close Visual Studio… the next time you open up a Student, whether in the LINQ analysis window or in a standard Visual Studio DataTip, those same properties will still be used instead for its ToString representation.
The way that Reveal works illustrates how well OzCode has integrated all of its capabilities into a cohesive whole. Just like I selected properties to override the ToString method for Student, I went back to the Select sequence in the LINQ analysis window, and selected the Name property to override the ToString method forDepartment instances. Figure 14 shows how that reflects in the Heads Up display back in the code editor. Compare that to how you just saw class names in Figure 11.
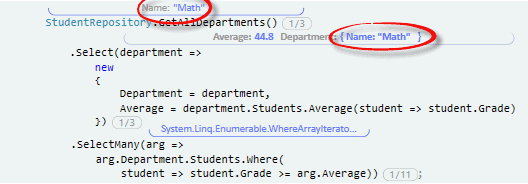
Figure 14
Exception Handling
OzCode also provides excellent support in the case of exceptions. In Figure 15 I have modified OzCode’s demo code to force an exception (notice that I nulled out the Name property of one item at the top of the code). In the figure, I have just stepped onto the entire LINQ chain in the debugger. Before it is even executed, OzCode warns you about an impending NullReferenceException at the top. It also tells you which sequence has the issue: notice the second marker—on the Select sequence—is in red ( ![]() ).
).
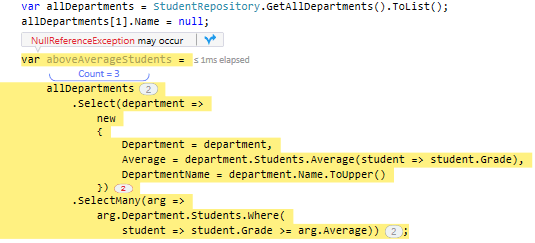
Figure 15
To dig further, open up the LINQ analysis window and it confirms the problem on that Select sequence with the warning icon that I have circled near the top of Figure 16. Examining the output side of the sequence contents, you see the typical text associated with a null reference (“Object reference not set…”) , so tracing back to the input, I have expanded that element in the sequence and found a null value, which I’ve also circled in the figure.
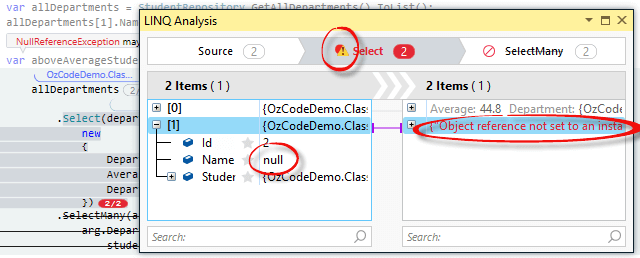
Figure 16
A Rock and a Hard Place
OzCode’s new LINQ debugging capability is tremendous, no doubt about it. But it is not a panacea; it is still constrained by Visual Studio’s own modeling capability. As a case in point, Figure 17 shows another example from my earlier article. This code comes from an open-source application I wrote called HostSwitcher. In a nutshell, HostSwitcher lets you re-route entries in your hosts file with a single click on the context menu attached to the icon in the system tray. I discussed the LINQ debugging aspects of this code in the same article I mentioned previously, LINQ Secrets Revealed: Chaining and Debugging, but if you want a full understanding of the entire HostSwitcher application, see my other article that discusses it at length, Creating Tray Applications in .NET: A Practical Guide.
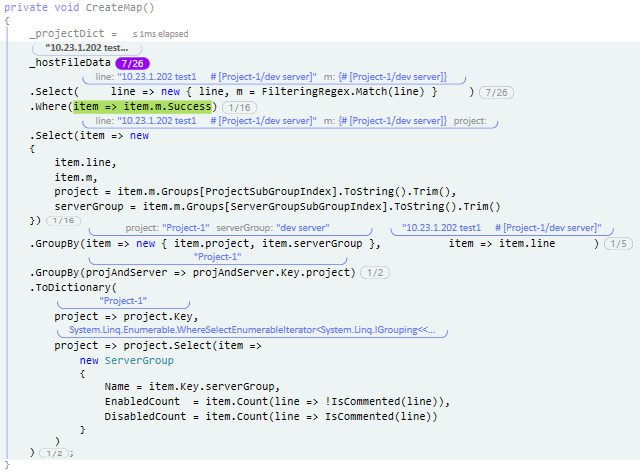
Figure 17
The result of the code in Figure 17 is a dictionary. The key is a project name and the value is a list of ServerGroup objects. A ServerGroup object contains the name of a server and the number of IP addresses that are enabled or disabled on that server at any given instant. I am sure this verbal description is not completely satisfying; you likely have a general idea what I mean, but I doubt if you have a very good mental image of it. Looking at the Heads Up data in Figure 17, you can see a project name, but you do not get much regarding the list of ServerGroups. So let’s open up the DataTip for the ToDictionary sequence (Figure 18). Because I have already expanded items in the DataTip and circled the crucial values you can quickly get a much better idea of what is going on.
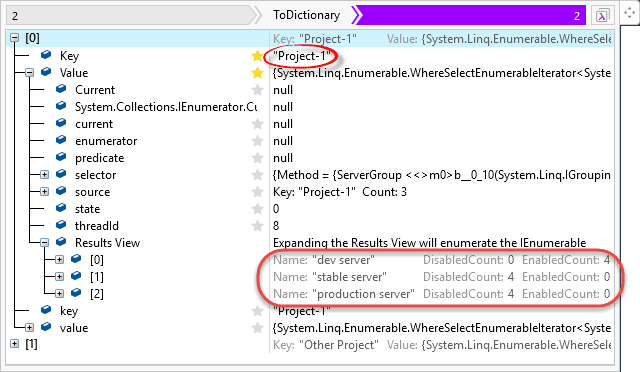
Figure 18
There is useful information here but mixed in with superfluous information that we really do not care about. Is there a more concise, visually rich way to see the data? Yes, but alas, not from OzCode. Figure 19 shows a very concise visualization of all and only the data we care about, generated by LINQPad.
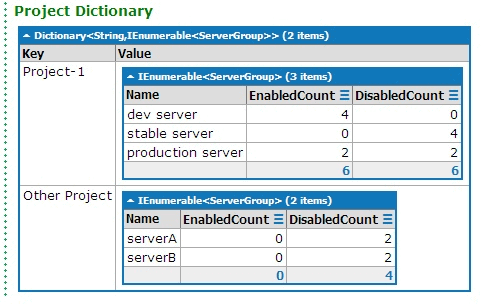
Figure 19
But remember the trade-offs mentioned early in the article: LINQPad is separate from Visual Studio and you have to instrument the code with Dump calls. The latter is simple, as is copying your code into LINQPad, but feeding it your data may not be a trivial task!
Conclusion
Ten years on from the introduction of the magic of LINQ to .NET software development, OzCode delivers a debugging experience that LINQ always deserved. From the Heads Up display you can see how a single element transforms through an entire LINQ chain; and from DataTips you can see all the values in one sequence at one time. Additionally, with the LINQ analysis window, you can see all the values of two sequences at one time. Arguably, the only missing feature in OzCode is showing all the values through all the sequences in one window, but that is more a limitation of screen real estate. Nonetheless, this new LINQ debugging capability should provide a great productivity boost to any software development effort.
Final notes: First, be aware that I wrote this article using a pre-release edition of OzCode, so features are of course subject to change in the final version. Also, I did find a few minor bugs in the course of my evaluation that I’ve since reported to the development team—minor enough that they do not even warrant going into any details here—and I have high hopes that those will also be fixed in the final version.
This document contains proprietary information and is protected by copyright law.
Copyright © 2026 Red Gate Software Limited. All rights reserved
Load comments