

SQL Server exposes three DMV families that together support practical index tuning. This article walks through each DMV with specific T-SQL queries for common diagnostic questions.
The three DMV families exposed are:
(1) sys.dm_db_index_usage_stats – aggregate statistics on how each index has been used since server start (seeks, scans, lookups, updates), letting you identify indexes that are maintained but never read (candidates for removal) and indexes that are heavily used (candidates for optimization);
(2) sys.dm_db_index_operational_stats – detailed operational metrics per index (latch waits, lock escalations, row locks vs page locks, allocation-unit activity), surfacing contention hotspots that usage stats don’t reveal;
(3) the missing-index family (sys.dm_db_missing_index_details, _columns, _groups, _group_stats) – the optimizer’s own record of indexes it wished existed during query compilation, ranked by estimated impact.
And some of the common diagnostic questions we will answer include:
- Which indexes have never been accessed?
- Which indexes are maintained but not used?
- Which indexes are being updated more than read?
- Which indexes have lock-escalation problems?
- Which missing indexes would most benefit the workload?
Note: The DMVs are cumulative since server start, so results need interpretation in that context. Newly-created indexes will show low usage until the workload that needs them runs; a restart clears the counters. For ongoing index monitoring, consider persisting DMV snapshots to a logging table to build historical trend analysis.
Introduction
Defining an effective indexing strategy is the only way to ensure that the most significant and frequent queries in your workload are able to read only the required data, and in a logical, ordered fashion, thus returning that data quickly and efficiently, with minimal I/O. However, finding the correct balance between too many and too few indexes, and having the “proper” set of indexes in place, is a delicate art. It requires sound knowledge of the database design, how the data within the tables is distributed, and of the typical query patterns.
This is why the indexing-related set of Dynamic Management Objects (DMOs) is probably the most widely used of any category. The indexing DMOs, all of which have names starting with sys.dm_db_, can help the DBA answer such questions as the following (some of the relevant DMOs are indicated in brackets).
- Are there any indexes that are no longer in use, or have never been used? (index_usage_stats)
- For indexes that are in use, what is the usage pattern? (index_operational_stats)
- Which indexes are missing? (missing_index_details, missing_index_group_stats)
In this article, we’ll describe, by example, how to answer these questions using the DMOs.
Index Strategy Do’s and Don’ts
Well-designed SQL code will “touch” as few times as possible the data in the base tables, return only the set data that is strictly needed to satisfy the request, and will then use efficient set-based logic to manipulate this data into the required result set. However, regardless of how intelligently we design our SQL, it will still read more data than is necessary, and perform poorly, unless we also make intelligent use of indexes. Even if our query diligently returns only the required 20 rows, from three columns, in a 100,000-row table, it may still cause the query engine to scan the whole table (or clustered index) just to retrieve the 20 we need.
While indexes can and will increase efficiency and performance in query resolution, the wrong index can be just as bad as the right index is good. If an index is not used, it still incurs the overhead on any write operation: the engine must write to the index each time we insert update or delete records in the underlying table or view. This activity results in fragmentation that, over time, the DBA must be reactively correct by index rebuilds or reorganizations. All these actions consume vital system resources. That’s why it is important to walk the thin line that lies between too few indexes and too many. At the same time, we also need to factor into the mix that the indexes we do create are the right ones for the encountered load.
Unfortunately, every DBA has encountered many situations where indexing is either entirely absent or entirely chaotic. Personally, I’ve come across the following on many occasions:
- every column is indexed individually
- the same column participates in three or more composite keys, and is also indexed individually
- no primary key is defined, but just about all columns have non-clustered indexes defined on them.
In short, it’s one heap of a mess, but we can’t just leap in and remove indexes that our “gut instinct” tells us are not required. In SQL Server 2005 and later, via the indexing DMOs covered in this article, we DBAs now have proper insight into the indexes that are used and those that the optimizer is ignoring. This removes the “gut feel” factor from the process of cleaning up incorrect, unused, and downright ignorant indexes.
However, before we start examining the scripts that we can use to uncover this information, it’s worth stating up front that blindly following the advice offered by these DMOs is not the right way to go, either. As noted earlier, defining an effective indexing strategy is a delicate art and one that requires sound knowledge of your database design, how the data within the tables is distributed, and how that data is queried, typically. It is beyond the scope of this article to provide a full tutorial on how to determine an effective set of indexes, but having covered some of the things we don’t like to see, it’s worth taking just a brief look at some of the things we do like.
Clustered indexes and PKs
More or less every table in SQL Server should have a clustered index to allow efficient searching of the data in that table. You can either cluster on a key that naturally reflects the way the data will be queried, or you can cluster on a narrow, ever-increasing integer key (to minimize subsequent fragmentation) and use non-clustered indexes for query efficiency. Most of the advice out there points to the latter approach but, regardless, most tables should have a clustered index and every table should have primary key (which may or may not be the clustered index).
Covering indexes
A covering index is one that contains all of the columns and data required by a query. This means that any columns used in join or search conditions are included in the index, along with any columns that are simply selected. The latter should be included, as INCLUDE columns, rather than as part of the actual index. If an index covers a query, it means that the optimizer can return the data entirely from the index, without the need to perform a dreaded table scan, or “key lookup,” to get any non-covered data from the clustered index. This results in fewer reads, and is usually the quickest, most efficient way to return the data. The “usually” qualification is there because, even if an index exists that that you think a query should be using, there is no guarantee that the optimizer will choose to use it.
High selectivity
If you’ve chosen a low selectivity column for the index key (i.e. where each key value matches many rows), then the optimizer may decide to perform a table scan to return a piece of data. Table scans have a bad reputation, but this is because it often means reading a huge number of rows; in small tables, scanning all the rows is sometimes quicker than reading the data from the leaf levels of an index.
You’re looking for selective columns to form your index key and, certainly, the leading (first) column should be selective. However, this does not mean each index should start with the PK column; it must be a column that is likely to get searched on. You can find a good discussion of index selectivity and column ordering here: http://sqlserverpedia.com/wiki/Index_Selectivity_and_Column_Order.
Neither too many nor too few
The drive to cover queries does not mean you should simply create an index for every query in your workload. If a table contains many rows and is subject to frequent modifications, the presence of numerous indexes will significantly slow down these modifications, as SQL Server must maintain the data in both the index and the underlying table.
Examine the workload characteristics for a given table, as this will affect how many indexes you might want to have per table. If a table is pretty static, you can get away with more indexes, but on tables subject to frequent updates, you’ll want as few as you can get away with.
Narrow indexes (within reason)
Neither does the drive to cover queries mean that you should create huge, 16-column indexes in an attempt to “cover everything at once;” if your index key values are wide, you’ll fit few on a page, your index will take up a lot of space, and scanning it will be inefficient. Searching on narrow index keys is much quicker.
Again, though, it is a balancing act; having a huge number of single column indexes is a bad idea, too. Your goal is to make your indexes as narrow as possible while being usable by as many queries as possible. For example, if users search on employees’ last names, an index on the LastName column is probably a good idea. If users also sometimes qualify the search with first names, then create a single index on (LastName, Firstname) as this will satisfy both queries.
Using the Indexing DMOs
Amongst many other things, the query optimizer in Microsoft SQL Server caches metadata pertaining to the use of existing indexes. Whenever the SQL Server service restarts, this information is lost, so we recommend you store it in a persisted table in order to maintain a rich, deep set of data for performance tuning. Otherwise, the queries we are going to create in the remainder of the article will force you to make decisions on the long-term structure of your instance using data that may be only days or hours old; we would never advocate making such decisions with such weak data. We will proceed on the basis that you have sufficient days of data available when running these queries and making the decisions that you intend to, once these queries are returning data for your attention.
The Indexing System Catalog Views
Occasionally, we will need details of the indexes and objects under investigation, such as an index name or the data type of a column in the index, which are simply not available from the DMOs. On these occasions, we’ll need to join to the system catalog views to retrieve this data. For example, we might use sys.indexes to return index identifiers (e.g. index name) and configuration settings (e.g. fill factor), or sys.columns (sys.index_columns), to find out details about specific columns in the index, such as their length, data type and so on.
Investigating index usage (index_usage_stats)
In this section, we’ll use the DMV sys.dm_db_index_usage_stats, along with various system catalog views, to obtain statistics on how our indexes have been used to resolve queries. This DMV provides, in particular, the following columns for each index:
- database_id – ID of the database
- object_id – identifies the table or view to which the index belongs, unique only at the database level
- index_id – index ID, unique only to the scope of the object_id; an index_id of 0 signifies a heap (no clustered index on the table); an index_id value of 1 is always associated with the clustered index on the table, whereas index_id values greater than 1 are reserved for non-clustered indexes
- user_seeks – the number of times the index has been used in a seek operation (to find a specific row)
- user_scans – number of times the index has been used by scanning the leaf pages of the index for data
- user_lookups – for clustered indexes only, this is the number of times the index has been used in a “bookmark lookup” to fetch the full row; this is because non-clustered indexes use the clustered indexes key as the pointer to the base row
- user_updates – number of times the index has been modified due to a change in the table’s data.
For each of the user actions (user_* columns), there is also a corresponding last_user_* column (e.g. last_user_seek), which records the date and time the action last occurred. Also, there is a system_* and last_system_* equivalent for each of these columns, providing statistics regarding use of the index by a system operation.
Data in this DMV is cumulative, and is refreshed when the server is restarted or when the index is dropped and recreated. Statistics live on when an index is rebuilt or reorganized, and even when it is disabled and rebuilt. Queries against this DMV return all indexes (including heaps and the clustered index) that have been read or written to at least once. If an index exists but has never been used since creation, or since the statistics were refreshed, then there will be no entry for this index row in sys.dm_db_index_usage_stats. It’s an instance-wide DMV and so will return indexes for every database on the instance, but you will almost always want to limit it per database, using the database_id to retrieve the index names for that database, via sys.indexes (as shown in Listing 1). Note also that the DMV does not distinguish between partitions, so if an index is physically manifested in two or more partitions, the DMV only returns a single record.
Listing 1 provides a listing of indexes for the database that have been used at least once during a query execution, with those indexes that have been scanned the most listed first. A high number of scans may indicate a need to update your statistics for a given table or index. However, equally, a high number of scans will result if the query optimizer decides that the table is small enough that it is quicker to scan the index rather than perform a seek operation. Hence, the output of this query should not be considered in isolation, but rather in conjunction with data regarding the selectivity and the size of the index (which can be returned via a query against sys.dm_db_index_physical_stats, covered later in the article).
|
1 2 3 4 5 6 7 8 9 10 11 12 13 14 15 |
SELECT OBJECT_NAME(ddius.[object_id], ddius.database_id) AS [object_name] , ddius.index_id , ddius.user_seeks , ddius.user_scans , ddius.user_lookups , ddius.user_seeks + ddius.user_scans + ddius.user_lookups AS user_reads , ddius.user_updates AS user_writes , ddius.last_user_scan , ddius.last_user_update FROM sys.dm_db_index_usage_stats ddius WHERE ddius.database_id > 4 -- filter out system tables AND OBJECTPROPERTY(ddius.OBJECT_ID, 'IsUserTable') = 1 AND ddius.index_id > 0 -- filter out heaps ORDER BY ddius.user_scans DESC |
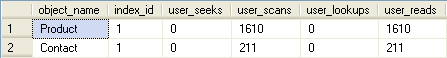
Listing 1: Usage stats for indexes used to resolve a query.
You will see that, in this query and all the ones that follow, we use the following formula to calculate the total number of times that the index is used by the optimizer to resolve a user query:
|
1 |
[user_seeks] + [user_scans] + [user_lookups] = [user reads] |
The user_updates column on its own provides the total number of times the index has been updated as a result of data modifications (writes). From a performance tuning perspective, this DMV is invaluable as it shows exactly how the indexes are being used and, critically, it tells us something that no previous version of SQL Server did: which indexes are not being used or, more pertinently, not being used but being updated frequently. A similar calculation can be used to get the total system reads of an index. However, we’ll ignore any system activity from this point forward as it is almost always negligible in comparison to user-driven activity.
Over the coming sections, we’ll present scripts to:
- find indexes on your system that have never been read or written
- find indexes that have never been read but are being maintained (i.e. updated in response to modification of the underlying table data)
- get detailed read/write stats on all indexes, looking for those where the maintenance burden may outweigh their usefulness in boosting query performance.
These indexes are candidates for removal, after thorough investigation. You should never blindly drop indexes, and you must be certain that an index really isn’t used (e.g. by infrequent, yet critical, monthly or quarterly reporting queries) before dropping it.
Identify indexes that have never been accessed
Listing 2 uses sys.indexes and sys.objects to find tables and indexes in the current database that do not show up in sys.dm_db_index_usage_stats. This means that these indexes have had no reads or writes since SQL Server was last started, or since the current database was closed or detached, whichever is shorter.
|
1 2 3 4 5 6 7 8 9 10 11 12 |
-- List unused indexes SELECT OBJECT_NAME(i.[object_id]) AS [Table Name] , i.name FROM sys.indexes AS i INNER JOIN sys.objects AS o ON i.[object_id] = o.[object_id] WHERE i.index_id NOT IN ( SELECT ddius.index_id FROM sys.dm_db_index_usage_stats AS ddius WHERE ddius.[object_id] = i.[object_id] AND i.index_id = ddius.index_id AND database_id = DB_ID() ) AND o.[type] = 'U' ORDER BY OBJECT_NAME(i.[object_id]) ASC ; |
Listing 2: Finding unused indexes.
If SQL Server has been running long enough for you to have a complete, representative workload, there is a good chance that those indexes (and perhaps tables) are “dead,” meaning they are no longer used by your database and can potentially be dropped, after some further investigation.
Identify indexes that are being maintained but not used
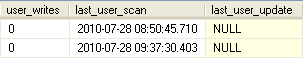
Listing 3 identifies clustered and non-clustered indexes that are consuming resources, in terms of writes and maintenance, but are never being selected for use by the optimizer, so have never been read, at least since the last time the cache was cleared of accumulated usage data. It uses a fully-qualified naming convention and is identified as “statement”, in order to conform to the output that you will see when querying the missing indexes DMOs. We identify the name of the index via a join to the sys.indexes system catalog view, on the object_id and index_id columns and we join to the sys.partitions system view on the same columns in order to return the total_rows metric (the total number of rows in the index).
|
1 2 3 4 5 6 7 8 9 10 11 12 13 14 15 16 17 18 19 20 21 22 23 24 25 26 27 |
SELECT '[' + DB_NAME() + '].[' + su.[name] + '].[' + o.[name] + ']' AS [statement] , i.[name] AS [index_name] , ddius.[user_seeks] + ddius.[user_scans] + ddius.[user_lookups] AS [user_reads] , ddius.[user_updates] AS [user_writes] , SUM(SP.rows) AS [total_rows] FROM sys.dm_db_index_usage_stats ddius INNER JOIN sys.indexes i ON ddius.[object_id] = i.[object_id] AND i.[index_id] = ddius.[index_id] INNER JOIN sys.partitions SP ON ddius.[object_id] = SP.[object_id] AND SP.[index_id] = ddius.[index_id] INNER JOIN sys.objects o ON ddius.[object_id] = o.[object_id] INNER JOIN sys.sysusers su ON o.[schema_id] = su.[UID] WHERE ddius.[database_id] = DB_ID() -- current database only AND OBJECTPROPERTY(ddius.[object_id], 'IsUserTable') = 1 AND ddius.[index_id] > 0 GROUP BY su.[name] , o.[name] , i.[name] , ddius.[user_seeks] + ddius.[user_scans] + ddius.[user_lookups] , ddius.[user_updates] HAVING ddius.[user_seeks] + ddius.[user_scans] + ddius.[user_lookups] = 0 ORDER BY ddius.[user_updates] DESC , su.[name] , o.[name] , i.[name ] |
Listing 3: Querying sys.dm_db_index_usage_stats for indexes that are being maintained but not used.
I ran this query recently in my production environment against a database supplied and administered by a third party; I knew I would see some scary things, but was amazed when it returned over 120 indexes that had not been read. It is possible, at the same time as listing these high write / zero read indexes, to generate the commands to drop them, simply by inserting the following at the end of the SELECT clause:
|
1 2 |
'DROP INDEX [' + i.[name] + '] ON [' + su.[name] + '].[' + o.[name] + '] WITH ( ONLINE = OFF )' AS [drop_command] |
Having verified the need to drop an index from the database, simply copy the DROP INDEX command text from the result set into a new query window and execute it. As always, we advocate testing such processes in your development environment first, before running against a production database. Furthermore, it is recommended you take a backup of the database before running such a command.
As noted earlier, I would not like to encourage readers to go around wildly dropping large numbers of indexes without proper investigation. For a start, it is always advisable to check how recently the usage stats were cleared, by querying sys.sysdatabases, as shown in Listing 4.
|
1 2 3 |
SELECT DATEDIFF(DAY, sd.crdate, GETDATE()) AS days_history FROM sys.sysdatabases sd WHERE sd.[name] = 'tempdb' ; |
Listing 4: How old are the index usage stats?
Also, an index may not have been used recently simply because its functionality is cyclical in nature (perhaps only used in a month-end process), or simply because it is a recently-implemented index. Once again, it is important not to drop or create indexes, without first performing adequate testing in a non-production environment.
Identify inefficient indexes
Our final sys.dm_db_index_usage_stats query filters by the current database, and only includes non-clustered indexes. It can help you decide whether the cost of maintaining a particular index outweighs the benefit you are receiving from having it in place.
|
1 2 3 4 5 6 7 8 9 10 11 12 13 14 15 16 17 18 19 |
-- Potentially inefficent non-clustered indexes (writes > reads) SELECT OBJECT_NAME(ddius.[object_id]) AS [Table Name] , i.name AS [Index Name] , i.index_id , user_updates AS [Total Writes] , user_seeks + user_scans + user_lookups AS [Total Reads] , user_updates - ( user_seeks + user_scans + user_lookups ) AS [Difference] FROM sys.dm_db_index_usage_stats AS ddius WITH ( NOLOCK ) INNER JOIN sys.indexes AS i WITH ( NOLOCK ) ON ddius.[object_id] = i.[object_id] AND i.index_id = ddius.index_id WHERE OBJECTPROPERTY(ddius.[object_id], 'IsUserTable') = 1 AND ddius.database_id = DB_ID() AND user_updates > ( user_seeks + user_scans + user_lookups ) AND i.index_id > 1 ORDER BY [Difference] DESC , [Total Writes] DESC , [Total Reads] ASC ; |
Listing 5: Finding rarely used indexes.
Make sure that the SQL Server instance has been running long enough to ensure that the complete, typical workload will be represented in the reported statistics. Again, don’t forget about periodic, reporting workloads that might not show up in the day-to-day workload. Even though the indexes that facilitate such workloads will be infrequently used, their presence will be critical.
Determine usage patterns of current indexes (index_operational_stats)
The sys.dm_db_index_operational_stats is a DMF; it accepts database_id , object_id, index_id, and partition_number as parameters, in order to identify the object (heap, clustered or non-clustered index) in question, and returns detailed “operational stats” for each partition of that object. It provides index usage statistics at a more detailed level than those provided by the sys.dm_db_index_usage_stats DMV, as well as evidence of potential lock or latch contention on the objects, or of excessive I/O being issued by the object. All the parameters can be NULL or DEFAULT if you want to return all rows, in which case the DMF will return a row for every partition in every database.
Data in this DMV is cumulative, and is refreshed when the server is restarted or when the index is dropped and recreated. Statistics live on when an index is rebuilt, reorganized, and even when it is disabled and rebuilt.
Whereas an index will always appear in the index_usage_stats DMV as long as it has been used, the data returned by the index_operational_stats DMF is slightly more “transient” in nature. As detailed in (Books Online):
The data returned by sys.dm_db_index_operational_stats exists only as long as the metadata cache object that represents the heap or index is available…an active heap or index will likely always have its metadata in the cache, and the cumulative counts may reflect activity since the instance of SQL Server was last started. The metadata for a less active heap or index will move in and out of the cache as it is used. As a result, it may or may not have values available…
Since the “grain” of the function is the partition level, a table that is partitioned into five parts, will have five rows in this DMF, whereas sys.dm_db_index_usage_stats will see the object as only a single row. Use usage stats if you want counts of each usage, as each usage in counted once. The operational stats object may have multiple values set for each type of activity recorded. Finally, note that we cannot use APPLY operators with this DMF.
Whereas the usage stats give a feel for how an index is used by the optimizer to satisfy the needs of certain queries, the operational stats offer more detailed information about how the index is used at a physical level, via columns such as leaf_insert_count, leaf_update_count and leaf_delete_count (the cumulative number of leaf-level inserts, updates and deletes), as well as the nonleaf_* equivalents, for modifications above the leaf level.
For diagnosis of resource contention on the object, the following columns are particularly useful:
- row_lock_count – number of row locks that have been requested against this index
- row_lock_wait_count – number of times a session has waited on a row lock against this index
- row_lock_wait_in_ms – amount of time a session had to wait on a row lock against this index
- page_lock_count, page_lock_wait_count, page_lock_wait_in_ms – same as row_lock values at the page grain
- index_lock_promotion_attempt_count, index_lock_promotion_count – number of times the lock grain for an operation using this index was attempted or granted to be escalated (like from row to page)
- page_latch_wait_count, page_latch_wait_in_ms – number of waits and time waited on the physical page of the object to have the latch removed
- page_io_latch_wait_count, page_io_latch_wait_in_ms – number of waits and time while SQL loads pages from disk into memory for an index operation.
This DMF offers many more columns, for example to investigate use of row overflow data, LOB data, and so on. For a full listing, see Books Online. Let’s see this DMF in action.
Detailed activity information for indexes not used for user reads
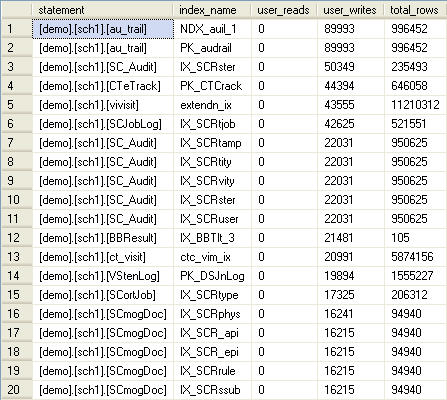
The script in Listing 6 isolates just those indexes that are not being used for user reads, courtesy of sys.dm_db_index_usage_stats, and then provides detailed information on the type of writes still being incurred, using the leaf_*_count and nonleaf_*_count columns of sys.dm_db_index_operational_stats. In this way, you gain a deep feel for how indexes are being used, and just exactly how much the index is costing you.
|
1 2 3 4 5 6 7 8 9 10 11 12 13 14 15 16 17 18 19 20 21 22 23 24 25 26 27 28 29 30 31 32 33 |
SELECT '[' + DB_NAME() + '].[' + su.[name] + '].[' + o.[name] + ']' AS [statement] , i.[name] AS [index_name] , ddius.[user_seeks] + ddius.[user_scans] + ddius.[user_lookups] AS [user_reads] , ddius.[user_updates] AS [user_writes] , ddios.[leaf_insert_count] , ddios.[leaf_delete_count] , ddios.[leaf_update_count] , ddios.[nonleaf_insert_count] , ddios.[nonleaf_delete_count] , ddios.[nonleaf_update_count] FROM sys.dm_db_index_usage_stats ddius INNER JOIN sys.indexes i ON ddius.[object_id] = i.[object_id] AND i.[index_id] = ddius.[index_id] INNER JOIN sys.partitions SP ON ddius.[object_id] = SP.[object_id] AND SP.[index_id] = ddius.[index_id] INNER JOIN sys.objects o ON ddius.[object_id] = o.[object_id] INNER JOIN sys.sysusers su ON o.[schema_id] = su.[UID] INNER JOIN sys.[dm_db_index_operational_stats](DB_ID(), NULL, NULL, NULL) AS ddios ON ddius.[index_id] = ddios.[index_id] AND ddius.[object_id] = ddios.[object_id] AND SP.[partition_number] = ddios.[partition_number] AND ddius.[database_id] = ddios.[database_id] WHERE OBJECTPROPERTY(ddius.[object_id], 'IsUserTable') = 1 AND ddius.[index_id] > 0 AND ddius.[user_seeks] + ddius.[user_scans] + ddius.[user_lookups] = 0 ORDER BY ddius.[user_updates] DESC , su.[name] , o.[name] , i.[name ] |
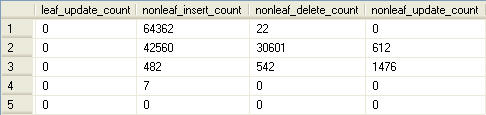
Listing 6: Detailed write information for unused indexes.
Upon review of the output, it’s quite clear that some of these indexes are still being hammered by inserts even though the users are not benefiting from their existence in regards to reads. If I encountered metadata like this in the real world (wink, wink) you could be sure that I would do something about it.
Identify locking and blocking at the row level
We can also return information about locking, latching, and blocking from sys.dm_db_index_operational_stats. Listing 7 returns records that relate to locking and blocking at the row level for the indexes of the active database.
|
1 2 3 4 5 6 7 8 9 10 11 12 13 14 15 16 17 18 19 20 21 22 23 24 |
SELECT '[' + DB_NAME(ddios.[database_id]) + '].[' + su.[name] + '].[' + o.[name] + ']' AS [statement] , i.[name] AS 'index_name' , ddios.[partition_number] , ddios.[row_lock_count] , ddios.[row_lock_wait_count] , CAST (100.0 * ddios.[row_lock_wait_count] / ( ddios.[row_lock_count] ) AS DECIMAL(5, 2)) AS [%_times_blocked] , ddios.[row_lock_wait_in_ms] , CAST (1.0 * ddios.[row_lock_wait_in_ms] / ddios.[row_lock_wait_count] AS DECIMAL(15, 2)) AS [avg_row_lock_wait_in_ms] FROM sys.dm_db_index_operational_stats(DB_ID(), NULL, NULL, NULL) ddios INNER JOIN sys.indexes i ON ddios.[object_id] = i.[object_id] AND i.[index_id] = ddios.[index_id] INNER JOIN sys.objects o ON ddios.[object_id] = o.[object_id] INNER JOIN sys.sysusers su ON o.[schema_id] = su.[UID] WHERE ddios.row_lock_wait_count > 0 AND OBJECTPROPERTY(ddios.[object_id], 'IsUserTable') = 1 AND i.[index_id] > 0 ORDER BY ddios.[row_lock_wait_count] DESC , su.[name] , o.[name] , i.[name ] |
Listing 7: Retrieving locking and blocking details for each index.
Notice that in the calculations of both the [%_times_blocked] and avg_row_lock_wait_in_ms columns, we’ve had to use a decimal multiplication factor:
|
1 2 |
CAST (100.0 * ddios.[row_lock_wait_count] / (ddios.[row_lock_count]) AS decimal(5,2)) CAST (1.0 * ddios.[row_lock_wait_in_ms] / ddios.[row_lock_wait_count] AS decimal(15,2)). |
This is due to an unfortunate glitch in the data type conversion process within T-SQL that you are never aware of until it sneaks up on you, and you spend hours trying to figure out why your results don’t follow basic mathematical rules. Unless a mathematical formula includes a decimal, float, or other non-integer numeric data type, the results will only produce an integer result, even when the math warrants a non-integer result. You can try this for yourself. What do you get when you execute the following code in a query window?
|
1 |
SELECT 3/2 |
I bet you the answer is not 1.5. The way to fix this is to force a conversion to decimal form by including a constant that best fits your formula, in the form of a decimal, as demonstrated in the previous calculations.
Identify latch waits
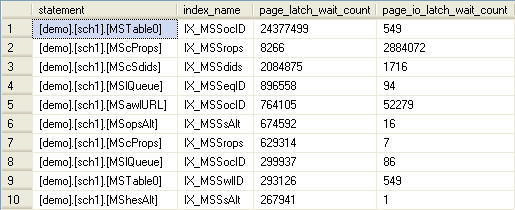
Listing 8 highlights which of our indexes are encountering latch contention using the page_io_latch_wait_count and page_io_wait_in_ms columns.
|
1 2 3 4 5 6 7 8 9 10 11 12 13 14 |
SELECT '[' + DB_NAME() + '].[' + OBJECT_SCHEMA_NAME(ddios.[object_id]) + '].[' + OBJECT_NAME(ddios.[object_id]) + ']' AS [object_name] , i.[name] AS index_name , ddios.page_io_latch_wait_count , ddios.page_io_latch_wait_in_ms , ( ddios.page_io_latch_wait_in_ms / ddios.page_io_latch_wait_count ) AS avg_page_io_latch_wait_in_ms FROM sys.dm_db_index_operational_stats(DB_ID(), NULL, NULL, NULL) ddios INNER JOIN sys.indexes i ON ddios.[object_id] = i.[object_id] AND i.index_id = ddios.index_id WHERE ddios.page_io_latch_wait_count > 0 AND OBJECTPROPERTY(i.OBJECT_ID, 'IsUserTable') = 1 ORDER BY ddios.page_io_latch_wait_count DESC , avg_page_io_latch_wait_in_ms DESC |
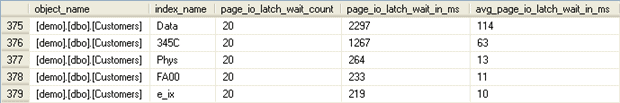
Listing 8: Investigating latch waits.
Latching occurs when the engine reads a physical page. Upon doing so, it issues a latch, scans the page, reads the row, and then releases the latch when, and this is important, the page is needed for another process. This process is called lazy latching. Though latching is quite a benign process, it is of interest to have handy such information as this query provides. It allows us to identify which of our indexes are encountering significant waits when trying to issue a latch, because another latch has already been issued. I/O latching occurs on disk-to-memory transfers, and high I/O latch counts could be a reflection of a disk subsystem issue, particularly when you see average latch wait times of over 15 milliseconds.
Identify lock escalations
SQL Server may attempt to escalate locks in response to a need to reduce the total number of locks being held and the memory therefore required to hold and manage them. For example, individual row locks may be escalated to a single table lock, or page locks may be escalated to a table lock. While this will result in lower overhead on SQL Server, the downside is lower concurrency. If processes are running on your servers that are causing lock escalation, it’s worth investigating whether the escalation is justified, or if SQL tuning can be performed to prevent it.
The sys.dm_db_index_operational_stats DMV can be queried to return information on the count of attempts made by SQL Server to escalate row and page locks to table locks for a specific object. The query in Listing 9 provides information regarding how frequently these escalation attempts were made, and the percentage success in performing the escalation.
|
1 2 3 4 5 6 7 8 9 10 11 12 |
SELECT OBJECT_NAME(ddios.[object_id], ddios.database_id) AS [object_name] , i.name AS index_name , ddios.index_id , ddios.partition_number , ddios.index_lock_promotion_attempt_count , ddios.index_lock_promotion_count , ( ddios.index_lock_promotion_attempt_count / ddios.index_lock_promotion_count ) AS percent_success FROM sys.dm_db_index_operational_stats(DB_ID(), NULL, NULL, NULL) ddios INNER JOIN sys.indexes i ON ddios.OBJECT_ID = i.OBJECT_ID AND ddios.index_id = i.index_id WHERE ddios.index_lock_promotion_count > 0 |
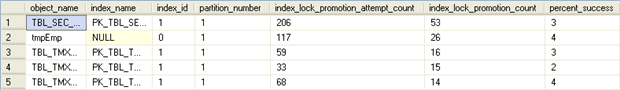
Listing 9: Investigating lock escalation.
Identify indexes associated with lock contention
The sys.dm_os_wait_stats DMV is a great “first hit” resource for drilling into issues that may instigate those “Hey, the database is slow” phone calls that we all know and love at 3 a.m. If the outcome of your queries into sys.dm_os_wait_stats points to locking problems, the query in Listing 10 makes a good next step in the investigation. This original idea comes from the Microsoft “SQL Server Premier Field Engineer” blog, at http://blogs.msdn.com/b/sql_pfe_blog/ with a few enhancements to identify the indexes by name in the results.
|
1 2 3 4 5 6 7 8 9 10 11 12 13 14 15 16 17 18 19 20 |
SELECT OBJECT_NAME(ddios.OBJECT_ID, ddios.database_id) AS OBJECT_NAME , i.name AS index_name , ddios.index_id , ddios.partition_number , ddios.page_lock_wait_count , ddios.page_lock_wait_in_ms , CASE WHEN DDMID.database_id IS NULL THEN 'N' ELSE 'Y' END AS missing_index_identified FROM sys.dm_db_index_operational_stats(DB_ID(), NULL, NULL, NULL) ddios INNER JOIN sys.indexes i ON ddios.OBJECT_ID = i.OBJECT_ID AND ddios.index_id = i.index_id LEFT OUTER JOIN ( SELECT DISTINCT database_id , OBJECT_ID FROM sys.dm_db_missing_index_details ) AS DDMID ON DDMID.database_id = ddios.database_id AND DDMID.OBJECT_ID = ddios.OBJECT_ID WHERE ddios.page_lock_wait_in_ms > 0 ORDER BY ddios.page_lock_wait_count DESC ; |

Listing 10: Indexes associated with lock contention.
Notice the very useful outer join to sys.dm_db_missing_index_details to identify if there was a potential suggestion for a missing index that may resolve the locking. Of course, before implementing any new index, you should first test it thoroughly in your test environment, which we discuss in depth as we move on to look at the missing index DMOs.
Find missing indexes
When the query optimizer generates an execution plan for a query, it determines the optimal data access path that will satisfy the search criteria, and then checks to see if any existing indexes offer this path (or something close). If the ideal index does not exist, the optimizer chooses the best one available, or simply does a table scan, but it stores the details of the “missing index.” This information is exposed via four sys.dm_db_missing_index_* DMOs, which are rarely used individually, but as a group. They are:
- sys.dm_db_missing_index_details – a DMV that provides detailed information regarding indexes the optimizer would have chosen to use, had they been available
- sys.dm_db_missing_index_columns – a DMF that accepts an index_handle parameter and returns a table providing details of columns that would comprise the suggested missing index
- sys.dm_db_missing_index_group_stats – a DMV that returns detailed information pertaining to metrics on groups of missing indexes
- sys.dm_db_missing_index_groups – a DMV that provides details of missing indexes in a specific group; this is the intermediate join table between sys.dm_db_missing_index_details and sys.dm_db_missing_index_group_stats.
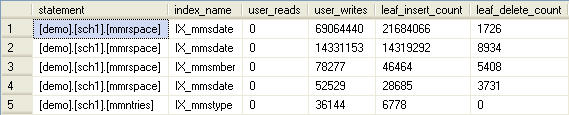
Napoleon Bonaparte stated that A good sketch is better than a long speech. I promise that this is my one and only quote from a 19th century French dictator in this book, but the adage is quite appropriate in this case. Figure 1 shows the many-to-many relationship between missing_index_details and index_group_stats, via missing_index_groups.
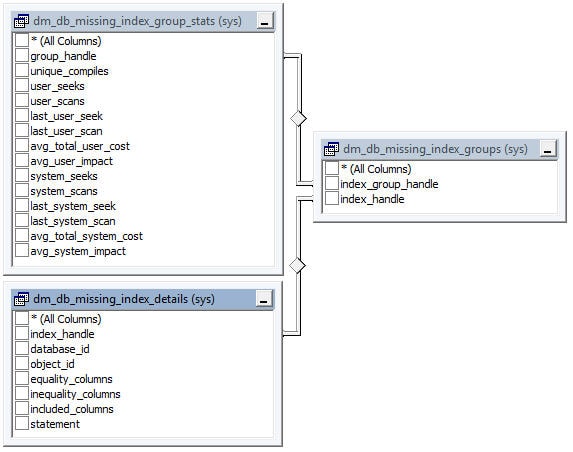
Figure 1: The many-to-many relationship between missing_index_details and index_group_stats, via missing_index_groups.
The first thing to note is that there is no index_id in any of the missing index DMOs. This is because the returned results are recommendations for indexes which have yet to be created, and are therefore non-materialized. The unique identifier for the records in these DMVs is the index_handle column, which is unique across the entire SQL Server instance.
The data stored by each of these DMOs is reset on a server restart. This is why it is so important to preserve this cumulative data and keep your instances in a constantly running state; you need to make sure, when you use this data, that the stored statistics are fully representative of your normal query workload. One service restart, and your accrued history (and the ability to generate meaningful results for this and other DMV-based queries) is, pardon the pun, history.
Furthermore, the data stored in these DMOs is also volatile and based on active queries. By implementing a single new index on a given table or view, the results of the DMO query for that object may no longer be valid.
MSDN covers well the columns returned by each one (http://msdn.microsoft.com/en-us/library/ms187974.aspx) so here we’ll only review the most significant columns, for each DMO.
Missing index details
The sys.dm_db_missing_index_details DMV, which identifies our missing indexes, returns the identifier columns index_handle, object_id and database_id, along with the following:
- equality_columns – the columns that would have been useful, based on an equality predicate
- inequality_columns – the columns that would have been useful, based on an inequality predicate (i.e. any comparison other than “column = value”)
- included_columns – columns that, if included, would have been useful to cover the query
- statement – database and schema qualified object name of the object identified by database_id and object_id.
Missing index columns
The sys.dm_db_missing_index_columns DMF accepts the index_handle as a parameter (retrieved from sys.dm_db_missing_index_details or sys.dm_db_missing_index_group) and returns a table containing a record for each of the individual columns that would make up the identified index. This makes it easier for tools to use the columns to build a CREATE INDEX statement. It returns only three columns, column_id, column_name and column_usage, the latter taking the self-explanatory values of either EQUALITY, INEQUALITY or INCLUDE. There may be duplicate column_name values for the case where a column would be useful for both an equality and an inequality predicate.
It’s important to note that the columns in this list are not ordered in a way that reflects the optimal column ordering for the index key, so you may have to do some additional tweaking to get the best result.
Missing index groups
The sys.dm_db_missing_index_groups DMV simply resolves the many-to-many relationship between sys.dm_db_missing_index_details and sys.dm_db_missing_index_group_stats. It identifies a missing index to its missing index group via the following columns:
- index_group_handle – the id of the index group, which is used to relate the row to the sys.dm_db_missing_index_group_stats view
- index_handle – the handle of the index, used to relate the row to sys.dm_db_missing_index_details and sys.dm_db_missing_index_columns.
Currently, in there is only one index to a group but, for future compatibility, you should consider the key of this object to be comprised of both columns.
Missing index group statistics
The sys.dm_db_missing_index_group_stats DMV provides all the detail statistics regarding the size of the benefit that SQL Server would expect from the missing index, including how often it would have been used in scans and seeks, and how many compiled plans could use it.
Its identifier column is group_handle, which joins to index_group_handle in sys.dm_db_missing_index_groups. As noted, for the time being there is only one index per group. It also returns the following statistical columns:
- unique_compiles – the number of plans that have been compiled that might have used the index
- user_seeks – the number of seek operations in user queries that might have used the index
- user_scans – the number of scan operations in user queries that might have used the index
- last_user_seek – the last time that a seek operation might have used the index
- last_user_scan – the last time that a scan operation might have used the index
- avg_total_user_cost – average cost saving for the queries that could have been helped by the index in the group
- avg_user_impact – the estimated percentage by which the average query cost would drop, for the queries that could use this index.
For each of the user statistics columns there are equivalent system columns, which record when the index is used for a system operation, such as automatic statistics operations.
The last_user_* columns are vital in helping you assess whether you really do need to add the suggested missing index. If this time isn’t fairly recent, then it’s likely that the query it would have helped was ad hoc, and not part of your normal workload, and so the benefit of creating the index is likely to be marginal, or even detrimental, if the table in question is updated frequently.
Limitations of the missing index DMOs
While these DMOs are potentially very useful in optimizing your index strategy and query execution times, the information they provide should be used with caution. Just as we advised against wildly dropping indexes without thorough investigation, so you should never just blindly add every index that these DMOs suggest. This is especially true if you have an OLTP workload, where too many indexes can be just as damaging as too few. Every time data is updated in a table, the data in the indexes must be maintained as well. This can dramatically reduce the performance of these data modifications.
Instead, you need to examine the results of the query carefully and manually filter out results that are not part of your regular workload.
Also, be warned that the order in which these DMOs list missing columns does not accurately suggest the correct column order for an index key. Furthermore, in our experience, these DMOs are often over-enthusiastic in suggesting INCLUDE columns. They are best used to find the biggest “holes” in an indexing strategy, not as a fine-tuning tool.
In addition, Microsoft Books Online lists the following specific limitations:
- cannot gather statistics for more than 500 missing index groups
- return less accurate cost information for queries involving only inequality predicates
- reports only include columns for some queries, so index key columns must be manually selected
- return only raw information about columns on which indexes might be missing
- can return different costs for the same missing index group that appears multiple times in XML Showplans.
Finding the most beneficial missing indexes
So how do you go about putting these DMOs to good use? Our goal is clearly to obtain a list of missing indexes, with the most useful ones listed at the top. The SQL Server Query Optimization Team at Microsoft proposed the following formula for calculating the overall benefit of a suggested index, based on the columns in the _group_stats DMV, and it has been widely adopted:
|
1 |
(user_seeks + user_scans) * avg_total_user_cost * (avg_user_impact * 0.01) |
Listing 11 provides a quick and useful query, based on this formula, that DBAs can run to identify potentially useful indexes. The results of this query are instance-wide, so be sure to limit your results to just the database in question, in the WHERE clause, as demonstrated here. This query provides the DBA with information directly from the query optimizer history, accrued since the last restart of the SQL Server service. It provides information on columns the optimizer would have preferred to have indexed, based upon the original parse of the query upon execution. Equality columns, inequality columns, and included columns are each identified. Also presented are the accrued counts of compiles and seeks, as well as calculated figures that denote the amount of improvement to be gained if the indexes were created.
|
1 2 3 4 5 6 7 8 9 10 11 12 13 14 15 16 17 |
SELECT user_seeks * avg_total_user_cost * ( avg_user_impact * 0.01 ) AS [index_advantage] , dbmigs.last_user_seek , dbmid.[statement] AS [Database.Schema.Table] , dbmid.equality_columns , dbmid.inequality_columns , dbmid.included_columns , dbmigs.unique_compiles , dbmigs.user_seeks , dbmigs.avg_total_user_cost , dbmigs.avg_user_impact FROM sys.dm_db_missing_index_group_stats AS dbmigs WITH ( NOLOCK ) INNER JOIN sys.dm_db_missing_index_groups AS dbmig WITH ( NOLOCK ) ON dbmigs.group_handle = dbmig.index_group_handle INNER JOIN sys.dm_db_missing_index_details AS dbmid WITH ( NOLOCK ) ON dbmig.index_handle = dbmid.index_handle WHERE dbmid.[database_id] = DB_ID() ORDER BY index_advantage DESC ; |
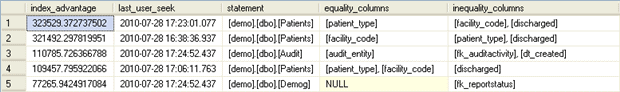
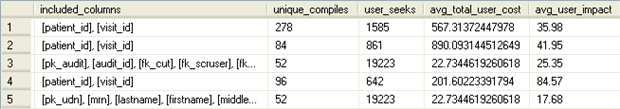
Listing 11: Finding beneficial missing indexes.
This query represents a powerful tool in helping DBAs to identify pathways for performance improvement. However, the SQL Server Query Optimization Team have taken this a step or two further, and offer a “missing index” tool, available at http://blogs.msdn.com/queryoptteam/archive/2006/06/01/613516.aspx, which generates a lot of details about indexes that might be useful.
In either case, however, we should never simply create each and every index suggested by the results. As discussed at the start of the “Index Strategy” section earlier in this article, creating too many indexes on a table can be just as damaging to performance as not creating enough (or creating the wrong) indexes. We recommend that you create a duplicate environment for your test and development work that represents the hardware and SQL Server configurations of your production environment. You should then go through the process of creating indexes recommended through these results, and testing performance in a simulated production load.
Summary
In this article, we discussed the DMOs that can help the DBA to define an effective SQL Server indexing strategy. This is one of the best ways to ensure that the most significant and frequent queries in the workload can read the required data in a logical, ordered fashion, and so avoid unnecessary I/O. For every DBA who wishes to get the best performance from SQL Server, finding the correct balance between too many and too few indexes, and having in place the appropriate set of “useful” indexes is extremely important.
This article showed how to:
- use the sys.dm_db_index_usage_stats DMV to uncover those indexes that exist but have never been used, or where the maintenance cost of the index, (perhaps because the table data is regularly updated), is high but the index is rarely used as a data access path, and so is offering relatively little in terms of query performance benefit
- use the sys.dm_db_index_operational_stats DMF to obtain “physical” usage statistics for a clustered index, heap or index so that we can investigate potential lock or latch contention on the object, or of excessive I/O being issued by the object, all of which may cause users to wait a significant amount of time in order to read data from the object
- use the sys.dm_db_missing_ group of DMOs to identify indexes that the optimizer would have liked to have had available when seeking out the optimal data access path for a given query
Throughout the article, we’ve stressed the need for the DBA to apply judgment, and their knowledge of their database, its data, and the normal query workload, before creating or removing any of the indexes identified by the DMO queries presented in this article. In particular, make sure that the SQL Server instance has been running long enough for the complete, typical workload to be represented in the reported statistics, and don’t forget to account for the indexes required by periodic reporting jobs that might not show up in the day-to-day workload.
This article is just a small section of the book Performance Tuning with SQL Server DMVs, by Tim Ford and Louis Davidson. You can download a copy of the eBook (PDF) for free here.
Simple Talk is brought to you by Redgate Software
This document contains proprietary information and is protected by copyright law.
Copyright © 2026 Red Gate Software Limited. All rights reserved


Load comments