

The Dynamic Management Objects (DMOs) described in this article provide metadata and statistics regarding any query that has previously executed on your server, and the execution plan used to run it, provided that the plan for that query is in the plan cache. For example, if a stored procedure has been executed, and the plan for it is cached, then not only can we return and examine that plan, but we can also obtain statistics regarding execution of the stored procedure associated with the plan, such as total number of disk reads performed, total time spent executing, and so on.
We’ll show how such statistics and query plan metadata can be used to answer questions such as those below (the relevant DMO is indicated in brackets).
- What are the “top x” most expensive queries in the cache in terms of CPU / IO / memory? (query_stats)
- Which are the most “expensive” stored procedures? (procedure_stats)
- Are plans getting reused? (cached_plans and plan_attributes)
- How many ad hoc, single-use queries are taking up space in the plan cache? (cached_plans)
In each section, we’ll provide T-SQL scripts to retrieve this data, and discuss how you can use it to get a feeling for certain aspects of your system’s performance.
Whereas the sys.dm_exec_requests DMV can provide insight into “What is executing on my instance right now, and what is it doing?”, the DMOs in this article can give you a broader perspective on your typical query workload, based on the plans that are stored in the cache. The really big win for the average DBA is the fact that you can access the statistics on what queries were run, what plans and system resources were used, and so on, after the event. Before DMOs, when a DBA was notified of a bad problem that occurred a little earlier, there were few tools to hand to help find out what happened, unless they happened to be running Profiler traces to capture the event. Now, by querying these DMOs, we can retrospectively examine the damage that a rogue query did, and the impact on the server of running such queries will generally be far less than using a tool such as Profiler.
Why Cached Plan Analysis with DMOs?
There are several strategies that one may use when seeking to resolve a SQL Server performance issue using the DMOs. However, regardless of the origin of an issue, whether it’s related to CPU, I/O, memory, blocking, and so on, the final destination is most often a detailed examination of the queries that are causing the problem, and of possible ways to tune them.
The execution plans generated by the SQL Server Query optimizer, and stored in memory in the plan cache, are the DBA’s premier window into the world of query optimization. If you are looking to improve your skills as a SQL Server programmer or DBA, then acquiring an understanding of query plans is an essential first step. There is a natural progression from being able to run a query, to understanding all the steps that SQL Server has to undertake in order to execute that query and serve up the results. In fact, I regard knowledge of query plans as a barometer by which to judge a programmer’s ability to write optimal queries.
It is only with a deep knowledge of the operations that are being performed to execute a query, and the order in which these operations occur that you can really begin to look for opportunities to optimize the data access path for that query. Of course, the graphical execution plan is available by other, arguably simpler means, such as through SQL Server Management Studio (SSMS) or Profiler. However, with each of these tools, the actual, as opposed to the estimated, plan that was used to execute a given query can only be captured in real time, while the query is running. With the DMOs in this article, you can retrieve the actual plan for any query for which the plan is cached.
Furthermore, the metadata and statistics that these DMOs can provide alongside the plan are, as we will demonstrate, very useful in helping direct your query tuning efforts; in working out whether you need to reduce the computational complexity of the query to reduce CPU usage; add indexes, replace cursors with set-based constructs, tuning the search predicate to return less data, to reduce I/O; eliminate expensive sorts, reduce gratuitous use of temporary tables to reduce memory usage, and so on.
Again, you may be thinking that a similar set of statistics is available from the performance reports that can be accessed in Management Studio by right-clicking on the Server node and selecting Reports | Standard Reports.
SSMS reports
These reports are standard in SQL Server 2008 and are an add-in to SQL Server 2005, where they are referred to as Performance Dashboard Reports.
In fact, of course, these reports use the DMOs under the covers. The problem is that they have significant limitations on how you can filter them and use the output. In this article, we will look at techniques to build your own queries against the DMOs that will allow you to view only the data you want to see. Once you’ve developed a core set of scripts it is very easy to refine them as required, to save the results to your own tables, so that you can compare current results with previous results, track performance over time, and so on.
Finally, but very importantly, remember that it’s not only ensuring that the plans are good that is critical; it is ensuring that these plans are used, and reused time and again. As noted, SQL Server stores plans for previously-executed queries in a shared memory area called the plan cache. Whenever a query is submitted for execution, SQL Server checks in the plan cache to see if there is an existing plan it can use to execute the query. Every time it cannot find a match, the submitted query must be parsed, optimized, and a plan generated.
Parsing and optimizing SQL statements is a CPU-intensive process, so it is not a “high concurrency” operation. Furthermore, each time it does this, SQL Server acquires latches on the plan cache to protect the relevant area of memory from other updates. The more this happens, the more it will restrict other processes from accessing the cache. Well-designed SQL needs to promote plan reuse (“parse once, use many times”) as far as possible. If you have a lot of ad hoc, non-parameterized SQL in your workload, it will result in much higher CPU consumption and many more latches acquired, as a plan will be generated each time. At the same time, your cache will fill up with single-use plans that will probably never be used again.
It’s even possible that, in such circumstances, useful plans could get flushed out of the cache. SQL Server flushes plans out of the cache when it needs space, based on an algorithm that considers the cost of recalculating the plan, how recently the plan was used, and other unpublicized factors. Generally speaking, the least interesting queries will be the ones removed from the cache first.
In any event, the DMOs and scripts in this article will help you uncover these sorts of problems, and help you ensure that the plans for your day-to-day query workload are in the cache, and are getting used.
An Overview of DMOs for Query Plan Metadata
In addition to the sys.dm_exec_requests DMV and sys.dm_exec_sql_text DMF, we will extract our statistics and query plan metadata from the DMVs below, which belong to the “execution-related” category (which is why their names all begin with “sys.dm_exec_“).
- sys.dm_exec_query_stats – returns aggregated performance statistics for a cached query plan. Returns one row per statement within the plan.
- sys.dm_exec_procedure_stats – returns aggregated performance statistics for cached stored procedures (SQL Server 2008 only). Returns one row per stored procedure.
- sys.dm_exec_cached_plans – provides detailed information about a cached plan, such as the number of times it has been used, its size, and so on. Returns a row for each cached plan.
- sys.dm_exec_query_optimizer_info – returns statistics regarding the operation of the query optimizer, to identify any potential optimization problems. For example, you can find out how many queries have been optimized since the last time the server was restarted.
In order to return the query plan for a given batch, as well as some interesting attributes of these plans, we can pass the identifier for that plan batch, the plan_handle, to one of the DMFs below.
- sys.dm_exec_query_plan – returns in XML format the query plan, identified by a plan_handle, for a SQL batch.
- sys.dm_exec_text_query_plan – returns in text format the query plan, identified by a plan_handle, for a SQL batch or, via use of this DMF’s offset columns, a specific statement within that batch.
- sys.dm_exec_plan_attributes – provides information about various attributes of a query plan, identified by a plan_handle, such as the number of queries currently using a given execution plan. It returns one row for each attribute.
To the query optimizer, a query and a query plan are not synonymous. When a batch is executed, it gets a plan. This plan comprises one or more individual queries, each of which will have a query plan of its own. The DMVs for query plans, such as _cached_plans, return one row per distinct batch or object. The DMVs for queries, such as _query_stats, return one row per independent query that is embedded in that plan. If, in our queries, we “join” from _query_stats to the _query_plan DMF, in order to return the plan, each row returned by _query_stats will contain a link to the plan for the batch to which the row (i.e. individual query) belongs. If, instead, we join to text_query_plan, it’s possible to extract from the batch the plan for only the individual query in question (but there are complications, as will soon be demonstrated).
As we progress through the article, we’ll provide brief description s of some of the more useful (or confusing) columns that these DMOs provide, but we’ve tried to avoid “rehashing Books Online” as far as possible, and a complete listing and reference for the DMOs covered in this article can be found here.
Flushing the Cache?
Before we get started in earnest, it is important to realize that troubleshooting problem queries using the DMOs is not a perfect science. Firstly, we can only examine plans for queries that are in the cache; while the cache will usually hold plans for all the most active/costly queries, less costly/reused queries can fall out of the cache, and some queries, with nominal plans, are never cached in the first place; in short, some queries will be missed.
Secondly, plans may remain in the cache from when they are first compiled until the object is dropped or recompiled, or the cache is flushed. This means that some plans, especially frequently used ones, may remain in the cache for a long time. If your SQL Server instance has been up and running for long, it will contain lots of plans of different ages which will make it hard to analyze the statistics. For example, if you’re looking for the plans for the most-CPU-intensive procedures, the results will be heavily skewed towards those procedures that have been cached for a long period, compared to plans that have, for some reason, been recently recompiled.
One way around this might be to clear the cache, using DBCC FREEPROCCACHE for all databases on an instance, or using DBCC FLUSHPROCINDB for a single database, as shown in Listing 1.1.
|
1 2 3 4 5 6 7 8 9 |
--Determine the id of your database DECLARE @intDBID INTEGER SET @intDBID = ( SELECT dbid FROM master.dbo.sysdatabases WHERE name = 'mydatabasename' ) --Flush the procedure cache for your database DBCC FLUSHPROCINDB (@intDBID) |
Listing 1.1: Flushing the cache of plans belonging to a particular database.
The flushed plans will go back into the cache the next time they are executed, the result being that most of the stored procedures that are run frequently and are part of your normal workload will have a similar cache time. This will make the statistics much easier to interpret (until, and unless, they get recompiled again for some other reason).
Flushing the cache is a controversial suggestion and many DBAs avoid doing it on a production server. After all, clearing the cache means that new plans need to be determined and created, which has an associated cost. It’s true that recompiling all of the query plans will cause some extra work for your processor(s), but many modern processors shrug this off with little effect beyond a brief (few seconds) spike of CPU activity.
Viewing the Text of Cached Queries and Query Plans
The root cause of many performance problems is the fact that the plan you get when query execution is optimized under a full production server load can be very different from the one you saw in Management Studio while building the query. For example, on your development server, you may have only a single CPU, several orders of magnitude fewer rows, different amounts of RAM, statistics that are completely up to date, fewer concurrent users, and so on.
Unfortunately, the excuse “it worked on my machine” is not acceptable with database applications, so it is very useful to be able to see the query plan that was actually used to optimize a query, when it was executed. This way you can find out why a query is performing as it is, and begin the process of optimization. This is also useful when troubleshooting poor performance caused by parameter sniffing, whereby the initial set of parameters chosen as a “guide” when first compiling the plan for a stored procedure turn out to be anomalous, and not representative of the parameters’ values supplied during normal execution.
To retrieve the plan for a given batch or procedure, we simply extract the plan_handle from the sys.dm_exec_query_stats DMV (covered in detail later in this article). The plan_handle uniquely identifies the query plan for a given batch or stored procedure. We then pass it as a parameter to one of the following DMFs:
- sys.dm_exec_query_plan, which accepts the plan_handle as its only parameter and will return the plan for the identified batch or procedure, as XML. Note that BOL states that it returns the plan in “text format”. This is a little confusing since it refers to the type of column returned, not the format in which you will view the plan, which is XML.
- sys.dm_exec_text_query_plan, which accepts the plan_handle and adds two additional parameters, statement_start_offset and statement_end_offset, which mark the start and end points of individual SQL statements within the batch or procedure. This DMF returns the plan in text format (a nvarchar(max) typed object) and is available in SQL Server 2005 SP2 and later.
When returning the plan from the sys.dm_exec_query_plan DMF, SSMS will display a link to the plan, which you can click onto immediately to display the graphical plan. In any event, with either DMF, the output can be saved as a .SQLPLAN file that can be used to view the graphical plan in SSMS.
NOTE:
One unfortunate limitation of these functions is that, in the absence of SSMS or another third-party tool that understands the .SQLPLAN format, they do not give you the type of easily readable output that you get when using the SHOWPLAN_TEXT setting in a query window.
Both of these functions return a query_plan column, containing the current cached query plan, along with dbid, objectid, and encrypted columns. The sys.dm_exec_query_plan function returns the plan as an XML typed value, which limits the size of the plan that can be returned, since the XML datatype does not support XML documents with more than 128 levels.The sys.dm_exec_text_query_plan object returns the plan as a nvarchar(max) typed object, so removing these restrictions.
Returning the plan using sys.dm_exec_query_plan
Using the sys.dm_exec_query_plan DMF, we can return the plan for a given batch or procedure (which will contain “subplans” for each query comprising the batch). As an example, let’s create a stored procedure, ShowQueryText, execute it, so the plan gets cached, and then extract the plan that was used to execute that stored procedure, as shown in Listing 1.2.
|
1 2 3 4 5 6 7 8 9 10 11 12 13 14 15 16 17 18 19 20 21 22 23 24 25 |
CREATE PROCEDURE ShowQueryText AS SELECT TOP 10 object_id , name FROM sys.objects ; --waitfor delay '00:00:00' SELECT TOP 10 object_id , name FROM sys.objects ; SELECT TOP 10 object_id , name FROM sys.procedures ; GO EXEC dbo.ShowQueryText ; GO SELECT deqp.dbid , deqp.objectid , deqp.encrypted , deqp.query_plan FROM sys.dm_exec_query_stats deqs CROSS APPLY sys.dm_exec_query_plan(deqs.plan_handle) AS deqp WHERE objectid = OBJECT_ID('ShowQueryText', 'p') ; |
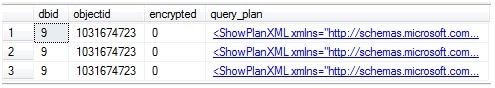
Listing 1.2: Retrieving the query plan for a cached stored procedure.
You will see that we get three rows retunred by query_stats, and each row contains a link to a query plan; in each case this will be the same plan, i.e. the plan for the entire procedure.
Obtaining the plan_handle:
As well as sys.dm_exec_query_stats, the plan_handle can also be retrieved from sys.dm_exec_requests, sys.dm_exec_query_memory_grants and sys.dm_exec_cached_plan.
In SQL Server 2005 Management Studio, you can click on the link to the query plan, thus opening it up as an XML document in SSMS, and then save it with a .SQLPLAN extension (by default it will be saved with an XML extension). You can open it up in SSMS and view the graphical plan. SQL Server 2008 Management Studio realizes the schema is a SQL plan, and so allows us to simply click the XML output to get a display that shows the graphical version of the plan, as shown in Figure 1.1 (cropped to save space).
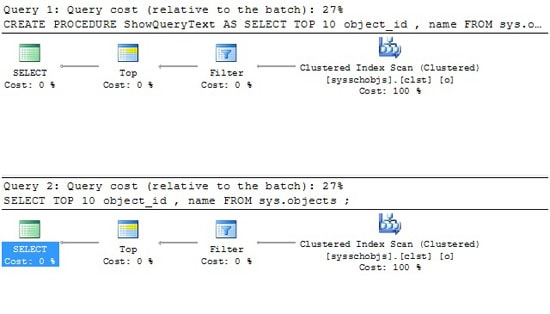
Figure 1.1: Viewing the query plan in Management Studio.
In this way, we can find out precisely how a stored procedure was executed, at the time of being cached.
Dissecting the SQL text
We can use the sql_handle from sys.dm_exec_requests to return the SQL text for the batch, from sys.dm_exec_sql_text, and then dissect the text using “statement offset” columns provided by the former, to get at the text of just the currently executing query.
We can do the same thing when using sys.dm_exec_query_stats, in order to extract query statistics about individual statements within a cached batch/procedure. Let’s take a look at the sql_handle, plan_handle and associated SQL text, returned for each query in our stored procedure, as shown in Listing 1.3.
|
1 2 3 4 5 6 |
SELECT deqs.plan_handle , deqs.sql_handle , execText.text FROM sys.dm_exec_query_stats deqs CROSS APPLY sys.dm_exec_sql_text(deqs.plan_handle) AS execText WHERE execText.text LIKE 'CREATE PROCEDURE ShowQueryText%' |
Listing 1.3: Viewing the sql_handle and plan_handle.
As you can see, each row has the same sql_handle, same plan_handle and the same SQL text (referring to the whole procedure). I’m only showing two of the rows here:
|
1 2 3 4 5 6 |
plan_handle sql_handle text -------------- ------------- ---------------- 0x050002003... 0x03000200...CREATE PROCEDURE ShowQueryText as... 0x050002003... 0x03000200...CREATE PROCEDURE ShowQueryText as... |
Just as when you supply a sql_handle, you are identifying the batch or procedure to which a query belongs, so, when you supply a plan_handle, you are identifying the plan associated with a batch or procedure, and this batch or procedure may contain multiple queries. When you identify a plan for a batch, you identify the associated SQL text for the whole batch, and we’ll need to extract the text for individual queries in that batch, in order to work with the query_stats DMV. Listing 1.4 shows how to do this.
|
1 2 3 4 5 6 7 8 9 10 11 12 13 14 15 16 |
SELECT CHAR(13) + CHAR(10) + CASE WHEN deqs.statement_start_offset = 0 AND deqs.statement_end_offset = -1 THEN '-- see objectText column--' ELSE '-- query --' + CHAR(13) + CHAR(10) + SUBSTRING(execText.text, deqs.statement_start_offset / 2, ( ( CASE WHEN deqs.statement_end_offset = -1 THEN DATALENGTH(execText.text) ELSE deqs.statement_end_offset END ) - deqs.statement_start_offset ) / 2) END AS queryText , deqp.query_plan FROM sys.dm_exec_query_stats deqs CROSS APPLY sys.dm_exec_sql_text(deqs.plan_handle) AS execText CROSS APPLY sys.dm_exec_query_plan(deqs.plan_handle) deqp WHERE execText.text LIKE 'CREATE PROCEDURE ShowQueryText%' |
Listing 1.4: Extracting the SQL text for individual queries in a batch.
We pass the plan_handle to the sql_text DMF (we could equally well pass the sql_handle), which returns the SQL text associated with the plan for that batch. We then extract the text for the individual queries, using the SUBSTRING function, and remembering to divide the offset values by 2 (the start offset, and then the difference between the end and start offsets in the SUBSTRING operation) before we use them, since they are stored in Unicode.
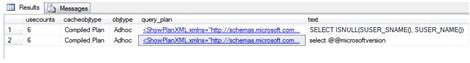
This query should return the three separate queries, as shown in Figure 1.2.
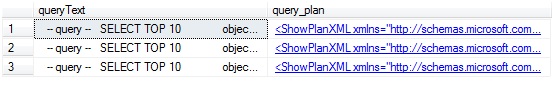
Figure 1.2: Three queries returned by sys.dm_exec_query_stats.
Click on the plan links and you’ll see that the plan returned for each row is still the plan for the whole batch.
Returning the plan using sys.dm_exec_text_query_plan
If we want, for each row, to show only the “subplan” for each individual query, then it is a little trickier, and we have to use the sys.dm_exec_query_plan DMF, which returns the plan in text form and supports offset parameters, which we can use to dissect it. Unfortunately, the sys.dm_exec_query_plan DMF returns the plan in a form we can save and use, but not view in SSMS. Just for demo purposes here, we’ve cast the returned plan to an XML type, but this isn’t a “safe” application.
|
1 2 3 4 5 6 7 8 9 10 11 12 13 14 15 16 17 18 19 20 21 22 23 24 25 26 |
SELECT deqp.dbid , deqp.objectid , CAST(detqp.query_plan AS XML) AS singleStatementPlan , deqp.query_plan AS batch_query_plan , --this won't actually work in all cases because nominal plans aren't -- cached, so you won't see a plan for waitfor if you uncomment it ROW_NUMBER() OVER ( ORDER BY Statement_Start_offset ) AS query_position , CASE WHEN deqs.statement_start_offset = 0 AND deqs.statement_end_offset = -1 THEN '-- see objectText column--' ELSE '-- query --' + CHAR(13) + CHAR(10) + SUBSTRING(execText.text, deqs.statement_start_offset / 2, ( ( CASE WHEN deqs.statement_end_offset = -1 THEN DATALENGTH(execText.text) ELSE deqs.statement_end_offset END ) - deqs.statement_start_offset ) / 2) END AS queryText FROM sys.dm_exec_query_stats deqs CROSS APPLY sys.dm_exec_text_query_plan(deqs.plan_handle, deqs.statement_start_offset, deqs.statement_end_offset) AS detqp CROSS APPLY sys.dm_exec_query_plan(deqs.plan_handle) AS deqp CROSS APPLY sys.dm_exec_sql_text(deqs.plan_handle) AS execText WHERE deqp.objectid = OBJECT_ID('ShowQueryText', 'p') ; |
Listing 1.5: Returning the plan using sys.dm_exec_text_query_plan.
This time, for each row returned, we get the individual plan for each query, as well as the batch plan, as shown in Figure 1.3.
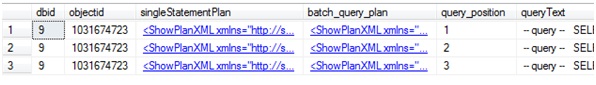
Figure 1.3: Seeing the individual query plans.
Cached Query Plan Statistics
In the previous section, we explained how to use the sys.dm_exec_query_plan function and sys.dm_exec_query_stats DMV to get the text of the plan for a given batch. In this section, we’ll start retrieving some meatier information about the query plans that have been used to execute queries on the server.
The ability to retrieve the text of a query, or query plan, becomes more interesting when combined with data stored in the sys.dm_exec_cached_plans DMV. It returns basic metadata regarding each plan, such as its size and the type of object to which it’s attached, but also, and most interestingly a usecounts column that lets us investigate plan reuse.
The sys.dm_exec_cached_plans DMV
The sys.dm_exec_cached_plans DMV “supersedes” the syscacheobjects object, available in versions of SQL Server prior to 2005. In many ways, syscacheobjects is easier to work with as it includes the text of the query and several attributes about the cached plan, but it is more limited, in that it doesn’t quite give access to the rich array of information that is available through sys.dm_exec_cached_plans, especially when used in concert with sys.dm_exec_query_plan, sys.dm_exec_sql_text and sys.dm_exec_plan_attributes.
The data that the sys.dm_exec_cached_plans view will return is a snapshot of values, based on the current contents of the plan cache. The columns in this view are all pretty useful for seeing how plans are being cached. Those columns are listed below.
- bucketid – the id of the hash bucket where the plan is held. You can see the maximum number of buckets available in the sys.dm_os_memory_cache_hash_tables view. Ideally, cached items (such as plans, and anything else that SQL Server puts into cache) will be spread evenly amongst the hash buckets).
- refcounts – number of cache objects that reference this cached plan.
- usecounts – number of times the plan has been used since its creation. This counter is incremented every time the query is executed, and a match to the plan is made.
- size_in_bytes – size of the plan.
- memory_object_address – internal address of the cached object. Can be used to reference sys.dm_os_memory_objects and sys.dm_os_memory_cache_entries to see the objects in the SQL Server cache.
- cacheobjtype – type of object in the cache. The domain is:
- Compiled Plan
- Parse Tree
- Extended Proc
- CLR Compiled Func
- CLR Compiled Proc.
- objtype – the type of object. The domain is:
- Proc (stored procedure, function)
- Prepared (prepared statement)
- Adhoc (query)
- Repl Proc (replication filter procedure)
- Trigger
- View
- Default
- UsrTab (user table)
- SysTab (system table)
- CHECK
- Rule.
- plan_handle – can be used with query plan functions, including sys.dm_exec_query_plan and sys.dm_exec_sql_text, to get the plan of the query or the text of the query, respectively.
- pool_id – the resource governor pool to which the plan is tied. You can use sys.resource_governor_resource_pools to decipher the value, if you are utilizing resource governor. Note that this column is in SQL Server 2008 only and is part of the Enterprise-only resource governor feature.
A few of these columns merit a bit more discussion. The cachobtype column describes the type of plan that is cached, which can be a normal SQL plan (compiled plan), a parse tree or the stored plan for an extended procedure or CLR object. A parse tree is a bare-bones plan for an object such as a view. It specifies the objects referenced by the view, but does not specify a full execution plan. Views are compiled into the query at run time; they do not have plans of their own.
The objtype column, in turn, specifies the type of object, determing whether it is typical T-SQL or a compiled object, such as a stored procedure or prepared statement. Note that a prepared statement (an ad hoc statement from the client, where they have used the API to prepare a plan ahead of time) has a different plan than an ad hoc query.
Zero cost and stale plans
Remember, again, that not all queries that have been executed on your server will have saved a plan. Zero cost plans like “SELECT ‘hi'” would not, for sure. Also, as plans become stale, they could be removed from cache, particularly if the server is under memory pressure.
So, for example, you can retrieve the plans for any compiled object, using the query shown in Listing 1.6:
|
1 2 3 4 5 6 7 |
SELECT refcounts , usecounts , size_in_bytes , cacheobjtype , objtype FROM sys.dm_exec_cached_plans WHERE objtype IN ( 'proc', 'prepared' ) ; |
Listing 1.6: Retrieving the plans for compiled objects.
You are likely to find that there are compiled plans for both procedures and prepared statements, as well as some extended and CLR objects, if you use them.
Investigating plan reuse
Good plan reuse is one sign of a heathy system. Compiling a query plan can be a CPU-intensive operation, especially with complex queries, so reuse is a very good thing. The greater the value in the usecount column for each of your plans, the greater the number of times query plans are reused, and the fewer the number of times a new query plan has to be recreated. Conversely, a usecount of 1 for a large number of plans indicates that your cache space is being taken up with plans that were compiled and used once to execute an ad hoc query, then never used again. By querying sys.dm_exec_cached_plans and aggregating on the usecount column we can, as we will show, get a good overview of the extent to which plans are being reused in your system.
The more you can use stored procedures or, at the very least, prepared SQL, the more likely you are to get plan reuse. The more reusable plans you have, the less work the optimizer needs to do.
One of the most critical factors in determining reuse is the text of the query. If the text of a query submitted for execution matches the text of a query in the cache, then the plan for that cached query may be reused.
Criteria in determing plan reuse
The text of the query is not the only criterion in determing plan reuse. The attributes of the plan are figured in also, which we will cover in a later section, Query Plan Attributes.
Of course, if you use stored procedures as the primary interface to your SQL Server data, then you have a much cleaner way of ensuring reuse.
A database setting that can be helpful to plan reuse is forced parameterizaton (set using ALTER DATABASE <databaseName> SET PARAMETERIZATION FORCED). Normally, the query optimizer is very conservative when deciding what queries can be parameterized, but this setting makes the optimizer be more liberal in choosing parameters. For more reading on this subject, look for “Forced Parameterization” in Books Online.
Finally, bear in mind that you need to be careful when interpreting the results of data based on plan reuse. After a restart, cache flush, procedure recreation, and so on, plan use counts will be low without it being indicative of a problem. Alternatively, you may have been doing some special processing that inflates the counts and makes things look better than normal. As is true with most of the DMVs, the data you get from the cached_plans DMV is not information until it has context. Context comes from tracking the data over long periods of time and comparing like time periods of server activity.
As dicussed earlier, you might want, particularly for testing purposes, to consider clearing the cache at a fixed time (e.g. 12 a.m.) each day, to give the results more context.
The plan reuse “distribution curve”
A simple query, such as that shown in Listing 1.7, will show you how many plans are cached.
|
1 2 |
SELECT COUNT(*) FROM sys.dm_exec_cached_plans ; |
Listing 1.7: Total number of cached plans.
More useful though, is to get a feel for the “distribution” of plan reuse on your system. To do this, we can group on the usecounts column, and use the CASE expression to roll up bands of usecounts as shown in Listing 1.8.
|
1 2 3 4 5 6 7 8 9 10 11 12 13 14 15 16 17 18 19 20 |
SELECT MAX(CASE WHEN usecounts BETWEEN 10 AND 100 THEN '10-100' WHEN usecounts BETWEEN 101 AND 1000 THEN '101-1000' WHEN usecounts BETWEEN 1001 AND 5000 THEN '1001-5000' WHEN usecounts BETWEEN 5001 AND 10000 THEN '5001-10000' ELSE CAST(usecounts AS VARCHAR(100)) END) AS usecounts , COUNT(*) AS countInstance FROM sys.dm_exec_cached_plans GROUP BY CASE WHEN usecounts BETWEEN 10 AND 100 THEN 50 WHEN usecounts BETWEEN 101 AND 1000 THEN 500 WHEN usecounts BETWEEN 1001 AND 5000 THEN 2500 WHEN usecounts BETWEEN 5001 AND 10000 THEN 7500 ELSE usecounts END ORDER BY CASE WHEN usecounts BETWEEN 10 AND 100 THEN 50 WHEN usecounts BETWEEN 101 AND 1000 THEN 500 WHEN usecounts BETWEEN 1001 AND 5000 THEN 2500 WHEN usecounts BETWEEN 5001 AND 10000 THEN 7500 ELSE usecounts END DESC ; |
Listing 1.8: An overview of plan reuse.
For a server that had been up for two days, we got the following results:
|
1 2 3 4 5 6 7 8 9 10 11 12 13 14 15 16 17 18 19 20 21 |
usecounts countInstance ----------- ------------- 169279 1 100911 1 18379 1 17817 1 16608 1 10004 1 5001-10000 19 1001-5000 87 101-1000 127 10-100 359 9 9 8 55 7 12 6 51 5 18 4 628 3 73 2 277 1 1988 |
So, for example, we have five plans that have been reused over 10,000 times, 359 plans that have been reused between 10 and 100 times, 1,988 plans that have only been used once, and so on. Clearly, this is only an overview, and just to give you an overall feel for plan resue. It’s a query I like to run semi-regularly to see if there’s any noticable change in the “distribution” to more (or less) reuse.
While it is clear from the listing that we are probably getting decent reuse (particularly on a few often-executed queries), what we cannot tell at this point is how many queries are being executed on the server (although we can find that out) or how many get flushed from cache. What you will be able to tell is the most important queries that get reused, and a place to look for improvements.
The next step is to examine those plans at the extreme ends of the spectrum. If we can improve the efficiency of a plan that that is being reused many times, it could be highly beneficial. Likewise, we need to find out more information about the plans that are never reused, why this might be, and if there is anything we can do about it.
Examining frequently-used plans
Using sys.dm_exec_cached_plans in conjunction with sys.dm_exec_query_plan and sys.dm_exec_sql_text, we can construct a query to return the text of the plan, plus the text of the query that is associated with the plan and has the highest use counts. So, if we identify a query, using Profiler or one of the operating system-related DMOs, that is offensive for some performance reason (CPU pressure, duration, memory utilization, etc.), and then find that it is attached to a plan with a very high usecount, then we know we’ve found a good place to start our tuning efforts for the day.
The script in Listing 1.9 returns, for the most-reused plans, the query plan itself, the type of object or query with which the plan is associated and the SQL text for that query or object.
|
1 2 3 4 5 6 7 8 9 10 |
SELECT TOP 2 WITH TIES decp.usecounts , decp.cacheobjtype , decp.objtype , deqp.query_plan , dest.text FROM sys.dm_exec_cached_plans decp CROSS APPLY sys.dm_exec_query_plan(decp.plan_handle) AS deqp CROSS APPLY sys.dm_exec_sql_text(decp.plan_handle) AS dest ORDER BY usecounts DESC ; |
Listing 1.9: Investigating the most-used plans.
The real beauty of being able to do this from SQL, rather than some prebuilt report, is that you have the full power of the query engine in your hands. For example, if we want to look at only plans for stored procedures, we can simply filter on objtype = ‘proc’.
Of course, this is only one piece of the puzzle and, later in the article, when we start to look at how we can see the individual queries from a batch or compiled object that make up the entire plan, it will become more useful to the tuning efforts.
We can examine our frequently-reused plans for queries that contain certain text, as we did previously in Listing 1.3. Alternatively, we can filter on the objectid, to examine plan reuse for a single procedure, as shown in Listing 1.10.
|
1 2 3 4 5 6 7 8 9 |
SELECT usecounts , cacheobjtype , objtype , OBJECT_NAME(dest.objectid) FROM sys.dm_exec_cached_plans decp CROSS APPLY sys.dm_exec_sql_text(decp.plan_handle) AS dest WHERE dest.objectid = OBJECT_ID('<procedureName>') AND dest.dbid = DB_ID() ORDER BY usecounts DESC ; |
Listing 1.10: Examining plan reuse for a single procedure.
In SQL Server 2008, we can use the sys.dm_exec_procedure_stats DMV to look exclusively at cached plans for stored procedures. We’ll examine this DMV a little later.
Examining ad hoc single-use plans
The script in Listing 1.11 uses the sys.dm_exec_cached_plans DMV and sys.dm_exec_sql_text DMF to retrieve the text for each single-use plan that is bloating the plan cache.
|
1 2 3 4 5 6 7 8 9 10 |
-- Find single-use, ad hoc queries that are bloating the plan cache SELECT TOP ( 100 ) [text] , cp.size_in_bytes FROM sys.dm_exec_cached_plans AS cp CROSS APPLY sys.dm_exec_sql_text(plan_handle) WHERE cp.cacheobjtype = 'Compiled Plan' AND cp.objtype = 'Adhoc' AND cp.usecounts = 1 ORDER BY cp.size_in_bytes DESC ; |
Listing 1.11: Examining single-use plans in the cache.
This query will identify ad hoc queries that have a use count of 1, ordered by the size of the plan. It provides the text and size of single-use ad hoc queries that waste space in plan cache. This usually happens when T-SQL commands are built by concatenating a variable at the end of a “boilerplate” T-SQL statement. A very simplified example is shown in Listing 1.12.
|
1 2 3 4 5 6 7 8 9 10 11 |
-- Query 1 SELECT FirstName , LastName FROM dbo.Employee WHERE EmpID = 5 -- Query 2 SELECT FirstName , LastName FROM dbo.Employee WHERE EmpID = 187 |
Listing 1.12: Non-parameterized ad hoc SQL.
Even though these two queries are essentially identical, they might each have a separate plan in the cache, just because the literal value is different in each case. Actually these two queries are so simple (with no joins) that SQL Server would probably parameterize them, even using just the default simple parameterization (as opposed to forced parameterization). However, in more complex cases, plan reuse would probably not be possible. While we can do our best to make sure queries are written in a way that enables plan reuse, users and utilities often execute batches that simply will have little reuse.
For SQL Server 2008, if you determine that you have a mostly ad hoc workload with minimal reuse, check out the “optimize for ad hoc workloads” system option. This setting changes SQL Server behavior and does not store a plan on first usage, only the query text. If it matches a second time, the plan is stored. Note that “ad hoc”, in this sense, does vary from some people’s understanding of the term. Here, it simple refers to the use of random queries that don’t promote reuse.
Query Plan Attributes
In the previous sections, we’ve covered how we get the text of a query plan and then examine plan reuse on your system, using the cached_plans DMV. In addition, a DBA will sometimes want to find out “state” information about a particular plan, along with further details about how that plan is currently being used.
The database engine takes into account several factors when considering a plan for reuse. One of these factors, as we discussed previously, is the text of the query. However, other attributes are important, too, the values for which are stored in the sys.dm_exec_plan_attributes function, described by BOL as follows:
“Returns one row per plan attribute for the plan specified by the plan handle. You can use this table-valued function to get details about a particular plan, such as the cache key values or the number of current simultaneous executions of the plan.”
Like sys.dm_exec_query_plan, sys.dm_exec_plan_attributes takes a plan_handle as a parameter and returns the following columns:
- attribute – name of the attribute
- value – the current value assigned to the attribute
- is_cache_key – indicates if the attribute is part of how SQL Server resolves the plan. A value of 1 indicates that it is, and 0 that it is not.
This DMV returns one row per plan attribute, and available attributes include:
- set_options – the options values (the ones that can be found using @@options, such as SET NOCOUNT) that were in use when the plan was built
- date_format – the date format of the connection that created the plan
- inuse_exec_context – the number of currently executing batches that are using the plan
If the value of is_cache_key is 1 for a given attribute, then that attribute forms part of the “key” that is used when SQL Server searches the cache for a suitable plan. During the process of checking the cache for a match, the text of a submitted query is compared to the text of other queries that have been executed and for which a plan is stored. Even if the text of the queries matches exactly, the submitted query’s attributes would also need to match exactly those for the cached plan, for every attribute with a value of 1 for the is_cache_key column in sys.dm_exec_plan_attributes.
Consider, for example, the code in Listing 1.13, which uses a plan_handle extracted from sys.dm_exec_cached_plans, on my test server, and supplies it as a parameter to sys.dm_exec_plan_attributes. Note the use of TOP 1 … ORDER BY usecounts DESC in the derived table to get the largest reused plan.
|
1 2 3 4 5 6 7 8 9 10 11 |
SELECT CAST(depa.attribute AS VARCHAR(30)) AS attribute , CAST(depa.value AS VARCHAR(30)) AS value , depa.is_cache_key FROM ( SELECT TOP 1 * FROM sys.dm_exec_cached_plans ORDER BY usecounts DESC ) decp OUTER APPLY sys.dm_exec_plan_attributes(decp.plan_handle) depa WHERE is_cache_key = 1 ORDER BY usecounts DESC ; |
Listing 1.13: Examining plan attributes.
This returns the following results:
|
1 2 3 4 5 6 7 8 9 10 11 12 13 |
attribute value is_cache_key ---------------------------- -------------------- - set_options 187 1 objectid 733550834 1 dbid 4 1 dbid_execute 0 1 user_id -2 1 language_id 0 1 date_format 1 1 date_first 7 1 status 8 1 required_cursor_options 0 1 acceptable_cursor_options 0 1 |
So, in order for a cached plan to be used to execute the query in Listing 1.13, all of the returned attribute values would have to match. For example, both the submitted query and the cached plan would need to have set_options = 187, objectid = 733550834, dbid = 4, and so on. If there was a mismatch of any kind, a new plan would be generated. So, for example, say you were testing the query in Management Studio in the context of a database different to the one used when an application first issued the query. The attributes of the existing plan for the application-issued query, and those for your SSMS-issued query, might match in terms of the SQL text and maybe even the objectid (somewhat less likely), but the dbid would be different, so the plan would not get reused and a new one would be created. In such cases, the SQL text for the query, as identified by the sql_handle, would now be associated with more than one plan, i.e. there would be more than one plan_handle associated with a given sql_handle.
This sounds rather horrible, but it’s important to realize that each of these attributes, including security attributes, is important for determining how the query will be executed. Furthermore, one shouldn’t really expect the same plan to be used, even if the SQL text and some of the attributes match. One database may have zero rows in table X, whereas the other one may have 1.5 billion; same exact query text, vastly different plans.
Checking the attributes of a plan is not necessarily a very common thing to need to do as, most of the time, your client will have a very standard set of settings. However, on that rare occasion that you see no plan reuse, but you can clearly see multiple queries with the same query text, the sys.dm_exec_plan_attributes DMV will help you seek out the reasons.
Gathering Query Execution Statistics
Up to this point in the article, we’ve shown how to get the text of a cached plan, and how to return detailed information about those plans. One plan is stored for a batch or an object and we used sys.dm_exec_cached_plans to get plan information.
Each plan has 1-to-N queries and, in this section, we’re going to explore how to get detailed information about the individual queries in the batch or object. To get these query statistics, be it for a standalone query or a query within a larger stored procedure or prepared statement, we use the sys.dm_exec_query_stats DMV.
The sys.dm_exec_query_stats DMV will return one row per query that is executed within a batch or stored procedure, and provides columns such as total_worker_time (CPU), total_physical_reads, total_logical_reads and so on, which can give you a very useful overview of the system resources that your queries are eating up.
Pre-SQL Server 2005, the only way to get this sort of information was through Profiler. However, Profiler only lets you collect the information as the queries occur, not after the event. Now, the next time you hear about a problem second-hand, while walking down the hallway, which is too often how users report problems, you’ll be able to interrogate the sys.dm_exec_query_stats DMV and find out what happened. This is an exciting step forward for most DBAs, especially given that resorting to Profiler after the event often entailed capturing traces over long periods of time, in order to reobserve the problem, and this could be really costly in terms of server resources and programmer sanity, since doing the matching of query text after the fact is very difficult.
Overview of sys.dm_exec_query_stats
The sys.dm_exec_query_stats DMV contains quite a few columns that are incremented counters, and provide information about how many times a query has been executed and the resources that were used. It is described by BOL as follows:
“Returns aggregate performance statistics for cached query plans. The view contains one row per query statement within the cached plan, and the lifetime of the rows is tied to the plan itself. When a plan is removed from the cache, the corresponding rows are eliminated from this view.”
As a whole, it provides a wealth of information regarding resource-hungry queries on your system, for which a plan is cached. The columns that can be returned are as follows:
- sql_handle – identifies the batch or procedure to which a query belongs; it is used by sys.dm_exec_sql_text to get the text of the batch
- statement_start_offset – the starting point of the query within the batch or object to which the query belongs
- statement_end_offset – the end point of the query that is currently executing, within the batch or object to which the query belongs
- plan_generation_num – indicates the version of the query plan that has been created after a recompile; used for comparisons because the actual plan may change (or even partially change for a statement-level recompile), even though the SQL stays the same
- plan_handle – identifies the cached query plan for a batch or stored procedure that has been executed; used by sys.dm_exec_query_plan or sys.dm_exec_text_query_plan to get the plan of an executed query in XML format
- creation_time – time the plan was created
- last_execution_time – last time the execution plan was used to execute a query
- execution_count – number of times the plan has been used to execute a query
- total_worker_time, last_worker_time, min_worker_time, max_worker_time – total, last, min, and max amount of time spent in CPU utilization to execute the query, based on this plan
- total_physical_reads, last_physical_reads, min_physical_reads, max_physical_reads – total, last, min, and max number of reads to the physical hard disk system
- total_logical_writes, last_logical_writes, min_logical_writes, max_logical_writes – total, last, min, and max number of writes to the buffer cache to be written by lazy writer
- total_logical_reads, last_logical_reads, min_logical_reads, max_logical_reads – total, last, min, and max number of reads from the SQL Server cache buffer that never had to go to the physical hard disk system to satisfy the current request; this data was read in previously and was still in cache
- total_clr_time, last_clr_time, min_clr_time, max_clr_time – total, last, min, and max amount of time spent in the CLR processor for the query that utilized this plan
- total_elapsed_time, last_elapsed_time, min_elapsed_time, max_elapsed_time – in ms, the total, last, min, and max amounts of time it took to execute the entire query.
Note: Time columns are in microseconds.
Putting sys.dm_exec_query_stats to work
Once you are able to extract individual statements from a batch, as demonstrated in the earlier section, Dissecting the SQL Text, you can use sys.dm_exec_query_stats to access the query statistics for individual SQL statements that are executing on your system. The sky is the limit with regard to how you might use this information to find where you have performance issues.
Generally speaking, at the point where you would turn to sys.dm_exec_query_stats, you would already have an idea of whether your system is IO bound, CPU bound, or having CLR performance issues, and so on, likely from using other DMVs or a tool such as the performance monitor (PerfMon). So, your goal at this stage would be to get a ranked list of queries that are having the biggest effect on the issue that you’ve identified.
Before we look at the scripts, it is important to remember when using this DMV that there is usually, but not necessarily, a one-to-one relationship between a sql_handle and a plan_handle. One sql_handle can sometimes be associated with more than one plan_handle. This can be caused by statement-level recompilation (see http://technet.microsoft.com/en-us/library/ee343986(SQL.100).aspx for more details), or by the exact same SQL text being executed with different attribute values, as discussed earlier.
Let’s say that you’ve identified that your sytem is CPU bound. Using the total_worker_time column, you can find out which queries your server is spending the most time executing. However, it isn’t enough just to know that the server is spending a lot of time executing a particular query. In fact, without context, this piece of information is more or less meaningless. It might be that the query is run a million times, and no other query is executed more than a thousand times. So, to add the required context, we include the execution_count, along with a calculation of the average CPU time, as shown in Listing 1.14.
|
1 2 3 4 5 6 7 8 9 10 11 12 13 14 15 16 17 |
SELECT TOP 3 total_worker_time , execution_count , total_worker_time / execution_count AS [Avg CPU Time] , CASE WHEN deqs.statement_start_offset = 0 AND deqs.statement_end_offset = -1 THEN '-- see objectText column--' ELSE '-- query --' + CHAR(13) + CHAR(10) + SUBSTRING(execText.text, deqs.statement_start_offset / 2, ( ( CASE WHEN deqs.statement_end_offset = -1 THEN DATALENGTH(execText.text) ELSE deqs.statement_end_offset END ) - deqs.statement_start_offset ) / 2) END AS queryText FROM sys.dm_exec_query_stats deqs CROSS APPLY sys.dm_exec_sql_text(deqs.plan_handle) AS execText ORDER BY deqs.total_worker_time DESC ; |
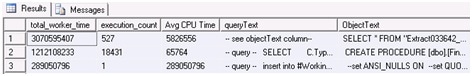
Listing 1.14: Finding the CPU-intensive queries.
The results, representing a set of queries from a busy server, were extensive, but we’ve only shown the first three queries here (we don’t get paid by the page, unfortunately). From here, we can start to get a feeling for what queries are hurting the CPU the most since the last system reboot. However, bear in mind the earlier discussion in the Flushing the Cache? section, with regard to the different lengths of time plans will have been in the cache, and how this can skew the results.
At this stage, it’s somewhat difficult to gauge which of these queries is the most pertinent to the performance issue, but these statistics make an excellent starting point for our investigations. The first query executed 527 times and is taking the most time, while the second one has been executed almost four times as frequently, but is taking one-third of the CPU time. The third query only ran once, but took a huge amount of CPU time. This is troublesome since it is impossible to know whether this was a one-off event, or if this query just hasn’t run that often since the server was restarted or DBCC FREEPROCCACHE was executed to clear the query cache. An interesting column to check, especially with regard to a plan with a single execution like this one, is last_execution_time, which will tell you exactly when the plan was last used. Along with the query text, this can help you to judge whether or not this execution was planned, and is part of you normal query workload, or is just an unfortunate ad hoc query execution.
The next step would be to plug the plan_handle for each query (which I didn’t include in the results due to space constraints) into the sys.dm_exec_query_plan (see the section entitled Viewing the Text of Cached Queries and Query Plans) and investigate how each query is being executed, and whether the query can be optimized.
There is a lot more useful data that can be extracted from the sys.dm_exec_query_stats DMV using variations of the previously described techniques, based on “isolating” individual queries through the _offset values, filtering on specific objects, and so on. For example, you could write similar queries focusing on the following DMV columns:
- excessive logical writes – data written to cache (which gets written to the physical hard disk via the lazy writer)
total_logical_writes, last_logical_writes, min_logical_writes, max_logical_writes - excessive logical reads – queries that required the most data to be read from cache (possibly causing memory pressure)
total_logical_reads, last_logical_reads, min_logical_reads, max_logical_reads - · <![endif]> excessive physical reads – queries that forced the most physical hard disk access (generally caused by the need for more cache memory than was available, equating to heavy memory pressure since data could not be read from the cache)
total_physical_reads, last_physical_reads, min_physical_reads , max_physical_reads - · <![endif]> long-running queries
total_elapsed_time, last_elapsed_time, min_elapsed_time, max_elapsed_time - expensive CLR code
total_clr_time, last_clr_time, min_clr_time, max_clr_time.
As discussed in the introduction to this article, it’s true that you can get similar information from the management reports in SSMS. The real win with the DMOs is the degree of control and granularity you can achieve through the WHERE clause. For example, we could easily modify the query in Listing 1.13 to return statistics only for batches that reference the account table, simply by adding the appropraite WHERE clause:
|
1 |
WHERE execText.text LIKE '%account%' |
Of course, we will probably have to be cleverer with the LIKE criteria if we have tables (not to mention columns) named account and accountContact, but this is just a SQL task. We could also use the entire definition of queryText and just look for the individual queries. This technique will come in handy many times when optimizing data access to a given object because, unlike most tools that come prebuilt, we can create queries that only look at a very small subsection of queries, eliminating noise that is perhaps not interesting to us during the current tuning process.
Finally, there are times when we want to see the results at a complete query/batch level, rather than for the individual parts of the query, which may have their own plans. This is complicated by the fact that, as discussed, one sql_handle may be associated with more than one plan_handle. Therefore, in order to see the total stats for all queries in the same batch, we need to group on the sql_handle and sum the values, as shown in Listing 1.15.
|
1 2 3 4 5 6 7 8 9 10 11 12 13 |
SELECT TOP 100 SUM(total_logical_reads) AS total_logical_reads , COUNT(*) AS num_queries , --number of individual queries in batch --not all usages need be equivalent, in the case of looping --or branching code MAX(execution_count) AS execution_count , MAX(execText.text) AS queryText FROM sys.dm_exec_query_stats deqs CROSS APPLY sys.dm_exec_sql_text(deqs.sql_handle) AS execText GROUP BY deqs.sql_handle HAVING AVG(total_logical_reads / execution_count) <> SUM(total_logical_reads) / SUM(execution_count) ORDER BY 1 DESC |
Listing 1.15: Grouping by sql_handle to see query stats at the batch level.
Investigating Expensive Cached Stored Procedures
New to SQL Server 2008 is the sys.dm_exec_procedure_stats DMV that focuses only on stored procedures and will not require you to aggregate on sql_handle to get an overall view of your object’s performance characteristics. It is described by BOL as follows:
“Returns aggregate performance statistics for cached stored procedures. The view contains one row per stored procedure, and the lifetime of the row is as long as the stored procedure remains cached. When a stored procedure is removed from the cache, the corresponding row is eliminated from this view. At that time, a Performance Statistics SQL trace event is raised similar to sys.dm_exec_query_stats.”
It is similar in nature to sys.dm_exec_query_stats, but with a few differences in the columns available. It only links to the plan of the procedure or object, not the individual statements in the procedure. This DMV allows you to discover a lot of very interesting and important performance information about your cached stored procedures.
|
1 2 3 4 5 6 7 8 9 10 11 12 13 14 15 16 17 |
-- Top Cached SPs By Total Logical Reads (SQL 2008 only). -- Logical reads relate to memory pressure SELECT TOP ( 25 ) p.name AS [SP Name] , deps.total_logical_reads AS [TotalLogicalReads] , deps.total_logical_reads / deps.execution_count AS [AvgLogicalReads] , deps.execution_count , ISNULL(deps.execution_count / DATEDIFF(Second, deps.cached_time, GETDATE()), 0) AS [Calls/Second] , deps.total_elapsed_time , deps.total_elapsed_time / deps.execution_count AS [avg_elapsed_time] , deps.cached_time FROM sys.procedures AS p INNER JOIN sys.dm_exec_procedure_stats AS deps ON p.[object_id] = deps.[object_id] WHERE deps.database_id = DB_ID() ORDER BY deps.total_logical_reads DESC ; |
Listing 1.16: Investigating logical reads performed by cached stored procedures.
Depending on what columns you include, and which column we order by, we can discover which cached stored procedures are the most expensive from several different perspectives. In this case, we are interested in finding out which stored procedures are generating the most total logical reads (which relates to memory pressure). This query is especially useful if there are signs of memory pressure, such as a persistently low page life expectancy and/or persistent values above zero for memory grants pending. This query is filtered by the current database, but we can change it to be instance-wide by removing the WHERE clause.
Simply by selecting the total_physical_reads column, instead of total_logical_reads, in this query, we can perform the same analysis from the perspective of physical reads, which relates to read, disk I/O pressure. Lots of stored procedures with high total physical reads or high average physical reads, could indicate severe memory pressure, causing SQL Server to go to the disk I/O subsystem for data. It could also indicate lots of missing indexes or “bad” queries (with no WHERE clauses, for example) that are causing lots of clustered index or table scans on large tables.
Be aware though, that there are a couple of caveats with these queries. The big one is that you need to pay close attention to the cached_time column as you compare rows in the result set. If you have stored procedures that have been cached for different periods of time, then this will skew the results. One easy, but perhaps controversial, solution to this problem is to periodically clear your procedure cache, by running DBCC FREEPROCCACHE with a SQL Agent job, as previously discussed.
The second caveat is that only cached stored procedures will show up in these queries. If you are using WITH RECOMPILE or OPTION(RECOMPILE), which is usually not a good idea anyway, then those plans won’t be cached.
Getting Aggregate Query Optimization Statistics for All Optimizations
In this section, we will look at how we can get statistics on all optimizations that have been performed by the optimizer, regardless of whether or not a plan has been stored. This data is available from the sys.dm_exec_query_optimizer_info DMV and it will allow us to get a feel for how queries have been optimized, and how many of them have been optimized, since the last time the server was restarted.
The data available from this DMV is often not attainable by looking at actual plan usage, and it can be very useful in gaining an overall understanding of the performance of a server. For example, trivial plans are not stored in cache, so we can’t get any information on them from the cached plan views but _query_optimizer_info can tell us the number of times a trivial plan was obtained.
This view also provides a lot of other information that can only be found here (or attained in real time, using Profiler), such as the types of statements that are being optimized, the number of hints used, and so on.
The sys.dm_exec_query_optimizer_info DMV provides information on optimizer activity in the form of a set of counters. Every time a type of optimization occurs, the counter will be incremented and, in some cases, a current value will be included in an average. The counters are only incremented when a new query plan is created, so when query plans are matched and reused, there is no need for a compilation, so there would be no change to these counters. The three columns returned by this DMV are as follows:
- counter – the type of operation that the optimizer has done
- occurrence – number of times the operation the counter represents has occurred
- value – may or may not have some value, but is typically an average of the values that were recorded when the counter was written to.
The view will return one row for each of the possible counter types. The domain of counter values includes optimizations, which is the total count of optimizations since system start; elapsed time which is the average elapsed time to complete the optimization of an individual statement, in seconds (averaged over total count of optimizations) and a lot of other interesting values that can tell you the number of insert, delete, or update statements that have been optimized, queries optimized with subqueries, and many others.
For example, on a freshly restarted server, let’s take a look at three of the counters, as shown in Listing 1.17.
|
1 2 3 4 5 |
SELECT counter , occurrence , value FROM sys.dm_exec_query_optimizer_info WHERE counter IN ( 'optimizations', 'elapsed time', 'final cost' ) ; |
Listing 1.17: Examine optimizer counters
his returns something along the lines of:
|
1 2 3 4 5 |
counter occurrence value ------------------- ----------------------- optimizations 5 1 elapsed time 5 0.0074 final cost 5 0.0225006594 |
From this data we can see that:
- there have been a total of five statements optimized, and and for which a plan has been created (the value column for optimizations is documented as having no meaning in Books Online)
- the average average elapsed time spent optimizing each of the five statements was 0.0074 seconds
- the average cost of producing an optimized plan in each case was ~ 0.023.
Using these counters, and some of the others, we can determine how often statements are being compiled. Of course, the usual caveats apply in that, since the values start accumulating as of the start of the server, there may be more or less information to be gathered from the data. I certainly won’t make the claim that you can necessarily discern anything from these values without any other data. It can help to track the accumulating counter type values over time.
Assuming there is only one user on the system, if we re-execute the query in Listing 1.17 the values will probaly remain the same, as we just executed the same exact statement and a plan already exists. However, try making the query upper case, as shown in Listing 1.18.
|
1 2 3 4 5 |
SELECT COUNTER , OCCURRENCE , VALUE FROM SYS.DM_EXEC_QUERY_OPTIMIZER_INFO WHERE COUNTER IN ( 'optimizations', 'elapsed time', 'final cost' ) ; |
Listing 1.18: Trivial changes to query text can affect plan reuse.
Now the query text does not match that of the previous query so, when we execute it, a new plan will have to be created and we should see the occurrence column incremented in value, and there may be some difference in the average times.
|
1 2 3 4 5 |
counter occurrence value ------------------- ---------------------- optimizations 9 1 elapsed time 9 0.03867 final cost 9 0.10053 |
Note that the number of optimizations didn’t increment by just 1. When a server is starting up there are many things going on. I also started up Agent when I restarted the server and there were compilations for those queries as well.
Summary
With the information in this article, you can really start to get a picture of a system’s query health, even if you have not had long-term access to the server. The scripts presented are especially useful when you need to start to drill down into a performance bottleneck, having established a high-level idea of what is the biggest performance bottleneck.
One of the biggest advantages of examining cached queries and plans is that the DBA can take a longer term view of performance diagnosis, beyond simply responding to what is happening right now on the server. By running these scripts regularly, the DBA can proactively tune queries that may be hogging resources, but not yet to the extent that it is being noticed by an end-user (thereby raising it to the level of national emergency).
We’ve seen how to extract the query plan and SQL text from sys.dm_exec_sql_text and sys.dm_exec_query_plan functions, and how to investigate plan reuse, using sys.dm_exec_cached_plans and sys.dm_exec_plan_attributes. However, the centerpieces of our diagnostic efforts, in this article, were the sys.dm_exec_query_stats and sys.dm_exec_procedure_stats views, from which we obtained extremely valuable information regarding the time and resources used by our most expensive queries and stored procedures. Bear in mind that the plans don’t stay in the cache forever, so it isn’t a perfect science, but larger-cost plans do tend to stick around.
Lastly, we looked at the sys.dm_exec_query_optimizer_info DMV that lets you get an understanding of the overall performance of the optimizer, which includes all optimizations, including ones that create trivial plans that are never stored in the cache.
This document contains proprietary information and is protected by copyright law.
Copyright © 2026 Red Gate Software Limited. All rights reserved


Load comments