
The previous article in this series, Building Basic Reports, showed how to use the SQL Server Reporting Services 2012 (SSRS) Report Wizard, and Report Designer, for rapid report prototyping. This article will explore many of the functions and controls we can use every day, as an SSRS developer, to produced more advanced, custom reports.
It will investigate:
- Use of expressions that allow you to dynamically control nearly every aspect of reporting from control properties to data binding
- Common functions that allow run calculations and manipulate data within the report itself
- Custom code, used to build your own library of functions within the report.
- Grouping levels, used to organize the data
You will also set up a Matrix report and create a sub-report. Lastly, you will add some flair to the report by adding dynamic drills and sorting.
Getting started
In order to work through the examples, you will need to have installed and configured SQL Server 2012, SQL Server 2012 Reporting Services, and SQL Server Data Tools (SSDT). The examples will also work with the 2008 R2 version of Reporting Services, in which case you will need Business Intelligence Development Studio (BIDS) instead of SSDT for report development. For further details, please refer back to the Installing and Configuring Reporting Services section of the Building Basic Reports article. SQL Server 2014 was released just a few months before this article was written. There were no changes in report development with this release, so any examples in this series will work in this version, too.
The examples in this article pick up where the previous article left off, but if you are starting from scratch, the code bundle for this article (see the Code Download at the bottom of the article) contains all the files you need to get started. First, create the ReportDemo database, by running the ReportingDemoDatabaseScript.sql script. Next, start a new Report Server project in SSDT. Select Project | Add Existing Item to add to the project the shared data source (ReportDb.rds) and the sample report, FirstReportMan.rdl from the downloaded project.
Open up the shared data source and set the server and database for your SQL Server. If using SQL Server authentication, enter the login and password to point to your copy of the database. Finally, rename the report ExpressionReport.rdl and double-click it in the Solution Explorer to load it into the designer.
Expressions
An expression is a short statement, written in code, which sets the value of a property. An expression can set the value of a property based on just about any data available in the report including parameters, report global values, fields in a dataset, and built-in functions.
There are many common requests that we can satisfy by adding expressions to our reports. One common request is to alternate the background colors of the rows to make a large report more readable. Another popular reason to add an expression is to change the font color for certain values, such as red for negative profit numbers.
The expression feature adds a great deal of versatility to SSRS because it allows most aspects of the report to behave dynamically. Rather than using a hard-coded value for a particular property, SSRS resolves the expression to set the value for the property.
Highlight any control or element on a report and scroll through its Properties window and you will notice that as well as hard-coding most of the property values, you can also set them through an expression (that’s the <expression> option you see everywhere). You will also see buttons labeled fx in the pop-up Properties dialog. Either route will access the expression editor, shown in Figure 1.
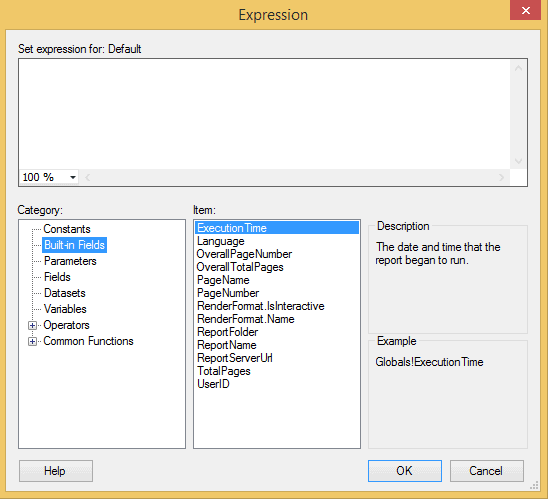
Figure 1
As you can see in Figure 1, you can build expressions based on simple constants, parameters, dataset fields, functions and operators.
For example, in order to highlight in bold type all the customers from a particular state, you can build a simple expression and apply it to the FontWeight property of the detail rows in the table. Click the left edge of the row to select the entire row. The expression might look as follows:
|
1 |
=iif(Fields!State.Value = "CA", "Bold", "Normal") |
The expression starts with “=” and then iif, which is a flow control statement commonly used in SSRS expressions. Its format is:
|
1 |
=iif (boolean statement, true result, false result) |
If the boolean statement is true, then the true result is returned, and if not, the false result is returned. So, in this case, if the State value is California, then the expression returns the value “Bold”, for the FontWeight property, and if not, it returns “Normal”.
When you run the report, it will display in bold text each row where the value of the State field is California. Add the State field to the report and try this out. This simple expression will work if you are only interested in the data from California. However, it would be ridiculous to have one report for each state, so you can make this expression even more dynamic by adding a report parameter that will determine which State to highlight when the report is run.
First, add the new parameter to the report. From the Report Data window right-click on the Parameters folder and select Add Parameter. Call the new parameter HighlightState and change the Prompt property to Highlight State. On the Available Values page, select Specify Values and then use Add to enter the following:
| California | CA |
| Florida | FL |
| Louisiana | LA |
| Illinois | IL |
| Texas | TX |
Now click on OK.
Predefining parameter values using a query
When setting up a list of pre-defined values for a parameter, you’ll see a Get values from a query option. You can use this option by defining a dataset on the data tab of the report designer. For example, if there was a State table in the database, you could define a dataset to retrieve the data for the parameter dropdown from that table. Once you choose the Get values from a query option, you select the dataset, the value field (this is the field from the dataset that contains the value passed to the report) and the label field (the field from the dataset that contains the value displayed to the user when they are prompted for parameters).
The next step is to set up the expression. Click on the table control in the report and highlight the whole detail row so that you can see the FontWeight property for the entire row. In the Properties window, select theFontWeight property and choose <expression> from the drop-down list to open the expression editor.
Typing “=iif (” should start up IntelliSense. You can also use the categories, items and values in the bottom half of the window to help build the expression. Click on Fields (Customers) to get a list of the fields in this dataset, and then double-click on State, to build the Fields!State.Value part of the expression. Add the equal sign and then click Parameters and HighlightState. Type in the rest of the expression, which will look as follows:
|
1 |
=iif(Fields!State.Value = Parameters!HighlightState.Value, "Bold", "Normal") |
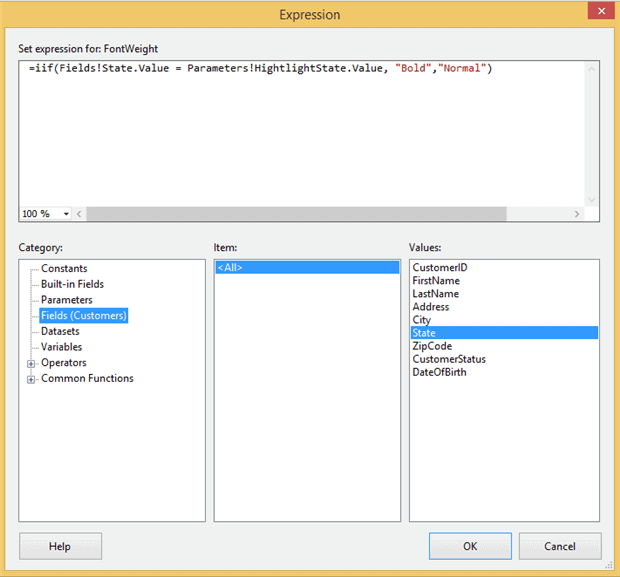
Figure 2
Now, if the state code equals the state code that was passed to the report as a parameter, the expression will return the value Bold. If it does not, it will return Normal. The value returned is then used to set the property for that instance of the row.
Switch to the Preview tab, select a state and run the report. All the rows with customers from the selected state should be displayed in bold.
Just in case you need to add alternate background colors to a report, the expression to use is
|
1 |
= IIf(RowNumber(Nothing) Mod 2 = 0, "Silver", "White") |
You can change the colors to any valid colors you wish to use.
Using common functions in expressions
The expression editor allows you to build expressions based on common functions, such as aggregate functions, date/time functions, string functions and more.
For example, within the Common Functions node, shown in Figure 2, click on the Date & Time category, double-click on the Weekday function to add it to the expression builder and then simply place the cursor in the expression box after the function. Type in the opening left parentheses and you should instantly see IntelliSense for the function selected, as shown in Figure 3.
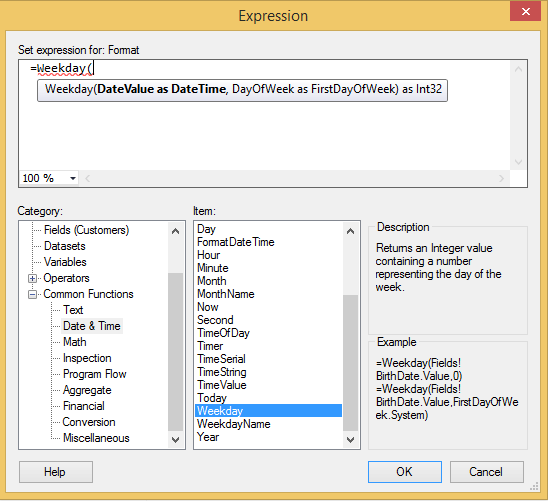
Figure 3
In this example, you will use the Year function so that the report returns only the year portion of the DateOfBirth field.
Right-click on the DateOfBirth detail cell and select Text Box Properties. On the General tab, find the Value field and click the fx button to bring up the expression editor. Change expression to read.
|
1 |
=Year(Fields!DateOfBirth.Value) |
After clicking OK to close the dialog box, preview the report to make sure that the function worked.
Another type of function that you’ll often use in expressions is an aggregate function. For example, say the report is an order form with a list of items and their prices. You could use the SUM aggregate function on the Price field to create a total price on the report. Or, if you had a report that listed all the purchase dates and the total amount of each purchase, you could use the AVG aggregate function to get the average purchase price for that customer. You will generally add aggregate functions to rows outside the detail row in specific grouping levels. You will learn how to add additional levels to the report in the Grouping section found later in this article.
Global variables
The Built-in fields collection includes a number of global variables that SSRS makes available to a report during processing. It includes both the Globals collection, providing details of the report itself, such as the page number, or the name of the report, and the User collection, providing details about the user who ran the report.
In this example you will use these global variables to create a page-numbering scheme for the report. First, add a footer to the report, where the page number will display (in the Design tab select the Add Report Footer option from the Report main menu.)
From the toolbox, drag a textbox into the footer, right click on it, open up the expression editor and build the following expression:
|
1 |
="Page " & Globals!PageNumber & " of " & Globals!TotalPages |
Switch to the Preview tab and run the report and you should see a footer on the page that reads something like “Page 1 of 1”.
Some other globals worth noting are:
ExecutionTime– this tells the date and time the report was runReportServerUrl– this allows you to verify that you are getting your report from the correct sourceUserID– this shows under which User ID the report was run
You could also add these variables to the report footer and use a parameter to hide or show them. That way, even in production, your users can see a tidy, clean report, but you can see the same report with all the extra information on it.
As a best practice, I have always added the execution time and page numbers to every report.
Custom functions
There are about 100 common functions in SSRS 2012, and they can handle most of what you will need to do. Occasionally, however, there is still a need to set an expression with more control than the common functions can manage and for that purpose, you can write custom VB.NET functions and use them in expressions.
In this section you will write a custom GetColor function that returns a different color, depending on the value that is passed to it (you can find the full list of available colors in the Color dropdown list in the properties window). Then, you will use that function to set the background color for the status field in the report detail table.
Navigate to the Design tab. From the Report menu select Report Properties and then jump to the Code tab. Copy the following code into the code window to set the color based on the value in the customer status field:
|
1 2 3 4 5 6 7 8 9 10 11 |
Public Function GetColor(ByVal status as String) as String IF status = "100" Then Return "White" End IF IF status = "101" Then Return "Yellow" End IF IF status = "102" Then Return "Tomato" End IF End Function |
Click OK and close the window.
Now that you have a function that returns color names, wire up that function to an expression. Add the CustomerStatus field to the report. Right-click on the CustomerStatus cell and open the Text Box Properties window.
On the Fill page, click the fx button next to the Fill Color dropdown, and add the following line of code to create an expression. Please note that custom functions must be called using =code.<myfunction>.
|
1 |
=code.GetColor(Fields!CustomerStatus.Value) |
When the report runs and this expression is resolved, SSRS will call the GetColor function and pass the value of the customer status for that instance of the row to the function. The function takes over and determines which color should be returned. SSRS then uses that value as the value for the background property for that cell.
Navigate to the Preview tab and run the report.
Subreports
A subreport is simply a report embedded into another report. In SSRS, a subreport is just another report (unlike some reporting tools, where a subreport is a special construct). Subreports can take parameters and execute their own datasets. In fact, in SSRS you can execute a subreport on its own.
In my experience, the need for subreports is somewhat rare. I have used them in the past to combine into the same report data from multiple sources. The other reason I have seen subreports used is to build dashboards. Instead of just adding the charts, gauges and tables directly to a report, you can create a subreport for each component. Then by adding the parts of the dashboard as subreports, you can control the placement of those parts. On an SSRS report with objects next to each other horizontally, one object will influence and change the placement of other objects when viewing the report. By using subreports, you can get around that problem.
You can add a subreport to a cell of a table or directly onto the report design area. To add a subreport to a report, simply drag a subreport control onto the report, or a table cell, and tell it which report to display. If the subreport requires parameters, you have to map the main report value to the subreport parameter. It’s actually very simple.
Add a new report to the project by right-clicking on the Reports folder and selecting Add | New Item. In the Add New Item dialog, select Report and call it MainReport.rdl. Add a new data source to the report, pointing to the ReportDB shared data source. Create a new dataset called Customers using the shared data source and the following query:
|
1 2 |
SELECT CustomerID, FirstName, LastName FROM Customer |
While in the Design tab, drag a table to the report design area. Drag the FirstName column from the Customer dataset in the Report Data window into the first column of the Data row of the table, and set up the second column to display the customer’s last name. Label the third column Address, but with nothing in the data row. Preview the report, and it should look as shown in Figure 4.
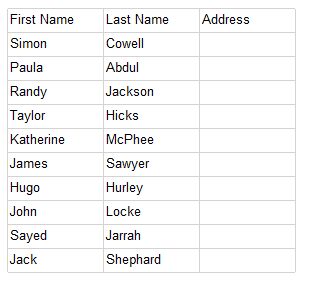
Figure 4
Pretend that the address information comes from a different system and you will create a separate report with this information so that it can be combined into the main report. Create the second report, and call this one AddressSubReport.rdl. This time, create a dataset called Addresses that uses the shared data source, and use the following query text:
|
1 2 3 4 5 6 |
SELECT Address , City , State , ZipCode FROM Customer WHERE ( CustomerID = @CustomerID ) |
In a previous section, you learned how to add an expression to control the value of a property. You can also create a new field in the dataset with an expression. In this example, you will combine the City, State and ZipCode fields into one CityLine field. Creating a calculated field is very helpful when an expression is needed in multiple cells of the table, or if one expression must build on another one. When you add a calculated field to a dataset, the calculated field will show up in the Expression Builder. In this case, it makes adding the expression to the report easier. You could also create the new field in the SQL query. This is a nice feature when modifying the query is not possible, for example when your dataset is a stored procedure and you are not allowed to change it.
Right-click on the Addresses dataset and choose Add Calculated Field. Name the field CityLine and click the fx button. Add this expression:
|
1 |
=Fields!City.Value & ", " & Fields!State.Value & " " & Fields!ZipCode.Value |
In the Design tab, add a Listbox control to the report, which allows you to add text boxes and other controls without being confined to a grid. Add two text boxes to the listbox. Drag the Address and CityLine fields into the text boxes. Drag the listbox to the upper left area of the report. Drag in the report edges so that they are lined up against the listbox. The report design should look as shown in Figure5.
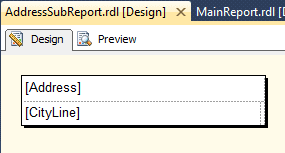
Figure 5
Now preview the report and use “100” for the CustomerID parameter.
It’s now time to embed the AddressSubReport into MainReport. The report will look like the data came from one source. Switch back to MainReport. Drag a SubReport control into the detail cell for the column labeled Address. Right-click on the SubReport control and select Subreport Properties. In the Subreport Properties dialog choose AddressSubReport from the subreport dropdown.
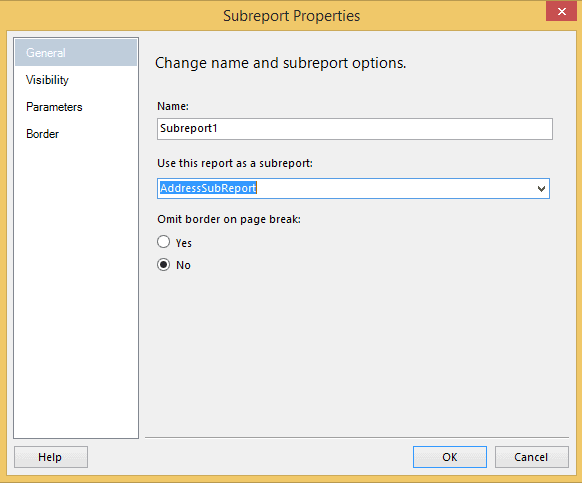
Figure 6
Next, switch to the Parameters tab. This is where you connect the subreport to the main report, by indicating which value from the main report is to be passed to the subreport to fulfill its parameter requirements.
Click Add to insert a parameter to map. In the Name column choose CustomerID, and in the Parameter Value column choose [CustomerID]. This will wire up the subreport to whichever customer is being displayed in the row of the main table.
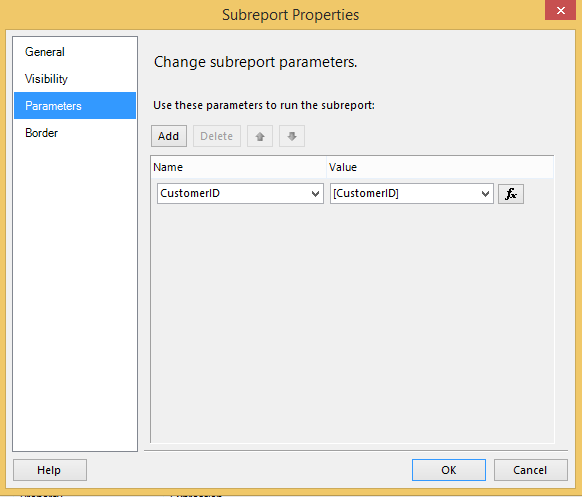
Figure 7
Switch to the Border tab. Change the border color to LightGray and click the Outline button. The properties will look like Figure 8.
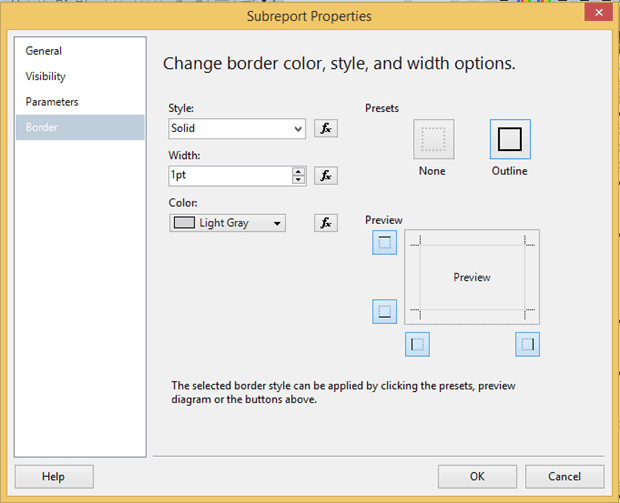
Figure 8
Click OK to close the dialog, and then preview the main report. You may need to expand the size of the Address field if it is too small.
Grouping
One of the most important features of many SSRS reports is grouping. Grouping allows you to create a hierarchy on the report as well as add totals and subtotals. The Design tab of the report has a section at the bottom, shown in Figure 9, displaying the row and column groups.
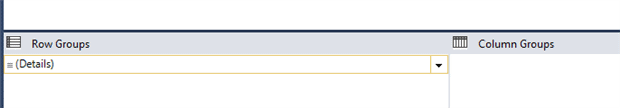
Figure 9
To demonstrate how to add a hierarchy to a report, add a new report called GroupingReport. Add a data source pointing to the shared data source, ReportDB. Add a dataset called CustomerSales with this query:
|
1 2 3 4 5 6 7 8 |
SELECT C.CustomerID , State , PurchaseID , PurchaseDate , YEAR(PurchaseDate) AS PurchaseYear , PurchaseAmount FROM [dbo].[Customer] AS C JOIN [dbo].[Purchase] AS P ON C.CustomerID = P.CustomerID |
When designing a report with grouping levels, it’s important to determine the levels up front. It’s a good idea to mock up the report on a white board or paper. In this case, you will group on PurchaseYear, State, and CustomerID.
Add a table to the report. Add the PurchaseID, PurchaseDate, and PurchaseAmount fields to the detail row of the report. Format the PurchaseDate and PurchaseAmount fields.
At this point, it is easy to add a grand total to the report. Right-click on PurchaseAmount and select Add Total. The expression SUM(PurchaseAmount) is automatically added to a new row in the report. Type in Grand Total in the cell to the left and bold the row.
Now that the details and grand total are in place, add the innermost level of grouping above the details, CustomerID. Drag the CustomerID field into the Row Groups section at the bottom of the report right above the details group. The CustomerIDcolumn is automatically added to the report. Run the report, and you’ll see that CustomerID is not only added to the report, it is a grouping level.
The next level is State. Add it to the Row Groups section above CustomerID. Finally, add PurchaseYear above State. The Row Groups section should look like Figure 10.
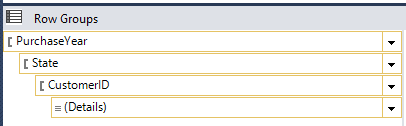
Figure 10
Now preview the report to see how the groups appear in the report. To modify group properties such as sorting and visibility, right-click on the group name in the Row Groups window. To add a subtotal in a level, right-click on a cell in that level and add a row inside the group. For example, right-click on the State cell and select Insert Row | Inside Group – Below. This will add a new row to that group. Drag the PurchaseAmountinto the cell under the detail row’s PurchaseAmount. Since this is outside the detail the SUM function is automatically applied. You may want to drag the State field to this row and format it so that it is obvious that the new value is a subtotal.
Preview the report to see how it looks.
The Matrix Control
Use the Matrix control to create pivot table style reports. Pivoting turns actual data values into column headers. In this section, you will set up a simple Matrix report to show you the count of customers with each status, in each state. When creating a matrix report, you end up with column groups in addition to row groups. Because the column groups expand across the page to the right, column groups should be a very limited set, such as months of the year, or a given set of years.
First, create a new report called MatrixReport.rdl. Add the shared data source, and then add a dataset with this query:
|
1 |
Select CustomerID, State, CustomerStatus from Customer |
The matrix control looks quite a bit different than the table control, as shown in Figure 11.
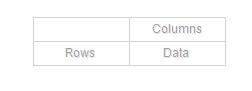
Figure 11
Change the value of the Data cell to CustomerID. The expression automatically changes to sum up the CustomerID values. Most of the time, the matrix is used to sum up a value. In this case, it doesn’t make sense to add them up, but it does make sense to count the customers. Using the expression builder, change the expression to =Count(Fields!CustomerID.Value).Change the value of the Columns cell, to CustomerStatus. In the Rows cell, change the value to State. The report design should look as shown in Figure 12.
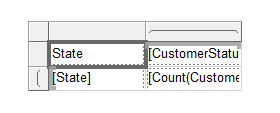
Figure 12
Preview the report and then format as desired. You should see the individual customer status values populated across the top of the report. In the Column Groups window, you will see CustomerStatus as a grouping level. After some formatting, my report looks as shown in Figure 13.
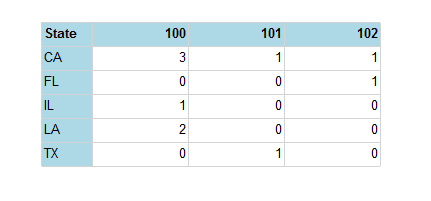
Figure 13
You can add additional column or row grouping levels and it is possible to change a regular table into a matrix by adding column grouping. I have seen much better results by starting with the type of report that I needed up front.
To convert a table into a matrix, follow these steps. Add a new report with the same dataset as the matrix report. Add a table control. Remove two of the columns leaving one column. Remove the Header row. You will have just one cell left. Drag CustomerStatusto Column Groups. Drag Stateto Row Groups. In the Row Groups section, delete the Details group. Change the Data cell to CustomerID. Modify the expression so that it counts the values instead of adding them up. The report should now show the identical data to the one created above.
Adding drill downs
The drill down functionality in SSRS allows you to create areas of a report that will expand and collapse, much like a tree view. If you followed along with the first article in this series, you saw this functionality demonstrated with the report created with the wizard, FirstReportWZ.rdl. That report has state sections that expand to show the details. This allows the user of the report to see the summary and only view the details or child groups when needed.
Create a new report called DrilldownReport.rdl. The query for the dataset is as follows:
|
1 |
SELECT LastName, FirstName, City, State FROM Customer |
Navigate to the Design tab and drag a new table control onto the page. Add the FirstName, LastName and City fields to the table details. Next, you need to add a group to the table. The earlier section on Grouping, explained how to add groups to the Row Groups window. Another technique is to add the groups directly to the table by right-clicking one grouping level and adding a new level. In this case right-click on the detail row and select Add Group | Row Group | Parent Group as shown in Figure 14.
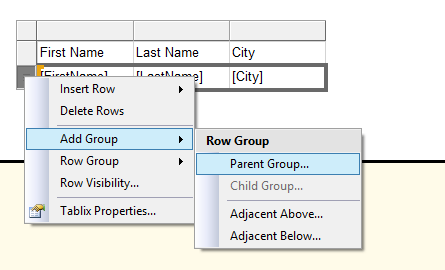
Figure 14
When the Tablix Group dialog appears (it’s called Tablix because it can be a table or a matrix), select State in the Group by dropdown and check Add Group Header. Click OK. Now the report is grouping on State. Add some formatting, and preview the report.
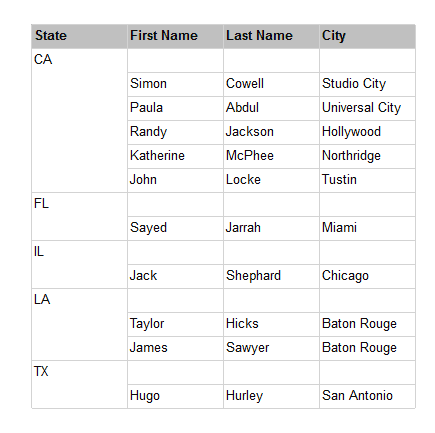
Figure 15
You now have grouping, but you still need to enable the drilldown. Go back to the Design tab. In the Row Groups window, right-click on the Details group and select Group Properties. On the Visibility page, click Hide, check Display can be toggled by this report item, and select State from the list. The dialog should look as shown in Figure 16.
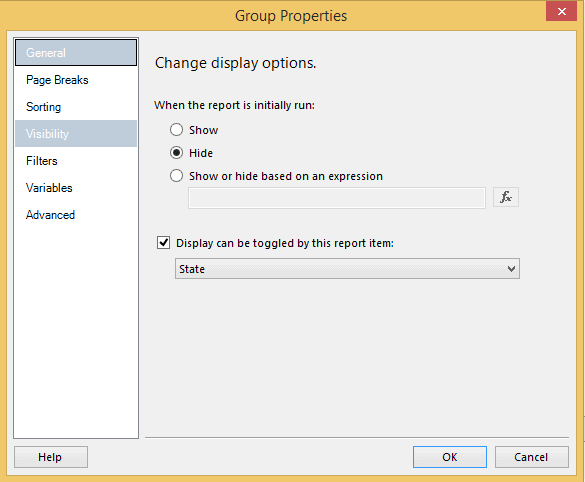
Figure 16
Click OK. Switch to the Preview tab and run the report. Now only the States appear, but you can see the customer in each state by using the tree-style +/- controls as shown in Figure 17.
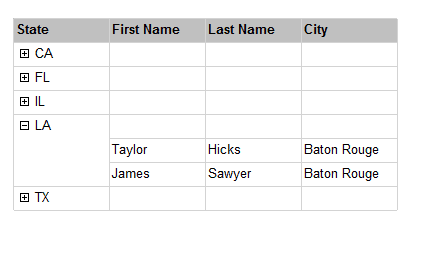
Figure 17
Adding dynamic sorting
It is very easy to add dynamic sorting to a table. Re-open the ExpressionReport.rdl report. Navigate to the Design tab of the report designer. Click in the cell labeled First Name in the header of the table. Right-click and select Text Box Properties. Switch to the Interactive Sorting tab. Check the checkbox for Enable interactive sorting on this textbox. Next, set the Sort by expression to the value that is displayed in the column – in this case [FirstName] and click OK. Now repeat this process for the rest of the report.
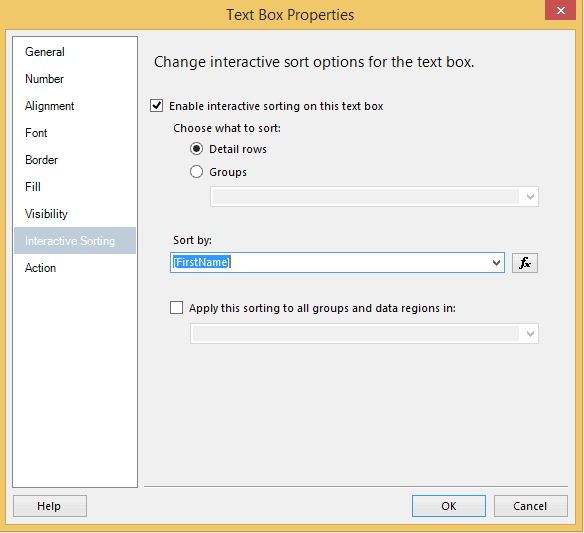
Figure 18
Preview the report, and you should have interactive sorting on each column. By holding down the shift key, you can sort on multiple columns.
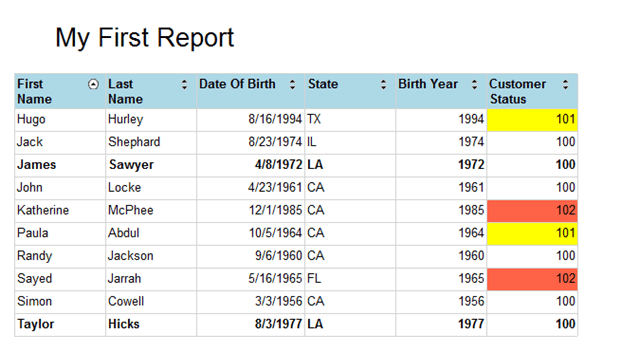
Figure 19
Wrap up
I hope this look into some of the more advanced features of SQL Server Reporting Services 2012 will help you make your reports more interactive and better adapted for your users. Part 3 of the series will take an in-depth look at the visual controls.


Load comments