
This is the last installment of a four-part series of articles on the basics of creating and publishing reports using SQL Server Reporting Services:
- Part 1, provided a step-by-step guide to basic report creation
- Part 2 took a tour of some of the core SSRS features and functions that you’ll need to develop dynamic reports
- Part 3 focused entirely on the visual controls
Part 4 focuses on the Report Definition Language (RDL), publishing reports, and Report Builder 3.0. First, you’ll examine the component parts of a typical RDL file and learn how to use your knowledge of RDL to refine and customize your reports, if necessary.
You’ll then learn about deploying reports to the built-in site for SSRS, Report Manager. There are other ways to publish reports, such as within SharePoint, but this article will focus on the most basic mechanism.
Finally, you’ll take a look at Report Builder 3.0 Tool, the ad-hoc reporting tool that ships with SQL Server Reporting Services 2008 R2 and later. This report-building tool allows end-users to build custom reports based on report parts and shared datasets. Confused? Fear not, all will become clear!
Getting Started
In order to follow the examples, you will need to have the SQL Server database engine, SQL Server Reporting Services, and SQL Server Data Tools – BI (SSDT-BI) correctly installed and configured. If you need some help with this, please refer back to the links in Part 1 of this series. Next, download the code file for this article (see the Code Download link above). The code file contains two sample Visual Studio projects and a SQL Script for creating the ReportDemo database. If you’ve not done so already, go ahead and create the database using the ReportingDemoDatabaseScript.sql. You will not be creating any new reports from scratch in this article but instead using reports that were created in the Projects from Parts 1 and 3, all of which are included in the code download file.
Report Definition Language
If you really wanted to, you could develop SSRS reports in a vanilla text editor like Notepad. I don’t recommend it, though. Microsoft provides great tools that make report development easy with a drag-and-drop interface. However, every once in a while, there is a reason to take a look at the actual code and maybe even tweak it a bit. To do that, it helps to understand what you are looking at when you do take a peek at the code.
The definition of RDL provided by MSDN is succinct and hard to better, so I’ll use it here:
“A report definition contains data retrieval and layout information for a report. Report Definition Language (RDL) is an XML representation of this report definition.”
Report Definition Language (RDL) is an XML-based schema for defining reports, and the reports that SSRS generates from the SSDT-BI report designer are basically just XML. Each report has a body and will have a header and footer if defined. The schema defines:
- Report layout- the body of the RDL file defines all of the objects that will be displayed in the report, including fields, images and tables
- Each dataset, the data source for each dataset and database connection information (where no data source is used)
- A set of fields in each dataset that can be populated with data
- Any parameters that are used in the report
You can read the full specification for RDL at: http://technet.microsoft.com/en-us/library/dd297486(v=SQL.100).aspx.
Inside a typical RDL file
You don’t have to be an XML guru to understand the RDL file, and the easiest way to get familiar with the basics of RDL is to dive right in and take a look at the component part of a typical RDL file, in this case the RDL for the ExpressionReport.rdl report that you developed back in Part 2, and which is included in the download project.
In SQL Server Data Tools – BI, open the ChartProject report solution, from the code download, navigate to the sample report, MyChart.rdl, in the solution explorer, right-click and select the View Code option. This opens the report in XML mode. The full XML for this file can be found in the code download bundle, but Figure 1 shows contents of the file with all nodes collapsed.
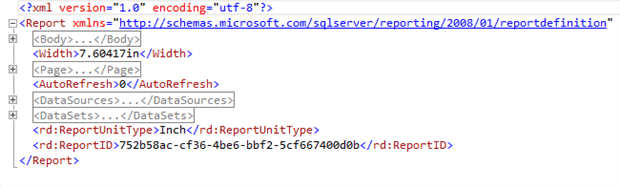
Figure 1
After the document element, the RDL files breaks down into the following major sections:
Document Element– defines the name of the report and the schema to which our RDL must conformBody– defines all of the report itemsPage– page headers and footers, if usedDataSources– defines all dedicated and shared data sourcesDataSets– defines each data set used in the reportReportParameters– all parameters defined for the reportCode– any custom code, such as custom functions
At the very top of the code is the Document element, as shown in Figure 2.

Figure 2
The document element is called Report – no surprise there. It references two XML namespaces:
- http://schemas.microsoft.com/sqlserver/reporting/2008/01/reportdefinition
- http://schemas.microsoft.com/SQLServer/reporting/reportdesigner
These namespaces explicitly define what is allowed inside the RDL document from an XML standpoint. To see this in action, I added an invalid tag to the report and received the error message shown in Figure 3.
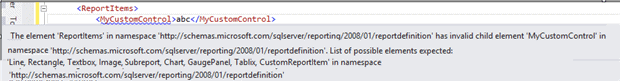
Figure 3
Since the change I made did not conform to the published schema, the change was immediately flagged as an error because the report definition is now invalid.
NOTE: It is possible to create custom report items with a .NET language. See this MSDN article for more details.
You can expand the XML to review the code of any of the sections of the report. You’ll see all the properties that you are familiar with as well as some that may be new to you. Figure 4 shows a nice example from the DataSets section of the MyChart RDL file, displaying the actual query for the dataset.
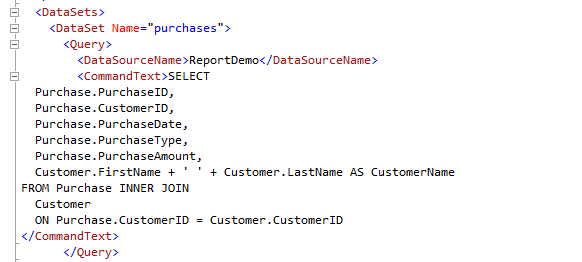
Figure 4
Writing your own RDL
Now you have a good idea of the RDL that is written behind the scenes when the SQL Report Designer is doing its thing. This understanding of the report designer gives you the ability to manually tweak a report when necessary. I’ve only had to do this once or twice in over 10 years. One example I remember quite well involved a sub-report that, on the Report Manager site, was located in a different folder than the main report. The only way I could embed the sub-report was to manually change the link inside the XML. However, knowing RDL empowers you in other ways too. You are not restricted to using the Visual Studio Report designer, because SSRS Reports are not in some proprietary format. If you wish, you can roll your own report builder tool or RDL generator.
Configuring Reports for Deployment
Developing reports on your own computer can be quite fun and sometimes challenging, but the reports are not useful until they are published to a location that is accessible to the people who need to see the reports. There are many ways to publish reports, including to SharePoint or within custom applications. However, the easiest way to publish and manage reports is with the built-in Report Manager. This is also called Native Mode deployment. Report Manager is a small web site that can run on a separate web server or on the SQL Server that is hosting the SSRS databases. Starting with 2008, SSRS is not dependent on Internet Information Services (IIS) which makes DBAs more comfortable deploying it on the same server as the database engine.
Viewing the Reporting Services Configuration
The first article in the series walked through installing and configuring Report Manager and so if you have followed along you probably have Report Manager running on your computer right now. It’s a great tool for learning how to publish reports to your own computer, before presenting them to the real world.
To make sure Report Manager is configured and running, launch SQL Server Reporting Services Configuration Manager and connect to the Reporting Server instance, which in my case is a SQL Server running as a default instance, so MSSQLSERVER is the correct instance name.
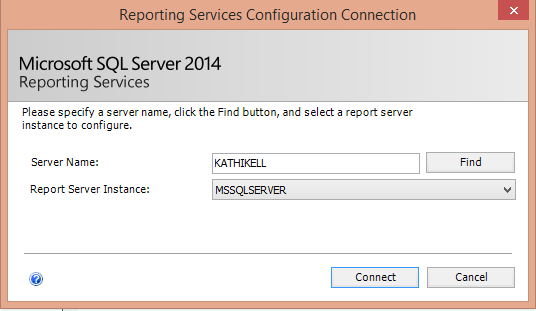
Figure 5
After clicking Connect, you can review the various properties and settings of the Report Server. Click Web Service URL to find the URL of the report server to which you will deploy your reports.
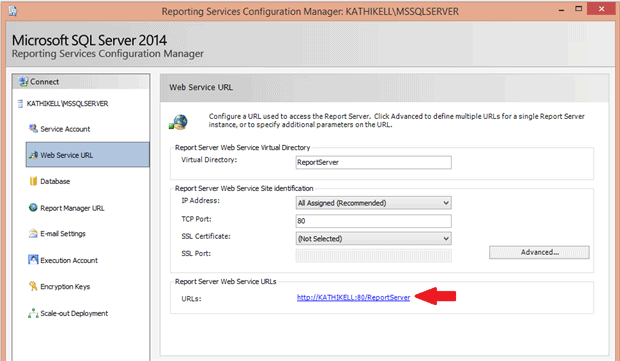
Figure 6
Click Report Manager URL to see the URL for viewing and managing reports, as shown in Figure 7.
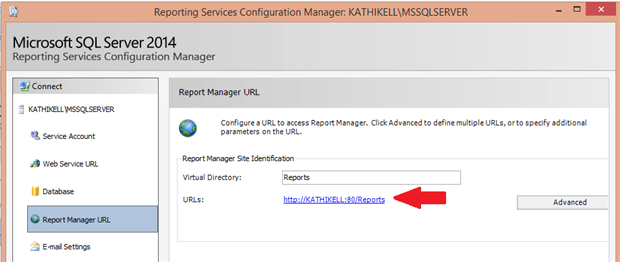
Figure 7
If SSRS and Report Manager are not configured, go back to the first article in the series to configure them before continuing to the next section.
Configuring a Report Project for Publication
The process of publishing, or deploying, an SSRS project copies the reports, data sources, and datasets to Report Manager. Once the reports are published, they can be viewed by anyone with the correct permissions. In this section, you’ll configure deployment of your reports to Report Manager, running on your local computer. The steps for deploying to a site in your enterprise network are the same; you’ll just have to modify the location.
In SQL Server Data Tools – BI, open ChartProject from the download. To deploy the ChartProject reports, you must configure the location of Report Manager in the project properties. Within the Solution Explorer, right-click on ChartProject, the project name, and select Properties. In the TargetServerURL property, fill in the Web Service URL you found earlier (see Figure 6). When deploying to a network location in your company, you may need to get the URL value from your DBA. Figure 8 shows the properties I am using. I have replaced my computer name with “localhost”.
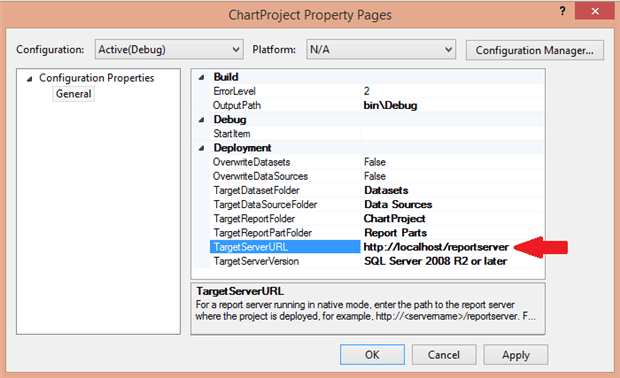
Figure 8
In Figure8, you’ll see that there are several other target folders. For example, the TargetDatasourceFolder property shows where all of the shared data sources will end up in Report Manager. By default, the TargetReportFolder has the same name as the project but you can change this value if required.
Take a look at the OverwriteDatasets property, which is set to False. In many cases, you will create reports against a development or QA server instead of production. When this value is False, it will not let you overwrite an existing datasource with the same name. This will prevent your development settings from changing the production settings.
Click OK to accept the change to the URL.
Local Security Issues
When working on Windows 7 or 8, you may try to perform tasks that need Administrator permissions. Even if your account is an administrator account, those operations are blocked by default. This is not a bug, but a security feature to prevent malicious code from operating on your system.
This security feature will prevent you from publishing and viewing reports on Report Manager locally. One way to get around this is to launch SSDT-BI by holding down the shift key and right-clicking on the link, and then select Run as administrator. You will then be able to publish reports locally. When launching your favorite web browser to view Report Manager, you will need to do the same thing.
There is a way to set permissions for your account in SSRS to avoid this issue. Follow the directions in this MSDN article to learn more.
Deploying Reports
Now that the TargetServerURL is configured in your project, and you have addressed the local security issue, you are ready to publish some reports! Right-click the project name inside the Solution Explorer and select Deploy. The Output window should pop up to show you the status. Once my reports were deployed, I saw the messages in Figure 9.
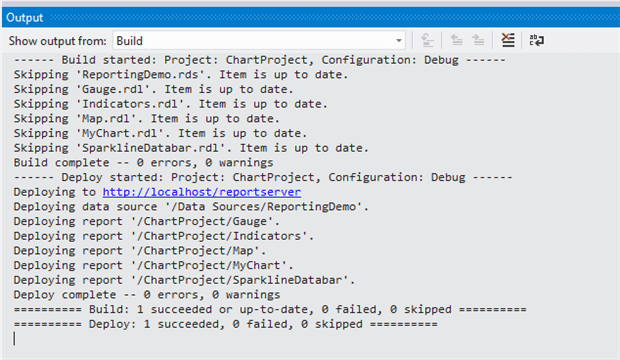
Figure 9
If your reports did not deploy, you will have to review the error messages and troubleshoot. Most of the time, the problems stem from an incorrect or missing TargetServerURL or from permissions issues.
Viewing the Published Reports
Now that you have published the reports, you will want to view them on the Report Manager site. Launch your favorite web browser and navigate to the Report Manager URL (see Figure 7). If you receive an error message about permissions, review the previous “Local Security Issues” section.
If everything worked as expected, Report Manger should display the contents of the Home folder (the top-level folder in the Report Server folder hierarchy). In this case, you should see within it two sub-folders, as shown in Figure 10.
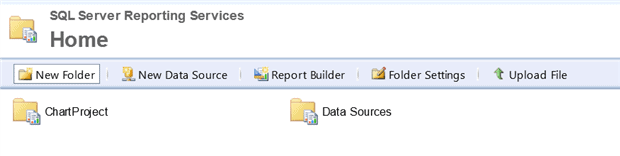
Figure 10
Click the ChartProject folder. You will see all of the reports from the project. Click one of the reports to run it. At this point, if you have errors connecting to the report, you can navigate to the data source set up in the Data Sources folder to troubleshoot the connection.
If the ReportDemo database and the Report Manager site are all located on the same server, such as your laptop, your credentials should work to run the report. If they are located on separate servers, your network account credentials from the Report Manager will not pass through to the database. This is called the “double-hop” problem. There are two ways around this issue. The easiest, but least secure way, is to use SQL Server security instead of AD security in the report. The other method is to configure Kerberos Authentication. Talk to your network administrators. When learning how to develop reports, I recommend running everything on one computer.
Figure 11 shows the Indicators report and the breadcrumb trail at the top for navigating back to any of the folders.
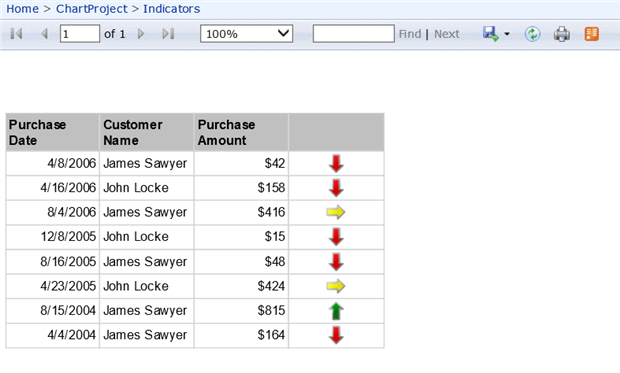
Figure 11
None of these reports have parameters, but if they did, the parameter controls would be found right above the report.
You have deployed the entire project, but you can deploy just one report if you wish. To do so, just right-click the report and select Deploy. You can also redeploy the project or a report, after making changes. If you redeploy, the reports will be overwritten without a prompt.
Securing Reports
You have seen how easy it is to publish reports to Report Manager directly from SSDT-BI. However, it is very important that only the correct eyes see the reports. On your own computer, you will not need to worry about security, but you may need to configure it on your enterprise wide SSRS deployment. In many companies, the person developing reports is not the same person securing them. However, it is useful to understand how the security works, even if it is not your job, just in case you are called in to help troubleshoot an issue.
You can set up permissions at the folder or report level. I strongly recommend that permissions are set up only at the folder level. You allow users to view reports in a given folder by assigning the appropriate roles, either to individual users or to an Active Directory group of which the user is a member. I recommend giving permissions at the AD level, not to individuals.
By default, folders and reports inherit permissions from folders higher in the hierarchy. For example, if the Everyone network group has permission to run reports at the Home folder level, then Everyone also has permission to view reports in all sub-folders, unless you enforce security by overriding the default permissions on each sub-folder, so that only the appropriate users can view the reports in each one.
There are many ways to do this but, for example, within the Home folder you might create folders for specific departments, and then assign permissions to the AD group for the departments. Inside the department folders you could have a Managers folder with reports only for managers. Figure 12 shows how this might look for the IT department.
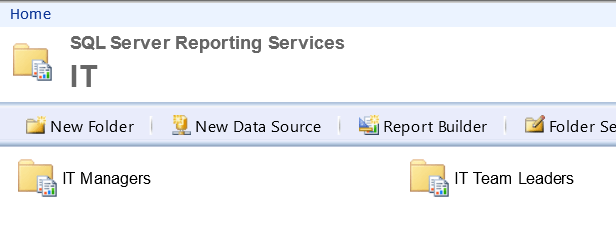
Figure 12
Once the folders are in place, hover older a folder name to bring up a dropdown list of tasks and select Security (or open the appropriate folder, select Folder Settings from the top menu, and then open the Security page). Figure 13 shows the Security page, though note that you will only see groups such as the Everyone group if you are running in a network with Active Directory.
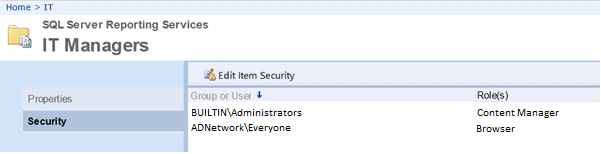
Figure 13
Click Edit Item Security and you will be prompted with a message telling you that you will break the inheritance from the parent folder. Click OK. Click New Role Assignment. This opens a page where you can assign roles to a named user or AD group, as shown in Figure 14.
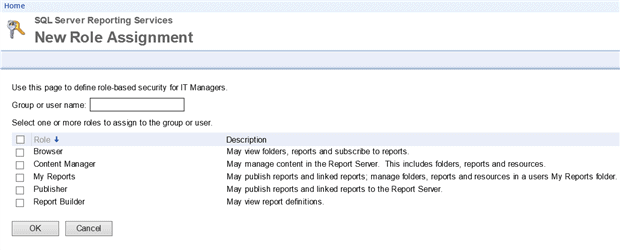
Figure 14
To allow a user or group to view reports only, assign the Browser role. Remember that when assigning permission to a folder, all the reports in the folder will inherit those permissions. Always assign permissions to folders, not reports, to keep security manageable.
There are also two roles at the instance level: System Administrator and System User. To manage these permissions, click the Site Settings link at the top right of the page. The System User site role and the folder Report Builder role are needed by users who need to run Report Builder.
Managing Reports
There are so many factors that you can control in SSRS, that it is impossible to cover all of them in this article. Hover over a report name so that the drop-down list of tasks appears. Select Manage. Eight topic areas appear that you can manage, as shown in Figure 15.
Figure 15
You can set up subscriptions for automatically delivered reports, cache reports that run frequently with data that doesn’t often change, and much more.
Using Report Builder 3.0
Most of the time, a developer creates a report based on a set of requirements and then publishes the report where the person requesting it can run it. However, you may also have heard the term “self-service BI”, which means to give the end users the ability to create their own reports and dashboards. Report Builder 3.0 is a self-service BI tool.
Report Builder 3.0 enables the user to select from pre-defined datasets and report parts or to design reports from scratch. The user can use the simple drag-and-drop interface to build custom reports, wizards, or design a report with the same techniques that you use.
Starting in 2005, Report Builder has been a component of SSRS. The original versions of Report Builder required Data Models, basically a view of the data that could be used. All previous versions of Report Builder, along with Data Models, have been deprecated. Unlike the previous versions, Report Builder 3.0 looks and works almost exactly like the developer tool, SSDT-BI.
Report Builder is a great way to let end-users who know little or no T-SQL build their own reports. You can provide predefined parameter lists, data sources, datasets, and even tables and visual elements that they can use to build custom reports.
Here are the differences between Report Builder 3.0 and SSDT-BI:
- SSDT-BI allows you to work with projects of multiple reports while you can work with only one report at a time with Report Builder 3.0.
- SSDT-BI has an interface that is familiar to developers while Report Builder 3.0 looks more like Office.
- You can publish Report Parts with SSDT-BI. You can utilize Report Parts with Report Builder 3.0.
- SSDT-BI can integrate with source control programs while Report Builder 3.0 cannot.
- Report Builder 3.0 has more wizards than SSDT-BI.
Publishing Report Parts
In this exercise, you are going publish some report parts that will allow the end-users to create and customize their own reports. If you have followed along in this article, the ChartProject project should be configured for deployment. You will also need to configure the FirstProject. Go back to the “Viewing the Reporting Services Configuration” and “Configuring the Project for Publishing” sections to learn how to set up the properties.
Reports are composed of objects such as tables, and charts. Not only can you publish entire reports, you can also publish the individual objects so that they can be reused within Report Builder 3.0. You have seen that data sources are automatically deployed when you deploy a project. If the project has datasets, they are also deployed automatically when deploying the project.
You must mark each part of the report that you want to publish. Open up FirstProject from the downloaded code. Double-click the ParameterReport report to open it in the Design tab. From the menu, select Report | Publish Report Parts. This dialog allows you to choose which components of the report to publish as individual items and to rename them. Select StateCD and Tablix1. Click the word Tablix1 and change the name to Customers, as shown in Figure 16
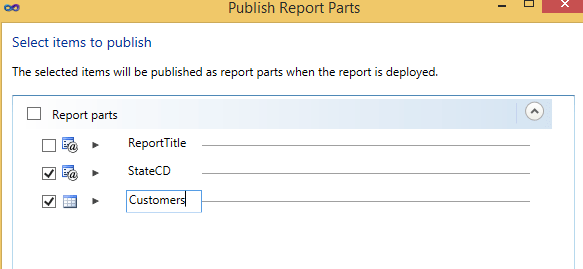
Figure 16
Click OK to dismiss the dialog box. Right-click the project name and choose Deploy. If the deployment is successful, open Report Manager where you should see a new folder called Report Parts and one called FirstProject, as shown in Figure 17.
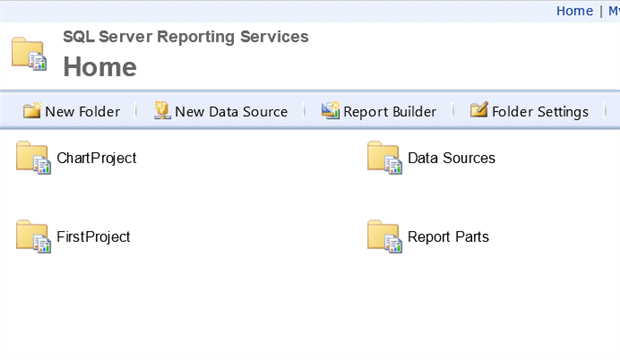
Figure 17
The FirstProject folder should contain all the reports from the project. The Report Parts folder should contain those two parts you marked for publishing, as shown in Figure 18.
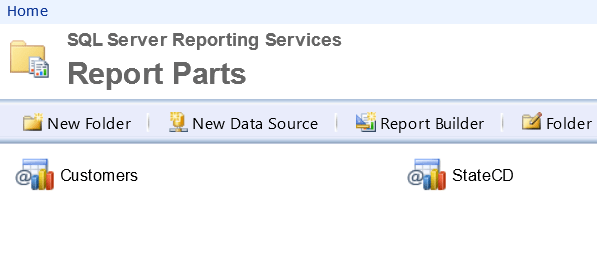
Figure 18
Now open up the ChartProject. Double-click the MyChart report to open it in design view. Open the Publish Report Parts dialog found in the Report menu. Select Chart1, but change the name to SalesChart. Figure 19 shows how the dialog should look. Click OK.
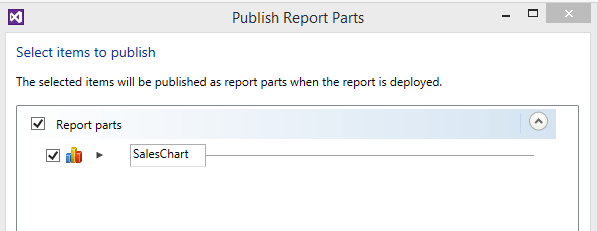
Figure 19
Repeat the process with the Gauge report. Publish the gauge and name it SalesGauge. Also repeat the process with the Map report. Publish the map and name it SalesMap. Deploy the project.
Create a Custom Report with Report Builder
Report Builder 3.0 installs on first launch after clicking the Report Builder link in Report Manager. After Report Builder 3.0 launches, you have many choices, including three wizards or a blank report. You can also create a new dataset or open an existing report to edit. Figure 20 shows the Getting Started dialog.
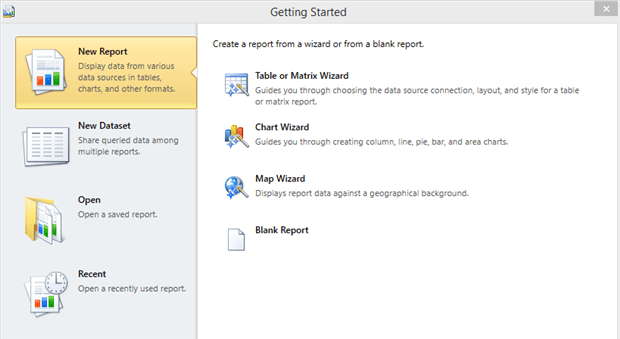
Figure 20
For now, select Blank Report. The Report Builder interface is similar to the one found in SSDT-BI, but ribbons have replaced menus and some windows. You still have the Report Data window, but the toolbox items are found on the Insert tab. There is no need for a Solution Explorer because you can work on only one report at a time. Figure 21 shows how the blank report and the layout look.
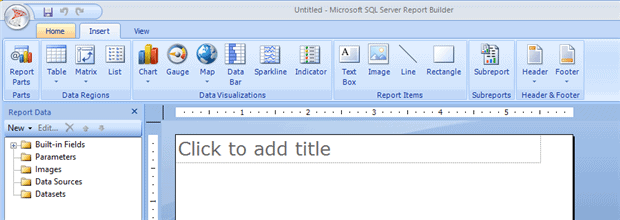
Figure 21
On the left side of the Insert ribbon, click Report Parts. This opens a Report Part Gallery on the right. Click the search button, a magnifying glass, to show all of the available published parts. You can also use the search box to filter the list.
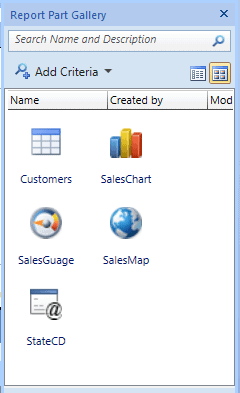
Figure 22
The person creating the report can drag whichever items they need to see on the report, for example, to build a dashboard. If they have the skills, they can also create data sources and datasets.
To build the first report, drag in the SalesChart and SalesGauge. When you do, the data source and datasets are automatically added to the report.
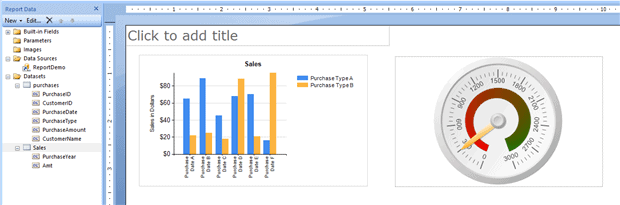
Figure 23
On the Home ribbon, click Run to view the report. To publish the report, click the Save button. The Save as Report dialog box allows you to publish the report or save the report file locally.
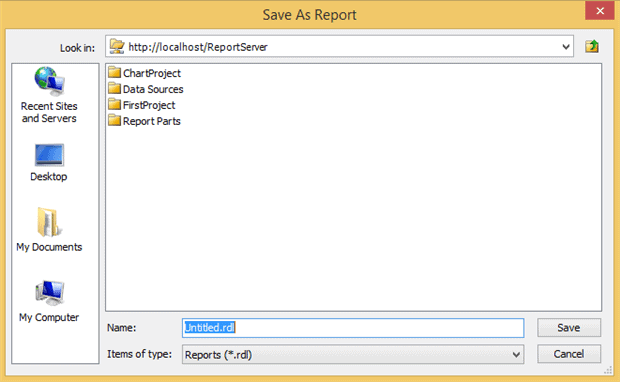
Figure 24
Publish the report by naming it RB1 and clicking Save. Now go back to Report Manager to confirm that the report you created shows up, as shown in Figure 25. You may need to refresh the page to see the report.
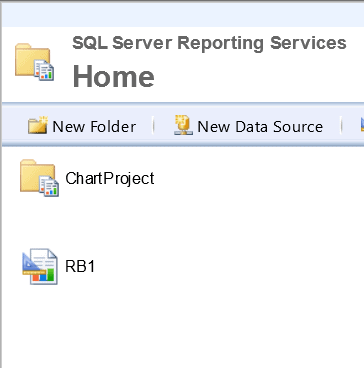
Figure 25
Close Report Builder and launch it again. Select Blank Report. This time add the Customers table to the report. Look at the Parameters section of the Report Data window. The parameter was automatically added for you. Run the report to see how it looks and then publish it.
To really get the most benefit from Report Builder 3.0, you will have to do some planning and work. Are there several parameter lists that would be beneficial for multiple reports? Are there several visual items that can be filtered by the same parameters so that they can create an interactive dashboard? By working with the business users and understanding the data, you can create a valuable resource for your company.
Conclusion
I hope this tutorial series has given you some insight into the capabilities of SQL Server Reporting Services. There are many more features for you to discover. Just to name a few, I suggest you look into click-through reports, report caching and report subscriptions.
Happy reporting…!
This document contains proprietary information and is protected by copyright law.
Copyright © 2026 Red Gate Software Limited. All rights reserved


Load comments