
Identifying Performance Targets
Naturally, in order to achieve a goal, you first need to understand what that goal is. So, before you can determine whether your application performs well, you need to understand that means in terms of the metrics your application needs to produce.
Whether or not your application performs well is a relative target; not all applications are the same. So it stands to reason that the measure by which an application’s performance is tracked changes based on its requirements. This is where the business side of things comes in.
It is easy to say that a given business has a customer base of 5,000 concurrent users, but what does that really mean? It means you need to ask yourself questions like: If your application is being used by the entire customer base, what is the typical usage pattern? What percentage of users are performing searches, what percentage of the users are buying goods, and what percentage of users are simply browsing around?
Having an accurate determination of user behavior is absolutely critical to determining whether your application can meet the performance needs of your customer base, and this is what the business needs to decide. This task is made a lot easier if there is existing behavior that can be used as an example. If there is no existing data on ‘typical’ user behavior, then an educated guess obviously needs to be made. Also, given that technical staff usually have a biased view of the application usage, it is probably best if the business can provide some metrics around what users are doing on the site (by that I mean what percentages of users are performing what actions on the site).
Structuring Test Breakdowns
An application can have many functional paths, and the amount that a functional path is exercised is based upon typical business scenarios and user behaviors. These assessments are made far more accurate if based on statistical evidence, such as evidence based on past activity, or perhaps analytical statistics gathered from companies specifically engaged to measure usage patterns of the site. This kind of data will provide a perfect template from which to draw test breakdowns. If no such analytical evidence is available, then the business must provide as accurate an estimation as possible around usage patterns and functional paths to the site.
Quite often, a sitemap will be produced as part of the functional or technical specification of a web application, and this can be used as the basis from which to ascribe weighted percentages to customer use (although they can often contain too much detail). An example usage diagram might look something like the following:
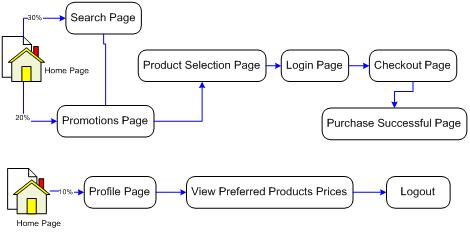
Figure 1: Example Usage Patterns
While this example is somewhat simplistic, it is indicative of the type of diagram (or ‘breakdown’) required when structuring your performance tests. It is important to ensure that you exercise any aspects of the application which are deemed ‘heavy’ in terms of performance (i.e. performing a lot of work) to gain metrics on just how much of an impact they are having. However, it is also important to note that performance tests are not like unit or integration tests, as it is not vitally important to cover every functional path and achieve high code coverage when running performance tests.
For example, consider the fact that different functional paths and usage scenarios quite often exercise similar code paths. Similarly, from a performance perspective, the same or very similar performance can also be achieved from different usage patterns. Obviously, it is necessary to model the different usage patterns that the business has identified, but trying to exercise every single aspect in fine detail will often end up causing a lot more work than is necessary, and achieve comparatively little extra value from a performance-measurement perspective. Generally speaking, performance testing is a more broad approach than unit, integration and functional testing.
Determining what load to target
By this point we have a good understanding of what tests we need to run, and how these tests are going to be distributed across a performance run to accurately simulate the target application’s performance requirements.
What we still need to determine is how many concurrent users the application needs to be able to handle at various times. This is not a simple static number though, as a typical application needs to be able to deal with concurrent user load in a number of ways. Specifically, it needs to be able to:
- Remain responsive during a normal day’s use, with a ‘typical’ amount of customer or client concurrent usage.
- Remain responsive during the high peak times, where there might be almost the entire user base using the application concurrently.
- Be resilient enough to sustain extreme loads without complete failure, and return to normal operation when stress or load levels return to normal.
There are a few points here which are open to interpretation. For example, when the application needs to “remain responsive”, exactly what does this mean? Unfortunately, this is something that can only be answered by the business in consultation with technical staff. Quite often, if you asked the business how responsive each page in the application should be, they respond with “sub second” as a default answer for all pages. While this might be achievable, often there may be some aspects of the web application that require serious computation, and thus are very hard to deliver in sub second timeframes.
It is also important to allow for some variance in these response figures at different load levels. The response times during normal daily use may differ quite significantly when compared to when the server is under extreme loads. In an ideal world it would be preferable to have a consistent response time across all load levels, but this can be costly and sometimes extremely difficult to achieve. If it is achievable (as with the ideal sub-second response time), it might require significant additional computational power, and this cost will need to be quantified and justified to the business. Indeed, the business needs to be involved more or less throughout this entire stage of the profiling process, as you will need to be able to make several informed judgements before you can proceed with the actual testing.
Note: It is important to specify a frame of reference regarding what are acceptable response times for your pages. This is also why it is important to involve the business’ technical staff in your consultations, so that the mechanics behind each page and function can be given due consideration when determining how they should perform.
So, what are the metrics we actually need to identify in terms of concurrent users? There are no hard and fast rules here, as this is often dictated by the application and what is important to the business. Generally speaking, you will almost certainly be looking at:
- Number of typical concurrent users that represent average usage.
This might be expressed by number of page views per hour, or number of total users visiting the site per day. As long as a metric-over-time is provided by the business, the average typical concurrent user rate can be calculated from this. - Number of concurrent users during peak times.
This figure represents the peak usage times of the application, and is an estimation of what the absolute peak number of concurrent users are. It is obviously important that the application can handle these peaks as well as handle the normal day’s usage. - Project growth of the user base over time This is important for the application to accommodate future growth and not need sudden provisioning of extra resources soon after implementation.
In addition to specifying the accepted response times during these various concurrent use cases, it is also worth considering differences in these times across the different pages on the site. In most applications, there is a small subset of pages which are exceptional high-traffic (such as login pages, home-pages, etc.), and often these pages should be considered individually for testing purposes. In any case, different pages will often have a different computational cost, and so it may be acceptable to have longer response times on some pages.
This may not be the case however so where certain pages involve more resources or computational cost, special consideration must be given to achieving the desired response times. At the very least, the cost of achieving the response time target should be known so the business can properly make a value decision.
There does not need to be a formal document listing these considerations, but some common location for reference and comparison purposes is a good idea. This might be a wiki page, a Word / Excel document, or some other listing of the agreed and expected targets and response times. A simple example of this might be something like:
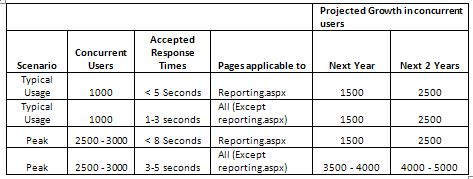
Table 1: Example Response time expectations
This table shows a a very simplistic example of what may be produced by discussions between the business and technical staff around expected response times and concurrent user load. The goal of this is to produce explicit guidelines around what is acceptable by the business at various points of the applications usage, within the context of the current user base. Without explicit guidelines in these areas, all the relevant test conclusions are subjective and open to interpretation. Bearing that in mind, it is once again up to the business, in conjunction with consultation from appropriate technical staff, to come up with realistic and achievable goals that meet business needs.
Now that we have clear expectations around application performance, you would think we have set our targets to achieve when doing performance testing, right? Not quite.
Contingency in your Estimations
As part of a general rule, when the table of estimations has been produced around concurrency expectations and response times, it is important to emphasize that these are just estimations. They have plenty of potential to be incorrect. In fact they probably are incorrect, but because we have used whatever metric data we can, as well as knowledge of usage patterns and systems, they should be reasonably close to reality. As a result of all this, even using these estimations as our limits for performance testing is not going to be accurate, either. I generally recommend that you double the concurrent load targets for any given scenario.
Why should you double your estimates, you ask? This can be thought of as our contingency component. In many estimation processes, such as when you judge the time and effort taken to complete a project, some level of contingency is usually introduced to cater for errors or unknowns in the estimation process itself. If we double our performance targets, it is reasonable to assume that, if we can then hit them, then even if our initial estimations were incorrect by a small margin, those errors are accounted for. We can then be confident that not only does the application meet the required business goals, but can also handle more load than anticipated and performs well within our set bounds.
The performance targets in Table 1 may seem excessive once doubled, but remember that part of the purpose of performance testing is to give the business a relatively accurate determination of hardware and infrastructure requirements for current and future use of their application. Using doubled performance targets clearly ensures that we cover current requirements, future requirements, and also any contingency that either the business or technical estimations have failed to address. It provides a safeguard in the sometimes tenuous game of estimation.
As a bonus, this will obviously also guarantee responsiveness under normal circumstances; If the system maintains acceptable responsiveness under double the expected load, then it will be even more responsive under the originally estimated load.
The previously shown table & it’s double are by no means the only way to express estimated loads, current needs, projected growth and performance targets. These examples are provided simply as examples, and you can use them verbatim or find different ways to express your targets that suite your individual needs. The main point here is that it is essential to ascertain these targets before any testing is performed. If you don’t, then there will only be a vague understanding of what needs to be achieved in the performance testing process. Like I said, performance testing is an expensive process, and the need to gain valuable results, as opposed to ambiguous results which do not allow proper conclusions, is of paramount importance.
One final thing to consider is the percentage of new users accessing the site, compared to returning users. This will have implications in terms of browser caching efficiency, and will affect how many requests are issued against the server. The more returning users that visit the site, the more data will be cached by the clients’ browsers, and so fewer requests are likely to be issued against the server for resources within a particular page.
This will also be dependent on the type of application; this metric is quite important for public-facing web applications, however intranet based applications may place less of a significance on it. Often, to present a worst case scenario, the amount of new users will be assumed to be 100%. This means that each test will consistently request all resources for a page and not consider caching any resources, which is what all common web browsers do today.
Estimate the mix of browsers for your web applicationmment
Finally, in a web application, it is also important to be able to estimate the percentage of different browsers that will be used to access the web site. Different browsers from different vendors naturally all have different performance characteristics, and therefore impose different performance factors on the site.
If the web site is public-facing, generally the percentage of different browsers can be gleaned by the respective market share of each browser. Quite often, the business will dictate which browsers should be used, and even which version will be supported.
If the web site is intranet-based or has its visibility limited to within certain units of the organization, then often the organization in question will have set standards about what browsers are permitted as part of the organization’s standard operating environment.
The final outcome of all these estimations is that you will be able to record tests that exercise accurate, or at least realistic usage patterns of the site. Once these are recorded, you can then weight the results by applying percentages according how often each test is executed as part of the entire load test, which will be essential in establishing which result-sets are the most relevant for your purposes. In addition, you can also specify how much each browser is simulated within the overall load test. Within Visual Studio Team Test, you can end up with a load test, specifying a test and browser mix, looking something like the following diagram:
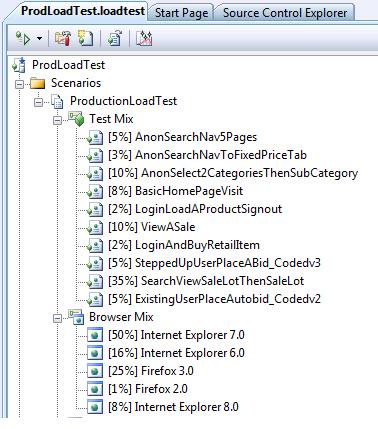
Figure 2: Sample test and browser distribution
We will discuss how to setup the test percentage and browser mix in detail in a later chapter.
What data do we measure?
We have now identified our performance targets across a number of scenarios, and we have also identified the response times required across them by the business. Now we need to establish what metrics we use to compare against our targets.
There are a huge variety of metrics that are measured and analyzed as part of performance and load testing. For comparative purposes against the targets that were identified earlier, we are primarily concerned with a few key metrics which will give us an immediate idea of the application’s performance. These are:
- Time to First Byte
- Total Page Response Time
Time to First Byte
Time to First Byte (TTFB) represents the time it takes a server to issue the first byte of information, typically in response to a request from a web browser. This time covers the socket connection time, the time taken to send the HTTP request and the time to taken to get the first byte of the page. It is a good indicator of the responsiveness of the web application, as the server must receive the request, interpret it, execute the ASP.NET pipeline to process the request, and produce a response.
This is one of the primary metrics to use when determining how responsive a site or web application is. A large TTFB value means that a typical user will see no activity in their browser (apart from whatever ‘waiting’ indicator the browser uses) for a long time, until that first byte of information is received from the server and the browser can start parsing.
This is also typically a good indicator of how fast the web application can process the requests made against it, as no response will be issued until the web server/ASP.NET has finished processing a given request.
Total Page Response Time
The total page response time is often referred to as simply ‘response time’. This metric includes the ‘Time to First Byte’ time described previously, but also includes all the dependent requests required to completely load and display all aspects of a web page. This can include items such as images, javascript files, and Cascading Style Sheet (CSS) files.
In contrast to the ‘Time to First Byte’ measurement, the total page response time measures the time it takes for a page to completely finish loading all resources required to present the page to the user. This may include non-functional aspects as well, such as tracking images hosted on external sites. It is important to quantify the effect that external tracking mechanisms can impose upon the site. Once this is done, it is valuable to remove this component during performance testing to get a more accurate view of the sites performance. External tracking mechanisms are normally beyond the control of the application and therefore cannot be modified or improved.
To further illustrate these points, the following diagrams show some Time to First Byte and Total Page Response time breakdowns. The first diagram represents a personal, hobby site theglavs.com and the second site represents the Microsoft main site http://www.microsoft.com:
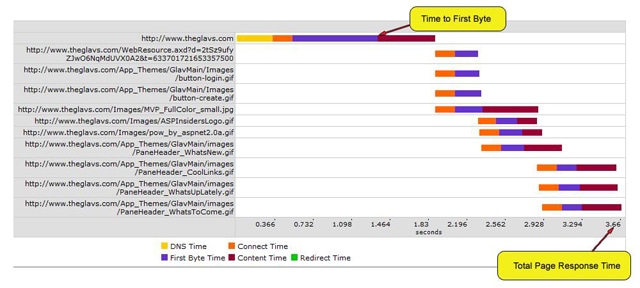
Figure 3: http://www.theglavs.com Response Times
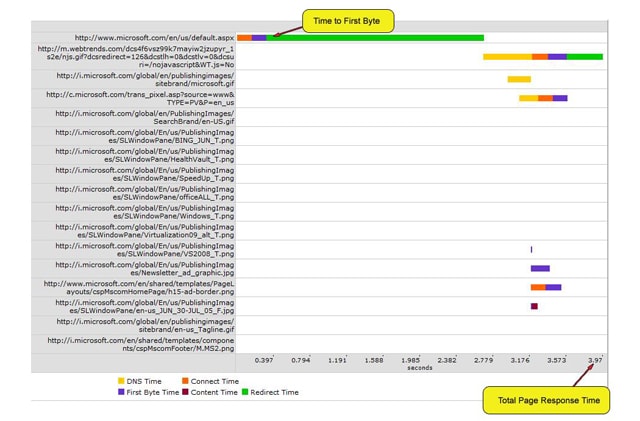
Figure 4: http://www.microsoft.com Response Times
From the previous two diagrams, it is evident that the ‘Time to First Byte’ and the ‘Total Page Response Times’ can vary quite considerably. This will dependent upon the number of other resources and artifacts that are present on the particular page being measured. It is important to be able to quantify these differences, as your web application may respond very fast on its own, but the dependent requests and resources in the page may be degrading the performance considerably.
What about Average Response Time?
The average response time for a web application is often a misleading metric, as there is ambiguity around what the average time actually means.
- Does it refer to the average Time to First Byte?
- Does it refer to the average Total Page Response Time?
- Does it include static resources such as CSS and image files?
- Does it include the low end figures at low levels of load or at other different times?
It is worth bearing in mind that serving static files will be much faster than processing a request through the full request execution pipeline, and so if static files are included in this metric then average response times will appear faster than what they are. The result is obviously more ambiguity, and the metric will provide no real correlation to page responsiveness and overall application performance.
There is also the question of what point the metric samples taken at to determine the average? A common practice is to use percentile brackets to determine the average response time. For example, if a 90th percentile was used to determine the average response time, this would mean that out of 100 requests, ordered from best to worst times, the requests in the last 10% of requests (that is, the 10 worst performing requests) are used to find the average.
Because of this ambiguity, the average response time is generally best used to compare against previous averages for the same time period, but only for the purposes of determining if the latest performance run has shown improvement or degradation compared to the last run (i.e. it’s a relative measure).
This can be a useful metric, though I always recommend that this percentile bracket should be used in conjunction with examining the more specific TTFB and Total Page Response times discussed previously. Equally, you don’t necessarily have to use the 90th percentile, the 85th percentile could just as easily be chosen to determine averages. That being said, I recommend that you use the 85th, 90th and 95th percentile brackets, as these provide a valuable insight into the ‘worst case scenario’ of response times for whatever is being tested, in terms of both Time to First Byte and Total Page Response time.
“Sweet Spots” and “Operational Ceilings”
We’ve seen that the performance targets which have been identified by the business represent acceptable response times under various load conditions. Irrespective of the current system load, these response times are often referred to as the “sweet spot”, and are the response times and useable states that best serve the users of the application.
The “sweet spot” may initially be nowhere near what the business requires from the application. The response times expected of the application may initially be at concurrent user levels far below what is deemed acceptable by the business to serve the customer base. It is crucial to identify the “sweet spot” and how far from that target the application currently is, as you’ll need to make those two states match before business requirements can be met.
However, the “sweet spot” is just one aspect of the application; It is also important to know what the limit of the application is, and whether it is resilient enough to cope with extremely large user loads. This is the stress testing aspect of performance testing and analysis, and requires you to ask the questions.
- How long can the application cope with relatively high concurrent user loads before it becomes totally unresponsive?
- In addition, what characteristics does the application exhibit at these high concurrent user loads?
These are important questions in determining the operational characteristics of the application. The number of concurrent users (or ‘load’) that the application can withstand before becoming totally unresponsive is referred to as its operational ceiling. That is, the ceiling or limit at which the application can operate before failure. This limit will typically involve excessive response times that make the web site practically unusable, but this metric still serves as a good comparative indicator against previous performance tests. It also provides valuable evidence as to what will happen when the application experiences a larger load than it can handle.
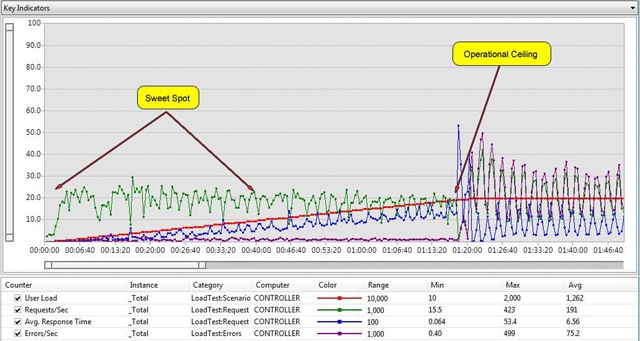
Figure 5: Example performance run graph
This diagram shows an example performance run. The red line represents concurrent user load, the blue line represents response time, the purple line represents errors per second, and the X-Axis represents the time component of the performance test. It is clearly apparent where the “operational ceiling” is, as errors-per-second and response time make a sharp change at approximately one hour and twenty minutes into the run.
In addition, we can discern that the sweet spot for this application (in this case, a Time to First Byte response time of less than 5 seconds) is in between the start of the performance run and approximately forty minutes into test. Using Visual Studio Team Test we can drill into these results to determine the concurrent user load at the sweet spot as well as the operational ceiling, and this process will be described later in my book.
Conclusion
The objective of this chapter is to provide an understanding and a framework around determining what targets need to be identified for a web application to be classified as a well-performing application. This is a relative term that needs to factor in the user base and business which the application serves.
Having these targets identified means that the relatively expensive exercise of performance testing has a well-defined set of goals which can be measured and tested against. In addition, the business has a well defined set of measurements from which to determine that the application meets its requirements. These measurements provide a degree of confidence in a technical procedure that is typically unfamiliar territory for businesses.
The “Sweet spot” and the “Operational ceiling” aspects of the application provide valuable evidence into how the application performs at various load levels. With this evidence, as solution architects, we can provide informed conclusions around the application capabilities and also how estimate much time and effort is needed to to achieve the business’ goals.
The following chapters in my book will take you through the technical steps required to ensure that the business and technical staff alike can ensure that the application performs as required.
This document contains proprietary information and is protected by copyright law.
Copyright © 2026 Red Gate Software Limited. All rights reserved
Load comments