
Make it go faster
Speed, efficiency, and throughput. Performance profiling is all about getting more of these things out of your application code…or is it? As a team leader or manager, you would need to question the wisdom of investing time and money into improving your application’s performance if the application is currently working OK with the current volume of users. We could potentially invest time in enhancing or adding functionality rather than fine-tuning code that is already working. Performance work, after all, can be time-consuming and therefore expensive.
What about if you are engaged in creating a brand new application written from the ground-up? The developers and team leads are adhering to best practices, and therefore this application should perform quite well from the outset. The application is not bound by legacy code in any way and the latest toolsets are being used; so, performance wise, we should be good to go. Right?
While there are elements of truth to what I’ve said, it is very unwise to assume that performance in general will be fine. You don’t necessarily improve performance by following industry-wide ‘best practices’; They might not be directly relevant to your system. Applications all have their own specific use cases, flows and nuances. If you believe that you can ensure good performance by following ‘best practice’ advice blindly, you are likely to experience exactly the opposite effect.
Application performance is about more than just performance
Apart from the obvious advantages of making your application more efficient, what else do you gain from regular performance profiling and testing? To understand this, we need to distinguish between the macro level and micro level of performance tuning.
Macro level – Performance, load, and stress testing
At the macro level, we have load testing or performance testing. Strictly speaking, performance testing, load testing and stress testing are related techniques, but we will refer to them all as ‘application performance testing’. This type of test focuses in on the performance of the application at various levels of ‘load’ or user activity. Typically for web applications, this means running functional flows (such as adding an invoice or searching for a widget) with varying degrees of concurrent user load. A typical run may involve starting at one user, then slowly increasing this to 10, 25, 50, and 100 concurrent users (for example). For a desktop application, this might be simply performing a series of common actions. A detailed description of how to approach such broad testing is beyond the scope of this article, but the end result is usually a set of metrics that detail how well the application is performing. Metrics such as CPU activity, memory usage, request execution time, GC utilisation (garbage collector utilisation) and a host of other metrics can show how an application is running at a high level, under different scenarios. Visual Studio has tools to perform load testing but there are also many companies offering this as a cloud service.
The following diagram shows the results of an example load test run:
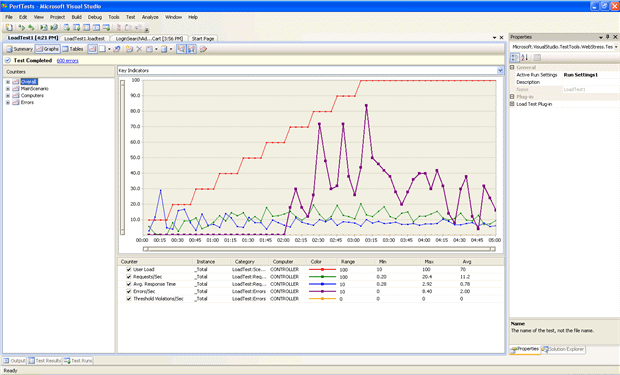
Figure 1: Example results of a load test run
Figure 1 shows how Visual Studio can show you the volume of concurrent users being applied to the system, with other metrics such as requests per second and average response time over the course of the load being applied. As you can see, this provides a high-level view but does not attempt to show the reason why the code is performing in this manner.
Micro level – Performance profiling
At the micro level, we have performance profiling. This typically involves gaining a detailed look at the performance of a very specific operation. This may involve saving a contact record, or searching for an invoice. We aren’t looking at a business process but a single action. Here we also look at broad metrics such as CPU utilisation and memory usage, but often look at more detailed characteristics such as database query execution plan (if a database call is made), class instance counts, time of each method call down the stack and many others. There are plenty of products that allow you to view an application’s performance profile at the Micro level. This is the sort of thing that you’ll see.
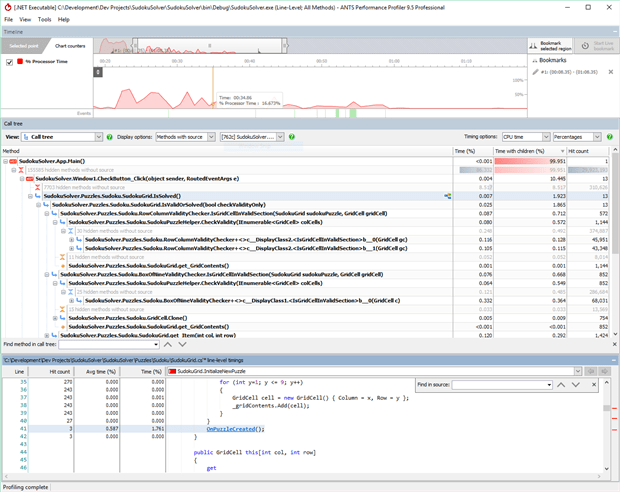
Figure 2: Example results from performance profiling run
Figure 2 shows an example output of an application being performance profiled using ANTS Performance profiler. These results show very specific methods being called, how long they took, the percentage of overall time they took right down to the source code. With this particular tool, you can even inspect the database’s query plan if the problem lies there.
So I know about high-level performance testing and detailed performance profiling, now what?
What can we hope to ascertain from using both the broad and detailed approaches to profiling, performance testing or tuning? Usually the broad level, or macro level will provide the “what”, and the detailed or micro level will provide the “why”. In other words, high-level performance or load testing will show “what” can be achieved in a given scenario whereas detailed performance tuning will show “why” code is performing that way as well as suggesting how that can be improved.
Performance testing and profiling are often seen as a “hard sell” to the business because it can be time consuming, and is not directly involved with adding new functionality. In reality, performance testing and profiling provide immense benefits to business and technical teams alike. What the combined macro and micro views really give though, is the following:
- User retention and acquisition: User retention is one of the most important business goals for an application, although this is not often associated with performance testing or profiling. By regularly profiling your application code, you can ensure that no modifications or additions to the code base ever introduce performance problems bad enough to persuade existing users to ‘churn’.If your application is slow, unresponsive, or sluggish, then users can quickly become frustrated and may look elsewhere for similar functionality. By having a fast, responsive application, you ensure that your users can access the functionality they need, without the distraction of results not appearing when expected, unresponsive interface controls and long running queries. Your application may perform all the required functionality that a user needs but, if it is too slow or unresponsive to use, users will go elsewhere.By ensuring that your application performs well, you not only help to retain users, but make those users more inclined to recommend your application to other users, thereby accelerating user-acquisition.
- Predictability: For web applications we know that, in a given set of circumstances, the application can handle a specific number of concurrent users with a specific response time. For desktop apps, this is the time it takes from initiating an action to getting back the actual usable result. From a business perspective, this allows a degree of capacity-planning and risk-mitigation. If you already have a user base, you will now have a much clearer understanding of whether your application can serve the current user-base or whether you need more hardware, resources or other application elements to serve your customer base. If you are creating a brand new application that is yet to establish a user base, the rate at which you acquire new users will give you an idea of when you may hit the capacity of your system.When you are using cloud providers to provide your infrastructure, it may seem easy to get extra infrastructure with services such as Azure and Amazon. They make it easy to scale, but at a cost, and it is a cost that will begin to hurt you if you have to keep “dialing up” the scale of your site to accommodate small to moderate increases in load or volume. A business that can confidently predict how well an application can serve its customer base, at what cost, and at what point they may need extra capacity is in a much better position than one that cannot.
- Design decisions: Whether they are new or existing applications, there is typically an architectural pattern or set of general principles to follow when working on an application. Regular performance testing, especially at the detailed level, will ensure that the architectural principles being advocated are also conducive to an application that performs well. You need to validate your architectural principles: In order to gain users, it is essential to ensure that not only is the code clean and maintainable, but also that it performs well, and that the very act of gaining more users does not bring down the system or render it unusable. In addition to this, performance profiling can be extremely valuable when coming up with the architectural principles in the first place, and in contributing valuable information when providing the initial vertical slice or blueprint of code for other developers to follow.
- Reliability: When more and more users start using the system, you will want to ensure that the system can cope. No matter how much infrastructure you throw at a system, slow or bad performing code will cause a backlog of requests and begin to affect all downstream systems. If problems like this are left to fester, it becomes a struggle to fix the issues without some major refactoring or system overhaul. This means time, money and more importantly an unsatisfactory experience for your users. Database queries often show up here: Queries may initially operate within reasonable bounds despite doing, perhaps, an unnecessary table scan; but after more customer data is added, these queries can significantly slow the system and simply get worse over time. By profiling performance and capturing the query metrics, it is possible to prevent this becoming a problem for users by providing an insight into a resolution before it becomes one.
- Reduced support incidents: If a system is slow, or perhaps takes a long time to return results from an operation, users are more likely to complain and raise support issues. This places extra burden on all aspects of the business, service personnel who deal with the query, business users who must manage the customers experiencing the issues, and of course the system engineers who must solve the issue, diverting resources away from enhancing the functionality of the product.
- Service level guaranteeSome applications are required to provide a guarantee of the level of service provided. This may take the form of “The application is required to respond in less than 2 seconds for general operation, and only take a maximum of 5 seconds when returning report results.” This is obviously a very simplified example but it is a common type of requirement. The only real way of ensuring that you can meet those guarantees is by testing performance and by profiling.
Let’s just get the application out, and worry about performance later
Quite often, developers delay the task of performance profiling, testing or tuning until late in the cycle. While this is better than not doing it all, the errors that are discovered will require a far greater scale of remediation, architectural changes or refactoring. There is a high cost to performing these operations late in the development cycle, because so you will then have to redo much more. It is hard to justify this additional delay and cost. Instead, it becomes cheaper to throw more hardware at the problem even though it is costly and is a band-aid solution. Ideally, the best way to ensure there are no lurking issues, and that the system design is valid from a performance perspective, is to perform any performance work early as part of the architectural pattern.
In an ideal world, I get to ride unicorns.
In an ideal world, we have performance testing rigs available (whether on premise or cloud provided), with automated tests running at regular intervals testing the system, collecting metrics, and developers all have profiling tools with enough experience to know how to use the effectively in their development efforts.
We don’t live in an ideal world though, and this idyllic setup is tough to achieve without compromise. In large organisations with enough resources, time, and/or money, this may be possible (and encouraged), but in smaller organisations and startups, it simply may not be attainable. In the face of a difficult reality, the easiest path is to perform at least some degree of performance profiling. They are relatively low cost and yield enormous benefit. For example, running a single profiling session within ANTS performance profiler can yield:
- The slowest methods in all functional paths, with those methods visibly highlighted for easy identification.
- Percentage times on what methods are using up most of the time.
- Timings at the Source-code level to show exactly where the slow code is.
- The number of times that a method has been called
- Any SQL Server database execution plans that may have been performed as a result of the functional flows.
Without a profiling tool such as this, all you can do is rely on guesswork, you’ll need to order pizza and stock up on coffee if your guesses are wrong, because it will take a long time.
If you use frameworks that perform much of the lower level work, it can be quite difficult to know, without profiling, the performance impact of seemingly innocuous and simple code.
An example is worth 1000 words (well at least 750 anyway)
To show the benefits of early performance profiling, let’s consider an example. Your team have been asked to develop a basic site to sell widgets. The core components have already been written or are being written by another team. These core components are:
- Repository component: This will be responsible for accessing the data store.
- Cost calculation service: This will calculate the cost of a widget, including all its required parts and taking into consideration cost margins.
- Lookup service: This will allow lookup of all the widgets or a single widget.
Your team is to write the web site that allows display, selection and purchase of the widgets. The development of the application has a few guidelines. The architects have mandated that all development should follow the S.O.L.I.D principles and to use the Microsoft ASP.Net MVC framework. (see https://en.wikipedia.org/wiki/SOLID_(object-oriented_design) ). One of the core guidelines of S.O.L.I.D principles is the use of dependency injection to allow easier testing and a modular, loosely coupled design.
Your team begins development of the site in accordance with the user interface guidelines with progress going well.

Figure 3: Extremely well designed home screen user interface

Figure 4: Widget purchase confirmation screen
|
1 2 3 4 5 6 7 8 9 10 11 12 13 14 15 16 17 18 19 20 21 22 23 24 25 26 27 28 29 30 31 32 33 34 35 36 37 38 39 40 41 |
HomeController public class HomeController : Controller { private ILookupService _lookupService; public HomeController(ILookupService lookupService) { _lookupService = lookupService; } public ActionResult Index() { var viewModel = new WidgetListViewModel(_lookupService.GetAllWidgets()); return View(viewModel); } public ActionResult About() { return View(); } } PurchaseController public class PurchaseController : Controller { private ICostCalculationService _costCalcService; private ILookupService _lookupService; public PurchaseController(ICostCalculationService costCalcService, ILookupService lookupService) { _costCalcService = costCalcService; _lookupService = lookupService; } public ActionResult Index(long id) { var widget = _lookupService.GetWidgetById(id); var viewModel = new WidgetPurchaseViewModel(widget, _costCalcService.CalculateCost(widget)); return View(viewModel); } } |
The code clearly shows dependencies which are explicitly stated in the constructor of each controller. These dependencies are then used in the controller to obtain the results to render in the specific view. As a result, the controllers are lean and adhering to the S.O.L.I.D principles mandated by the architects.
The dependencies are registered into their container in the startup code.
|
1 2 3 4 5 6 7 8 9 10 11 12 13 14 |
public static void ConfigureDependencies(this IAppBuilder app) { // 1. Create a new Simple Injector container var container = new SimpleInjector.Container(); // 2. Configure the container (register) container.Register(Lifestyle.Transient); container.Register(Lifestyle.Transient); container.Register(Lifestyle.Transient); container.Register(Lifestyle.Transient); System.Web.Mvc.DependencyResolver.SetResolver(new SimpleInjector.Integration.Web.Mvc.SimpleInjectorDependencyResolver(container)); } ,>,>,>,> |
Before the team decides to put the site into a test environment for management to review, they decide to run some initial performance profiling using the profiler to establish a baseline for later comparison and to ensure that no obvious performance issues are introduced.
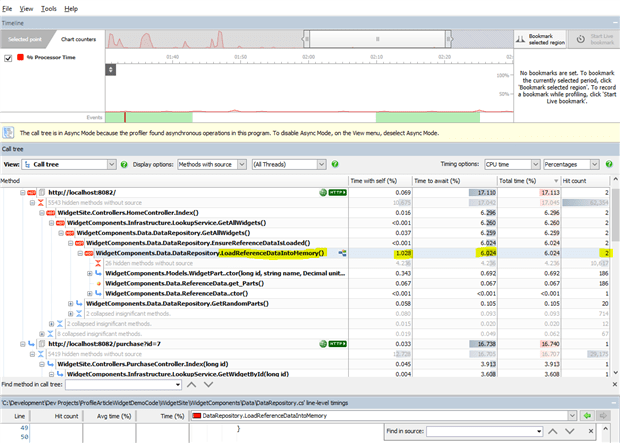
Figure 5: Results of baseline performance profiling, using ANTS .Net Performance Profiler
From the results of the profiling, the performance profiler has quickly identified an area of concern. Drilling down into the ‘Hot’ region of the code, we can see that the ” LoadReferenceDataIntoMemory” method of the DataRepository is doing something bad. Firstly, it seems to be taking a much longer time than any other method, in addition to being called more than once. This results in the site feeling sluggish. Furthermore, given the name of the method, it would seem that reference data should be only loaded once, not multiple times. It would appear to be a defect in a downstream component, namely the DataRepository. At this point we can do 2 things. We can attempt to resolve this issue by altering how me use that component, or we can contact the team responsible for its development and assess what is going on in an attempt to resolve the issue.
For this example, we can do both of those things. Firstly, since we have no real interaction or control over this component apart from its registration in the dependency injection system, we can begin there.
The DataRepository component is a dependency of both the CostCalculationService and the LookupService and it is registered in the code as shown in the following code snippet:
|
1 |
container.Register<IDataRepository, DataRepository>(Lifestyle.Transient); |
This code states that whenever an instance of a class that implements the IDataRepository interface is required, the dependency injection system will provide a new instance of the DataRepository class. This is indicated by the ‘Lifestyle.Transient’. If we asked the dependency injection system to provide a single instance of this class (in technical terms, a “singleton”), this may help. We can do this with the following code:
|
1 |
container.Register<IDataRepository, DataRepository>(Lifestyle.Singleton); |
With this simple change in place, we can now perform another round of profiling and compare the results.
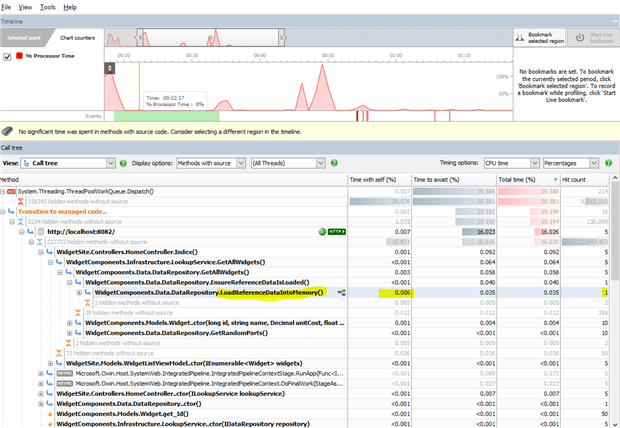
Figure 6: Results of performance profiling after modifications (ANTS .Net Performance Profiler)
Looking at the results of the performance profiling after making this change, we can see significant difference with the DataRepository only calling the ” LoadReferenceDataIntoMemory” method only once. The profiler has no longer highlighted the method as a performance concern. Subsequent calls to this component show quick response times suggesting some state management issues or state design assumptions made in the DataRepository component.
Upon communicating this with the team responsible and looking through the code, it becomes apparent what is happening. The DataRepository class contains the following code:
|
1 2 3 4 5 6 7 8 9 10 11 12 13 14 15 16 17 18 19 20 21 22 23 |
public class DataRepository : IDataRepository { private ReferenceData _refData; ...extra code removed for brevity public IEnumerable GetAllWidgets() { EnsureReferenceDataIsLoaded(); if (_widgets == null) .... } private void EnsureReferenceDataIsLoaded() { if (_refData != null) { // Already loaded reference data return; } LoadReferenceDataIntoMemory(); } } |
From this code we can see a private member declared to hold the reference data and methods that ensure that reference data is loaded before performing any operation. If a new instance of this class is created every time by our dependency injection system, then the reference data must be reloaded.
We have managed to solve this by creating a singleton of the DataRepository : However, this may not be ideal because all consumers must know about registering the component this way. Code changes can be made to the DataRepository to load the data into an external cache, or a static private member, but these are all decisions to be decided by the architect and teams themselves.
What is important is that a problem was proactively identified. The issue was raised and fed back into the development cycle so that design decisions can be made on how to resolve it.
So what have we accomplished?
This example, while contrived, is still very applicable to today’s development practices. The use of dependency injection is a common and accepted practice that helps to abstract away the implementation of components. In this scenario, we have prevented a serious performance issue from getting even to the test phase, let alone production. Resolving issues before any form of testing is significantly more cost-effective than having to find the issue during a test cycle and go through another round of testing. Additionally, we have influenced the design and coding aspects of the components and changed the way that aspects of development are performed. This has benefits for the entire team, management and developers alike.
We have effectively performed “preventative profiling”. The time taken to run the performance profiler and have it tell us where the issue is, is extremely small yet yields great benefit. The net gains in this scenario are clear. As development progresses and the teams learn what not to do, these kinds of issues become far less, therefore enhancing the productivity overall even more.
Important things to consider
Regardless of your approach to performance testing and profiling, there are a few key things you simply must take into account for it to be effective.
- Ensure you have a baseline. As soon as you have something to test against, you should record the initial metrics and save that as a baseline for later comparison. Otherwise, you do not know whether you really have improved anything.
- Do not perform too many performance-related changes in one hit.You will not identify whether any particular change was effective. In addition, the net total may be positive, but one of the changes may actually have made things a little worse.
- Premature optimisation can be bad. Avoid spending time doing a lot of optimising of code until you are sure that there is actually a problem. It is much better to perform some initial profiling to ensure that nothing is overly bad, or obviously wrong, from a performance perspective. Spending a lot of time getting code to perform as well as possible may just use lots of time with minimal gain. Gaining a few milliseconds may not be worth the large volume of time required to make it so.
Conclusion
The term “preventative profiling” was used in the code example to show how effective performance profiling can be when integrated into the development process. This is true not only for the developer working on their section of code, but for the team overall. Any manager that can get a product to market quicker because of fewer defects found while testing, is a happy manager indeed.
The productivity gains operating this way become exponential over time as the output of your development activities not only increases the quality of your output, but the level of understanding around performance also increases which translates into ongoing benefits.
The myriad cost benefits are also present in the time taken to develop the code, time to test, time to market, reliability and customer satisfaction. For such a relatively small investment to yield such potentially large returns, proactive or preventative performance profiling is a very wise investment indeed.
This document contains proprietary information and is protected by copyright law.
Copyright © 2026 Red Gate Software Limited. All rights reserved
Load comments