
You can build a web-based Business Intelligence dashboard by combining R for statistical data extraction and transformation with ASP.NET MVC for the presentation layer. R connects to a SQL Server database via the RODBC library, processes the data using built-in statistical functions, and outputs HTML fragments and chart images that ASP.NET MVC renders in a responsive Bootstrap layout. This tutorial walks through the complete integration – from configuring R and SQL Server to displaying KPI reports and trend visualizations in a browser.
Part 3 covers Lattice and googleVis
Introduction
In this article, I will be showing you, step-by-step, how to create a web-based Business Intelligence Dashboard using ASP.NET MVC and Twitter Bootstrap that uses R to get data from a SQL Server database and do transformations on it that are then rendered on the dashboard. In the subsequent article, I will go on to show you how to use R visualization libraries to transform the data into graphs that highlight the trends in the data and show some statistical measures. I’ll also show how to update the presentation layer when the data source changes, and move on to other ways to make the application more versatile.
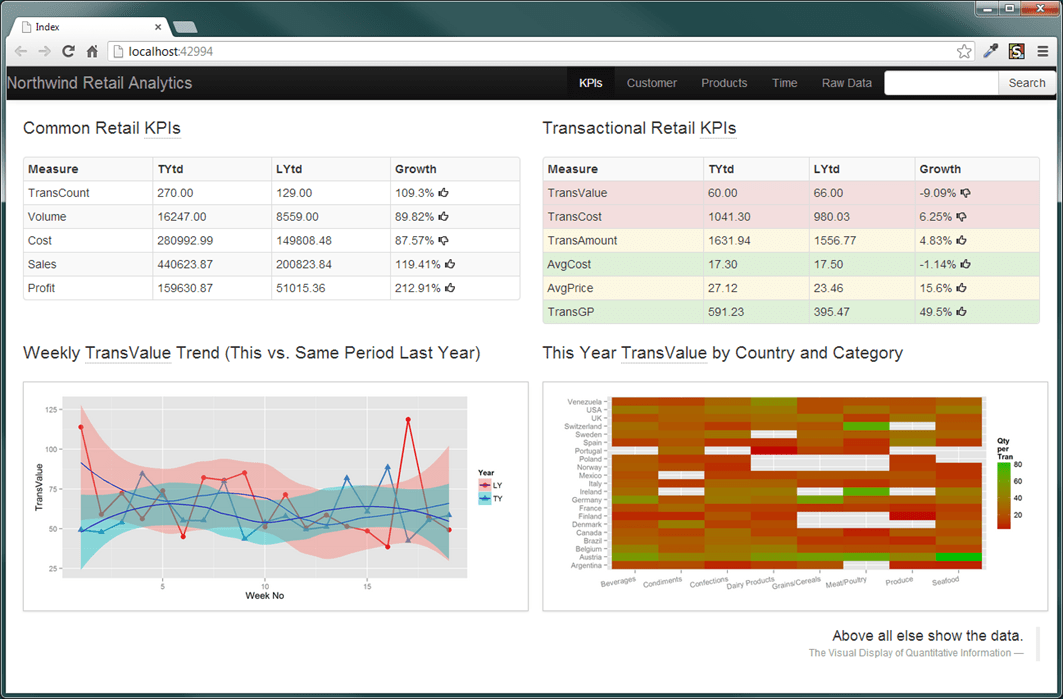
Figure 1. BI Dashboard built with R, ASP.NET MVC and Bootstrap
Why use R?
R popularity as a data mining and statistical software continuously grows. Here is a quotation from the blog ‘Companies using Open Source R in 2013‘:
- The New York Times routinely uses R for interactive and print data visualization.
- Google has more than 500 R users.
- The FDA supports the use of R for clinical trials of new drugs.
- John Deere uses R to forecast crop yields and optimize tractor manufacturing.
- The National Weather Service uses R to predict the extent of flooding events.
- Zillow uses R to model housing prices.
- The Consumer Financial Protection Bureau uses R and other open source tools.
- Twitter uses R for data science applications on the Twitter database.
- FourSquare uses R to develop its recommendation engine.
- Facebook uses R to model all sorts of user behaviour.
Why Use ASP.NET MVC?
The Internet is an effective way of delivering and maintaining at least some software applications, including BI applications. ASP.NET MVC is not the only option for creating a web-based application capable of delivering this sort of functionality. Another choice, for example, could be the Shiny server. It is a promising technology for R users, although at the moment it is very limited as far as the UI development is concerned.
I eventually chose ASP.NET MVC because it is the latest manifestation of Microsoft’s web strategy, and it is technically superior to its predecessor ASP.NET Web Forms. According to Dr. Dobb’s magazine ASP.NET MVC addresses the business and technology changes that have occurred during the intervening period – testability, separation of concerns, ease of modification. It is also enjoying a rapid growth of popularity. Here is the Interest over ‘Time Comparison and Forecast’ chart from Google Trends that support this.
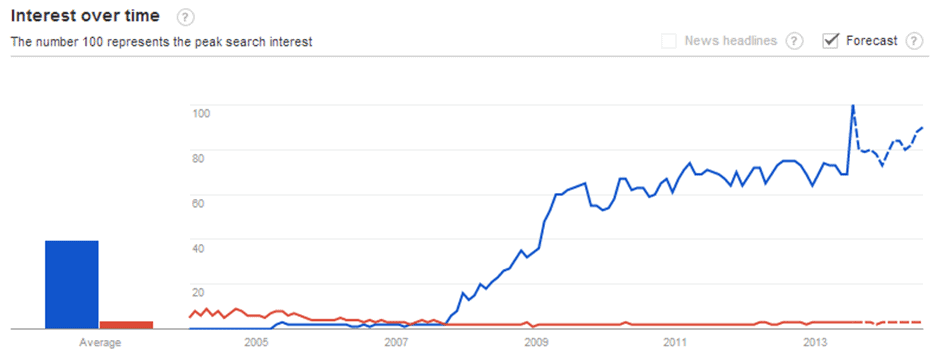
Figure2. Recent popularity trend for ASP.NET MVC and ASP.NET Web Forms.
Getting Started
This application uses the following tools and technologies
- R – a free software environment for statistical computing and graphics,
- ASP.NET MVC4 – a free framework for building web applications,
- Twitter Bootstrap – a free collection of CSS-based design templates for interface components, as well as JavaScript extensions,
- a well-known demo Northwind database as source of the data,
- Microsoft SQL Server 2012 Express – a free database server
Please use the web links I’ve provided here for these software components if you’d like to follow along. Although it might sound obvious, the sequence of the installation is important. Please, therefore, install ASP.NET MVC after VS Express, and install Northwind database after MS SQL 2012 Express. How to: Install Sample Databases page provides the instructions on how to make the Northwind database compatible with MS SQL Server 2012.
Some Key Performance Indicators (KPIs) that are calculated by the application require a product cost that does not exist in the original Northwind database. Click on this link to download a SQL script that recreates and populates the Product table with the added UnitCost field and updates the UnitCost field added to the Order Details table as well.
You also need to download and install these R packages: RODBC and R2HTML. The following command install.packages(c ("RODBC","R2HTML")) executed from the command prompt in the R console does the trick.
Data Extraction and Transformation
The Figure 3 below illustrates the application architecture and the data flow.
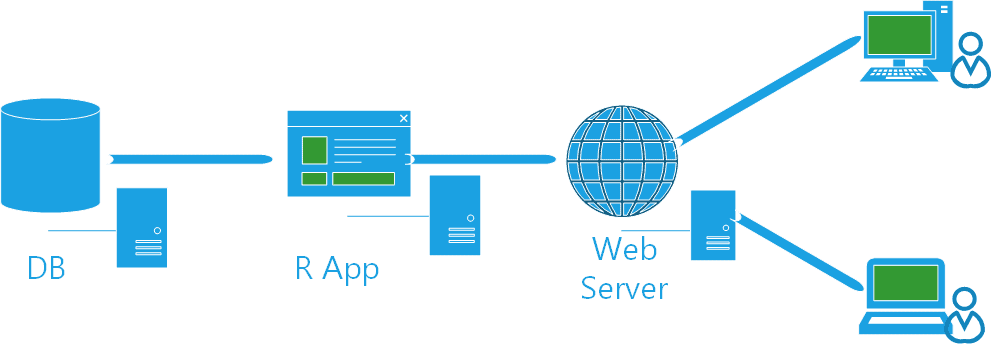
Figure 3. The application architecture and data flow.
The main component of the application is the R engine (a collection of R routines). The engine extracts the data required for each report from the Northwind database, performs necessary analytic calculations and data transformations and passes the results to the Web server that brings it to the end-users.
Implementing the Common Retail KPIs report
Let us begin with the Common Retail KPIs report that is located in the top left corner of the above dashboard page. The Listing 1 shows the code of the routine that does the “R bit” of the report.
|
1 2 3 4 5 6 7 8 9 10 11 12 13 14 15 16 17 |
library(RODBC) library(R2HTML) cn<-odbcConnect('NW',uid='******',pwd='******') coreKPI<-sqlFetch(cn,'Ch1_Core_KPIs_vw') odbcClose(cn) tmp <- 100*(coreKPI$TYtd-coreKPI$LYtd)/coreKPI$LYtd tmp <- round(tmp, 2) tmp <- paste(tmp,'% ',sep="") coreKPI$Growth <- paste(tmp, coreKPI$Growth) colnames(coreKPI)<-c('Measure','TYtd','LYtd','Growth') wd <- getwd() htmldir <- paste(Sys.getenv("HOME"), "\\R Analytics\\R-2-ASP\\Reporting\\Content\\html\\", sep="") setwd(htmldir) filename <- 'coreKPI.html' if(file.exists(filename)) file.remove(filename) HTML(coreKPI, file = filename,nsmall=2,decimal.mark='.',row.names=FALSE,Border='0') setwd(wd) |
Listing 1. CommonKPI.r R procedure
The above routine
- opens the Northwind ODBC connection (it is named as NW in the code),
- runs the Ch1_Core_KPIs_vw view (see Listing 2) that returns the data set shown in the Table 1 and saves it in the coreKPI data frame variable,
- adds a new calculated vector tmp and applies rounding and formatting to it,
- appends the last column of the coreKPI data frame that holds the HTML code for the Bootstrap icons (I explain this later), and finally
- saves the updated version of the coreKPI data frame as an HTML snippet (see Listing 4)
|
1 2 3 4 5 6 7 8 9 10 11 12 13 14 15 16 17 18 19 20 21 22 23 24 25 |
SELECT TOP (100) PERCENT Measure, TYtd, LYtd, Growth FROM ( SELECT '1' AS SO, Measure, TYtd, LYtd, CASE WHEN [TYtd] < [LYtd] THEN '<i class="icon-thumbs-down"></i>' ELSE '<i class="icon-thumbs-up"></i>' END AS Growth FROM dbo.Ch1_TransCount_KPI_vw UNION SELECT '2' AS SO, Measure, TYtd, LYtd, CASE WHEN [TYtd] < [LYtd] THEN '<i class="icon-thumbs-down"></i>' ELSE '<i class="icon-thumbs-up"></i>' END AS Growth FROM dbo.Ch1_Qty_KPI_vw UNION SELECT '3' AS SO, Measure, TYtd, LYtd, CASE WHEN [TYtd] < [LYtd] THEN '<i class="icon-thumbs-up"></i>' ELSE '<i class="icon-thumbs-down"></i>' END AS Growth FROM dbo.Ch1_Cost_KPI_vw UNION SELECT '4' AS SO, Measure, ROUND(TYtd, 2) AS TYtd, ROUND(LYtd, 2) AS LYtd, CASE WHEN [TYtd] < [LYtd] THEN '<i class="icon-thumbs-down"></i>' ELSE '<i class="icon-thumbs-up"></i>' END AS Growth FROM dbo.Ch1_Sales_KPI_vw UNION SELECT '5' AS SO, Measure, ROUND(TYtd, 2) AS TYtd, ROUND(LYtd, 2) AS LYtd, CASE WHEN [TYtd] < [LYtd] THEN '<i class="icon-thumbs-down"></i>' ELSE '<i class="icon-thumbs-up"></i>' END AS Growth FROM dbo.Ch1_GP_KPI_vw ) AS derivedtbl ORDER BY SO |
Listing 2. Ch1_Core_KPIs_vw view.
I assume that the reader has some experience with R language, but if you forgot some R functions, type help(functionName) at the R console command prompt to see the corresponding help.
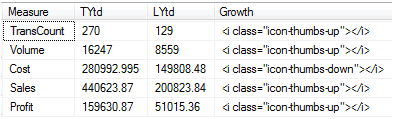
Table 1. Data set returned by the Ch1_Core_KPIs_vw.
Each line in the Table 1 is generated by a separate view. One of them is shown in the Listing 3. This and four other views were combined into the Ch1_Core_KPIs_vw view using SQL UNION Operator. For simplicity I hardcoded the filter values, but it would be a minor hurdle to use parameterized stored procedures instead of the views. You can try it on your own.
|
1 2 3 4 5 6 7 8 9 10 |
WITH Base AS ( SELECT TOP (100) PERCENT CASE WHEN YEAR(dbo.Orders.OrderDate) = 1997 THEN 'LYtd' ELSE 'TYtd' END AS Period, COUNT(DISTINCT OrderID) AS TransCount FROM dbo.Orders WHERE (dbo.Orders.OrderDate BETWEEN '19970101' AND '19970506') OR (dbo.Orders.OrderDate BETWEEN '19980101' AND '19980506') GROUP BY CASE WHEN YEAR(dbo.Orders.OrderDate) = 1997 THEN 'LYtd' ELSE 'TYtd' END ORDER BY Period ) SELECT 'TransCount' AS Measure, * FROM Base t PIVOT (SUM([TransCount]) FOR Period IN ([LYtd], [TYtd])) AS p |
Listing 3. An SQL view that generates first line in the Table 1.
The CommonKPI.r R routine generates the following HTML fragment.
|
1 2 3 4 5 6 7 8 9 10 11 12 13 14 15 16 17 18 19 20 21 22 23 24 25 26 27 28 29 30 31 32 33 34 35 36 37 38 39 40 41 42 43 44 45 46 47 48 49 50 51 52 53 54 55 56 57 58 59 60 61 62 63 64 65 66 67 68 69 70 71 72 73 74 |
<p align="center"> <table cellspacing="0" border="0"> <caption align="bottom" class="captiondataframe"></caption> <tr> <td> <table border="0" class="dataframe"> <tbody> <tr class="firstline"> <th>Measure </th> <th>TYtd </th> <th>LYtd </th> <th>Growth</th> </tr> <tr> <td class="cellinside">TransCount </td> <td class="cellinside">270.00 </td> <td class="cellinside">129.00 </td> <td class="cellinside">109.3%<i class="icon-thumbs-up"></i> </td> </tr> <tr> <td class="cellinside">Volume </td> <td class="cellinside">16247.00 </td> <td class="cellinside">8559.00 </td> <td class="cellinside">89.82%<i class="icon-thumbs-up"></i> </td> </tr> <tr> <td class="cellinside">Cost </td> <td class="cellinside">280992.99 </td> <td class="cellinside">149808.48 </td> <td class="cellinside">87.57%<i class="icon-thumbs-down"></i> </td> </tr> <tr> <td class="cellinside">Sales </td> <td class="cellinside">440623.87 </td> <td class="cellinside">200823.84 </td> <td class="cellinside">119.41%<i class="icon-thumbs-up"></i> </td> </tr> <tr> <td class="cellinside">Profit </td> <td class="cellinside">159630.87 </td> <td class="cellinside">51015.36 </td> <td class="cellinside">212.91%<i class="icon-thumbs-up"></i> </td> </tr> </tbody> </table> </td> </table> <br> |
Listing 4. The HTML snippet generated by the CommonKPI.r R routine.
Now we are ready to build the “ASP.NET bit” of the application.
Tackling the Presentation Layer
Open Visual Studio (VS) and create a blank solution named R-2-ASP. Right click on the solution name in the Solution Explorer, select Add New Project from the context menu, and select the ASP.NET MVC 4 template from the Visual C# Web template group. Type Reporting as a name of the project. Select Empty template from the New ASP.NET MVC project template dialog box; make sure that Razor is selected as a View Engine and click OK.
Figure 4. Creating the ASP.NET MVC project.
If the Package Manager Console is not visible at the bottom of the Visual Studio window, select the ‘VIEW\Other Windows\Package Manager Console’ menu to make it visible, and then type Install-Package twitter.bootstrap.mvc4. After that, run Install-Package twitter.bootstrap.mvc4.sample command.
This installation does a lot of work for you. It ‘blends’ Bootstrap package into our MVC4 project, creates navigation menus and default views (although we don’t need them all as we are not implementing any CRUD views) and more. Here is how the VS project’s structure should look like if the installation completed successfully.
Figure 5. ASP.NET MVC project structure.
To create a folder where the R engine will load the HTML files right click on the ‘Content’ folder, select ‘Add\New Folder’ from the context menu, and name it as ‘html’. The HTML files, generated by R (see Listing 4 e.g.) require some post-processing to remove some redundant mark-up and change the HTML table CSS class to enable the Bootstrap styling and navigation. A custom ASP.NET MVC Helper class would a good option for that. A static method of that class will read our HTML snippet, process it and returns a new HTML string.
Add a new folder named ‘Helpers’ to the project. Right-click on the new folder and select ‘Add\New Class’ from the context menu. Name the class as ‘HtmlHelpers.cs’. Make this class static and create a static method ‘LoadHtml’, which is shown in the Listing 5.
|
1 2 3 4 5 6 7 8 9 10 11 12 13 14 15 16 17 18 19 20 21 22 23 24 25 26 |
using System.Net; using System.Web; using System.Web.Mvc; namespace Reporting.Helpers { public static class HtmlHelpers { public static MvcHtmlString LoadHtml(this HtmlHelper html, string file) { //import html content (file) string rawHtml = new WebClient().DownloadString(HttpContext.Current.Server.MapPath(file)).ToString(); //change CSS class to make it compatible with Bootstrap rawHtml = rawHtml.Replace("dataframe", "\'table table-striped table-bordered table-condensed table-hover\'"); //find the beginning of the inner table and get the portion of the imported content //from that position to the end int startIdx = rawHtml.IndexOf("<table b"); rawHtml = rawHtml.Substring(startIdx); //find the end of the inner table and remove the tale after the end int endIdx = rawHtml.IndexOf("</table") + "</table>".Length; string innerTbl = rawHtml.Substring(0, endIdx); //return the inner html table to the view return MvcHtmlString.Create(innerTbl); } } } |
Listing 5. Custom HTML Helper class.
Next, we need to modify the Home Controller by removing some redundant code generated during the Bootstrap package installation. Make sure that the home controller looks like on the Listing 6 below.
|
1 2 3 4 5 6 7 8 9 10 11 12 13 |
using System.Web.Mvc; namespace BootstrapMvcSample.Controllers { public class HomeController : BootstrapBaseController { public ActionResult Index() { return View(); } } } |
Listing 6. Modified HomeController.cs file.
The last step is to edit the default Index View as follows (see Listing 7).
|
1 2 3 4 5 6 7 8 9 10 11 12 13 14 15 16 17 18 19 20 21 22 23 24 25 26 27 28 29 30 31 32 33 34 35 36 37 |
@using Reporting.Helpers @{ViewBag.Title = "Index";} <div class="container-fluid"> <div class="row-fluid"> <div class="span6"> <p class="lead">Common Retail<abbr title="key performance indicators">KPIs</abbr></p> @Html.LoadHtml("~/Content/html/CommonKPI.html") </div> <div class="span6"> <br /> <br /> <p class="lead">PLACEHOLDER</p> </div> </div> <div class="row-fluid"> <div class="span6"> <br /> <br /> <p class="lead">PLACEHOLDER</p> </div> <div class="span6"> <br /> <br /> <p class="lead">PLACEHOLDER</p> </div> </div> <div class="row-fluid"> <div class="span12"> <br /> <blockquote class="pull-right"> <p>Above all else show the data.</p> <small><cite title="Edward Tufte">The Visual Display of Quantitative Information</cite></small> </blockquote> </div> </div> </div> |
Listing 7. Index View code.
CSS classes ‘container-fluid’, ‘row-fluid’, ‘span6’, ‘lead’, ‘span12’, ‘pull-right’ that you can see inside the Index view are used by bootstrap.css to set up a fluid Bootstrap grid and to style the content. In this case, the grid contains two rows and two columns. The ‘span6’ CSS class specifies the grid column size. The default Bootstrap grid system utilizes 12 columns and span6 indicates that each of the columns uses 50% of the space. For more information, open this link.
Now return into R console and from the command prompt type source("CommonKPI.r"). This command reads and parses CommonKPI.r procedure, which is evaluated sequentially. As the result of the evaluation, the CommonKPI.html snippet is created and saved it in the ‘Content\html’ folder of the ASP.NET MVC Reporting project.
Return to Visual Studio and hit F5 key to see the first report as shown below.
Figure 6. First Report.
The icons next to the Growth values in the last column of the report are inserted by bootstrap.css. Type of the icon (thumbs-up or thumbs-down) is defined by the CSS class name inserted in every data set row by the Ch1_Core_KPIs_vw view (see Listing 2).
The Bootstrap icon files can be found in the ‘Content\images’ folder of the VS project. The library of these beautiful icons was developed by Glyphicons.com and available free because of an arrangement between Bootstrap and the Glyphicons. They are suitable for other UI elements such as toolbars, navigation bars and buttons.
Now let us add the second report that displays some retail transactional KPIs such as sales volume per transaction (TransValue), average price (AvgPrice), etc. The R procedure that extracts data from the database and transforms it for the reporting is shown below
|
1 2 3 4 5 6 7 8 9 10 11 12 13 14 15 16 17 18 19 20 21 |
library(R2HTML) ##suppressWarnings(getTransKPI); source('getTransKPI.r') transQty <- getTransKPI('TransValue','Ch1_TransQty_Base_vw') transCost <- getTransKPI('TransCost','Ch1_TransCost_Base_vw') transValue <- getTransKPI('TransAmount','Ch1_TransValue_Base_vw') avgCost <- getTransKPI('AvgCost','Ch1_AvgCost_Base_vw') avgPrice <- getTransKPI('AvgPrice','Ch1_AvgPrice_Base_vw') transGP <- getTransKPI('TransGP','Ch1_TransGP_Base_vw') transKPI <- rbind(transQty,transCost,transValue,avgCost,avgPrice,transGP) transKPI$Growth <- round(100*(transKPI$TYtd - transKPI$LYtd)/transKPI$LYtd,2) source('getIcon.r') iconImage <- getIcon(transKPI$Measure,transKPI$Growth) transKPI$Growth <- paste(as.character(transKPI$Growth), iconImage, sep='') wd <- getwd() htmldir <- paste(Sys.getenv("HOME"), "\\R Analytics\\R-2-ASP\\Reporting\\Content\\html\\", sep="") setwd(htmldir) filename <- 'transKPI.html' if(file.exists(filename)) file.remove(filename) HTML(transKPI, file = filename,nsmall=2,decimal.mark='.',row.names=FALSE,Border='0') setwd(wd) |
Listing 8. transKPI.r procedure.
The second statement of the above code loads the R function getTransKPI. Here is the definition of this function.
|
1 2 3 4 5 6 7 8 9 10 11 |
getTransKPI <- function(kpiName, query) { library(RODBC) cn<-odbcConnect('NW',uid='******',pwd='******') tmp <-t(sqlFetch(cn,query)) odbcClose(cn) tmp <- as.numeric(tmp[2,]) tmp$Measure<-kpiName tmp<-as.data.frame(tmp) colnames(tmp) <- c("LYtd","TYtd","Measure") return(tmp[c("Measure","TYtd","LYtd")]) } |
Listing 9. getTransKPI.r function.
This function requires two input parameters named kpiName and query. The second parameter is a name of an SQL Server view. For example when this function is executed first time in the third line of Listing 8, it takes Ch1_TransQty_Base_vw as a value of the second parameter. Here is the T-SQL code of that view.
|
1 2 3 4 5 6 7 8 |
SELECT TOP (100) PERCENT CASE WHEN YEAR(dbo.Orders.OrderDate) = 1997 THEN 'LYtd' ELSE 'TYtd' END AS Period, SUM(dbo.[Order Details].Quantity) / COUNT(DISTINCT dbo.[Order Details].OrderID) AS TransValue FROM dbo.[Order Details] INNER JOIN dbo.Orders ON dbo.[Order Details].OrderID = dbo.Orders.OrderID WHERE (dbo.Orders.OrderDate BETWEEN '19970101' AND '19970506') OR (dbo.Orders.OrderDate BETWEEN '19980101' AND '19980506') GROUP BY CASE WHEN YEAR(dbo.Orders.OrderDate) = 1997 THEN 'LYtd' ELSE 'TYtd' END ORDER BY Period |
Listing 10. Ch1_TransQty_Base_vw view.
This view as well as five others (see lines 5 to 9 in the Listing 8) returns only two rows. In this case (see Table 2), it is an average sales volume per transaction during this (TYtd) and the previous (LYtd) years.
This set of rows (a matrix to be precise) is pivoted (see the third line in the getTransKPI.r definition) using t() function, than values in the 2nd row are converted to numbers.
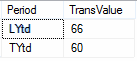
Table 2. Data set returned by the Ch1_TransQty_Base_vw view.
The remaining four lines of the code, including the return statement, perform some transformations and the matrix is converted into a data frame. Its columns are renamed, reshuffled and returned back to the calling procedure transKPI.r. Although it may not be clear what and how this function works, but as it contains only a few lines of code, I would recommend executing every line of the procedure sequentially in the R console. It will help understanding how the procedure works.
A construction of the views that are passed to getTransKPI.r function follows the same pattern, e.g. the Ch1_TransValue_Base_vw view calculates an average sales amount per transaction as (ROUND(SUM((1.0 - dbo.[Order Details].Discount) * dbo.[Order Details].UnitPrice * dbo.[Order Details].Quantity) / COUNT (DISTINCT dbo.[Order].OrderID),2).
The rbind() function combines six data frames generated with the help of getTransKPI function into one data frame transKPI. The next after rbind() call statement adds a new calculated column Growth.
To append an icon to each value in the Growth column transKPI.r loads another R function getIcon.r. Here is the definition of that function
|
1 2 3 4 5 6 7 8 9 |
getIcon <- function(measure, growth) { iconUp <- 'icon-thumbs-up' iconUp <- paste('% <i class=',iconUp,'></i>',sep='') iconDown <- 'icon-thumbs-down' iconDown <- paste('% <i class=',iconDown,'></i>',sep='') rhs <- substr(as.character(measure),regexpr('Cost',as.character(measure)),nchar(as.character(measure))) tmp <- ifelse('Cost' == rhs, ifelse(growth < 0, iconUp, iconDown), ifelse(growth < 0, iconDown, iconUp) ) return(tmp) } |
Listing 11. getIcon.r function.
This function is simply set to return an HTML mark-up containing CSS class that is used by bootstrap to add a thumbs-up or thumbs-down icons to the Growth values.
The name of the CSS class depends on the Growth value (second input parameter of the getIcon function) and the measure name – the first input parameter.
The remaining few lines of the transKPI procedure … (Listing 8)
- append thumbs-up / thumbs-down icons to the last column of the transKPI data frame,
- generate the transKPI.html snippet,
- write it into the Content\html folder, and
- restore the R console working directory
… to get ready for processing of the next report, but this is a subject of the following article.
Execute the transKPI.r procedure and return to the Visual Studio to make some minor change to the Index view shown below in bold.
|
1 2 3 4 5 6 7 8 9 10 11 12 13 14 15 16 17 18 19 20 21 22 23 24 25 26 27 28 29 30 31 32 33 34 35 36 37 38 39 40 41 42 43 44 |
@using Reporting.Helpers @{ ViewBag.Title = "Index"; } <div class="container-fluid"> <div class="row-fluid"> <div class="span6"> <p class="lead"> Common Retail <abbr title="key performance indicators">KPIs</abbr> </p> @Html.LoadHtml("~/Content/html/coreKPI.html") </div> <div class="span6"> <p class="lead"> Transactional Retail <abbr title="key performance indicators">KPIs</abbr> </p> @Html.LoadHtml("~/Content/html/transKPI.html") </div> </div> <div class="row-fluid"> <div class="span6"> <br /> <br /> <p class="lead">PLACEHOLDER</p> </div> <div class="span6"> <br /> <br /> <p class="lead">PLACEHOLDER</p> </div> </div> <div class="row-fluid"> <div class="span12"> <br /> <blockquote class="pull-right"> <p>Above all else show the data.</p> <small><cite title="Edward Tufte">The Visual Display of Quantitative Information</cite></small> </blockquote> </div> </div> </div> |
Listing 12. Index View code after addition of the second report.
Getting data extraction and transformation working
Now hit the F5 key to see the second report in top right corner of the page.
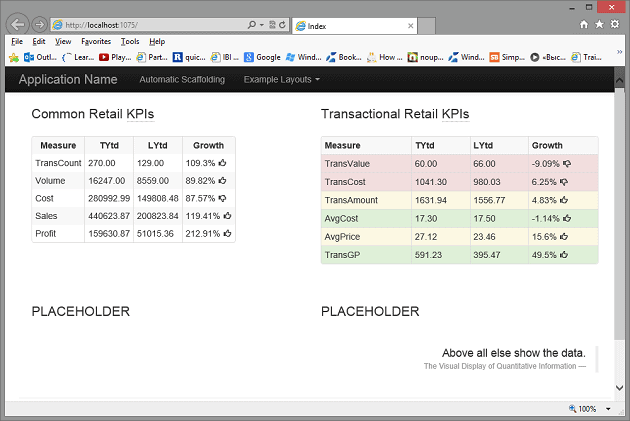
Figure 7. The Transactional Retail KPIs report was added to the first row.
You might have noticed a dotted line under abbreviation ‘KPIs’ in the report titles. This is the result of the enclosing those abbreviations between the <abbr title=”key performance indicators”>KPIs</abbr> tags. It enables the display of the title attribute value when the user hovers the mouse pointer over the abbreviation.
The CSS class ‘lead’ makes the report titles stand out and be consistent across the page without changing the font attributes. Three other CSS classes ‘error’, ‘warning’, and ‘successes were applied to the table row tag to enable conditional highlighting effect. I’ll leave you to find out the details of this implementation.
Read also: Using Dapper for lightweight data access
Summary
In this article, we looked at the integration of the R statistical framework and ASP.NET MVC 4 for developing web based business intelligence applications.
In the following articles, we introduce R visualization libraries that demonstrate the R power to “transform the data to most effectively support decision making” as well as touch upon changes to the presentation layer when the data source changes and passing parameters to R routines in batch execution mode to enable the application interactivity.
Below is a link to the source to the SQL script that recreates and populates the Product table with the added UnitCost field and updates the UnitCost field added to the Order Details table as well. In addition, There is a zipped-up copy of the altered NORTHWIND database that contains all the views. With it inside the zip file are detailed instruction how to attach the database.
Read also: Power BI as an alternative BI platform
FAQs: Creating a Business Intelligence Dashboard with R and ASP.NET – Part 1
1. How do you connect R to a SQL Server database for BI reporting?
R connects to SQL Server through the RODBC library. You install the RODBC package in R, configure an ODBC data source for your SQL Server instance, and then use the odbcConnect() and sqlQuery() functions to execute SQL queries and return results as R data frames. From there, you can apply R’s statistical and transformation functions before passing the processed data to your presentation layer.
2. Can you use R with ASP.NET to build web dashboards?
Yes. R handles the data extraction and statistical processing, outputting HTML fragments and chart images to a shared directory. ASP.NET MVC reads these outputs and renders them in a web page styled with Bootstrap. The R scripts can run on a schedule via batch files, keeping the dashboard data fresh without requiring R to run inside the web server process.
3. What are the advantages of using R over Power BI for custom dashboards?
R gives you full programmatic control over data transformations, statistical calculations, and visualization libraries that go beyond what Power BI offers out of the box. R is free and open source, supports hundreds of specialized statistical packages, and can be embedded into custom web applications. Power BI is better for rapid prototyping and self-service BI, while R is better when you need custom statistical analysis or integration with a bespoke web application.
This document contains proprietary information and is protected by copyright law.
Copyright © 2026 Red Gate Software Limited. All rights reserved
Load comments