


Monitoring and alerting can be overwhelming tasks, especially for those new to the world of managing production data. One common challenge for any data professional is the identification and management of queries that run for longer than they should.
Long-running queries pose immediate challenges as they can impact availability, performance, and even data security. Unexpected high-duration workloads can contribute to excessive IO, waits, locking, blocking, and other problems that can lead to application downtime.
This article dives into a variety of ways to identify, manage, and alert on long-running database queries for free using nothing more than T-SQL and some creativity!
The Importance of Monitoring Slow SQL Server Queries
It is a rite of passage for anyone responsible for a software application to chase down the “it is slow!” complaint. When users are forced to wait for long enough, they become frustrated and are quick to let everybody know that there’s a problem needing to be resolved as soon as possible.
When application performance problems are the direct result of problematic queries, it falls to a database professional to identify, diagnose, and fix those queries as efficiently as possible. If an organization doesn’t have a database professional, a software developer or operations specialist will need to fill that role.
Ideally, knowledge of a painful query would be delivered by an alert or automation, and not by an angry user. It would be beneficial to know when something is becoming slow, before it takes minutes to execute. Similarly, it would be advantageous to identify queries that are consuming excessive server resources before they ultimately crush their database servers.
This foresight is invaluable and provides many big benefits to developers, including:
- The ability to improve applications proactively
- Identifying bugs before they are reported by users
- Finding queries that are becoming less efficient over time
- Performance testing of new code
- Avoiding last-minute scrambling and panic
One of the biggest challenges in this process is that historical tools may not be of help here unless the query in question has both run previously and performed poorly. Query Store, for example, is a powerful tool for identifying performance issues quickly. It captures data in-memory, though, which is not flushed to storage immediately. Fifteen minutes is the default delay for Query Store, which is a good value for the feature, but not adequate for near-real-time reporting. Therefore, if an immediate response is required, we need tools that show what is happening live, right now!
Using Dynamic Management Views to Detect Long-Running Queries in SQL Server
System views are available in all editions of SQL Server that provide detailed information on what is running, who is running it, and how it is performing. The following is a brief summary of each view:
Sys.dm_exec_sessions: Returns one row per session on a SQL Server or Azure Managed Instance. The SESSION_ID (aka: spid) is the primary identifier for a session in SQL Server. If the session is not internal, then quite a bit of useful information is provided, such as the host name, program name, login name, and more.
Sys.dm_exec_requests: Returns one row per request in SQL Server or Azure Managed Instance. The SESSION_ID is provided to link it back to a session and its associated login. Information is provided, such as the command type, status, and wait type/wait time, if waits are occurring. Metrics such as CPU time and IO are also provided. The sql_handle can be used to link this to query detail.
Sys.dm_exec_connections: Returns a row per connection to this SQL Server or Azure Managed Instance. Included is information such as overall reads/writes, protocol, client IP address, and port. The SESSION_ID links it back to a login session.
Sys.dm_exec_sql_text: When provided with a sql_handle or plan_handle, this returns the text for a currently executing query.
There are more views available that can provide further details but, for the purposes of research, this is what most operators will want available to begin researching “the slow thing”.
How to View Currently Executing Queries in SQL Server
With the above views available, let’s combine them into something we can use to gather information on what is running on a server. To limit the output, a filter will be added to only return queries that have been executing for 5 seconds or longer:
|
1 2 3 4 5 6 7 8 9 10 11 12 13 14 15 16 17 18 19 20 |
SELECT dm_exec_sessions.[session_id], ISNULL(dm_exec_requests.total_elapsed_time / 1000, 0) AS QueryRuntimeSeconds, DB_NAME(dm_exec_requests.database_id) AS DatabaseName, ISNULL(dm_exec_sql_text.[text], '') AS FullQueryText, ISNULL(dm_exec_sessions.[program_name], '') AS ProgramName, dm_exec_sessions.login_name AS LoginName, ISNULL(dm_exec_sessions.[host_name], '') AS HostName, ISNULL(dm_exec_connections.client_net_address, '') AS IPAddress, dm_exec_requests.command AS CommandType FROM sys.dm_exec_sessions WITH (NOLOCK) INNER JOIN sys.dm_exec_requests WITH (NOLOCK) ON dm_exec_requests.session_id = dm_exec_sessions.session_id LEFT JOIN sys.dm_exec_connections WITH (NOLOCK) ON dm_exec_connections.connection_id = dm_exec_requests.connection_id CROSS APPLY sys.dm_exec_sql_text(dm_exec_requests.sql_handle) WHERE dm_exec_requests.total_elapsed_time / 1000 >= 5 -- Seconds ORDER BY dm_exec_requests.total_elapsed_time ASC; |
This is kept intentionally simple. More views, columns, and metrics can be easily added later, when needed. Before executing this, I am going to run an intentionally bad-written query. Once my local server has been beaten up for a bit, the diagnostic query from above returns the following row of information:

This is enough to indicate that the problem query originates from SQL Server Management Studio and is being run by the login epollack (that’s me!). It is a SELECT query against WideWorldImporters and the SQL text, when copy/pasted, is a total disaster:
|
1 2 3 4 5 6 7 8 9 10 11 12 13 14 15 16 17 18 |
SELECT * FROM Sales.Invoices LEFT JOIN Sales.InvoiceLines ON InvoiceLines.InvoiceID = Invoices.InvoiceID LEFT JOIN Warehouse.StockItems ON StockItems.StockItemID = InvoiceLines.StockItemID WHERE ( Invoices.DeliveryInstructions LIKE '%Shop 258%' OR ( LEN(Invoices.CustomerPurchaseOrderNumber) = 5 AND LEN(Invoices.CustomerPurchaseOrderNumber) IS NOT NULL AND Invoices.IsCreditNote = 0 AND Invoices.InvoiceDate >= '1/1/2014') OR ( JSON_VALUE(Invoices.ReturnedDeliveryData, '$.Events[1].DriverID') = 7 AND Invoices.ReturnedDeliveryData IS NOT NULL)) OR ( InvoiceLines.[Description] LIKE '%Developer joke mug%' AND StockItems.StockItemName LIKE '%DBA joke mug - mind if I join you%'); |
Yuck! With this level of knowledge, we can inform the correct teams/people about the bad query or, if needed, we can take direct actions to resolve it. If the query is disruptive and needs to be stopped immediately, the session can be killed:
|
1 |
KILL 73; |
Use caution when killing sessions as doing so immediately cancels a query and rolls it back. If the query originates from an application user, the result will be an error of some sort. In addition, if a query has modified significant amounts of data before it is killed, the rollback process may also take a long time.
As a general rule of thumb, allow at least as much time for the rollback as the query has run thus far prior to being killed. The Accelerated Database Recovery feature greatly reduces rollback time if enabled on the target database. Restarting SQL Server or taking other drastic actions to “get rid” of a query in the rollback status will only make matters worse. Click here for more information on the KILL command and the implications of using it.
This is a great start – but at the same time, our work has consisted of manual queries that were run after a user complained that things were slow. This will be perfect for some scenarios, but automation can improve things significantly. To make this better, a process can be created that runs periodically and checks if any long-running queries are executing and, if so, it alerts on them.
How to Automate Long-Running Query Detection for SQL Server
With a query in hand that provides exactly the data that is needed, running it and collecting the results can be automated. A key to this process is to perform it in steps:
- Perform a lightweight check to see if there are any long-running queries.
- Only if there are queries to report on should further action be taken.
- Report on problematic queries, if any exist
Query text and other string metrics can get big, so collecting them should be avoided until necessary. It is important to obey the #1 rule of all monitoring processes, that they should not create disruptions for the applications they support. Consider it the Hippocratic Oath for Monitoring: First Do No Harm! The following query checks the system views for any queries that exceed 5 seconds:
|
1 2 3 4 5 6 7 |
SELECT COUNT(*) FROM sys.dm_exec_sessions WITH (NOLOCK) INNER JOIN sys.dm_exec_requests WITH (NOLOCK) ON dm_exec_requests.session_id = dm_exec_sessions.session_id CROSS APPLY sys.dm_exec_sql_text(dm_exec_requests.sql_handle) WHERE dm_exec_requests.total_elapsed_time / 1000 >= 5; |
The view sys.dm_exec_sql_text is included solely to filter out any long-running processes that do not include SQL text. Without this, quite a few sleeping sessions will be returned, which are not indicative of a query-induced problem. If this count is zero, then there is nothing to report, otherwise, we can proceed to pull information about the query and use it for alerting purposes. This count can be checked as often as is needed to verify whether long-running queries are running or not.
Once the count for that check is greater than zero, we can gather information about the query so that its source and cause are immediately pinpointed. For this example, only the first and longest-running query will be reported on. This keeps the process lightweight and guards against a flood of blocking that results in tens or hundreds of rows returned. Feel free to adjust the TOP to return more if more are needed:
|
1 2 3 4 5 6 7 8 9 10 11 12 13 14 15 16 17 18 19 20 21 |
SELECT TOP 1 dm_exec_sessions.[session_id] AS SessionId, ISNULL(dm_exec_requests.total_elapsed_time / 1000 , 0) AS QueryRuntimeSeconds, DB_NAME(dm_exec_requests.database_id) AS TriggeringDatabaseName, ISNULL(dm_exec_sql_text.[text], '') AS FullQueryText, ISNULL(dm_exec_sessions.[program_name], '') AS TriggeringProgramName, dm_exec_sessions.login_name AS TriggeringLoginName, ISNULL(dm_exec_sessions.[host_name], '') AS TriggeringHostName, ISNULL(dm_exec_connections.client_net_address, '') AS TriggeringIPAddress, dm_exec_requests.command AS TriggeringCommandType FROM sys.dm_exec_sessions WITH (NOLOCK) INNER JOIN sys.dm_exec_requests WITH (NOLOCK) ON dm_exec_requests.session_id = dm_exec_sessions.session_id LEFT JOIN sys.dm_exec_connections WITH (NOLOCK) ON dm_exec_connections.connection_id = dm_exec_requests.connection_id CROSS APPLY sys.dm_exec_sql_text(dm_exec_requests.sql_handle) WHERE dm_exec_requests.total_elapsed_time / 1000 >= 5 ORDER BY dm_exec_requests.total_elapsed_time ASC; |
This returns a single row with similar information to what was reviewed earlier in this article:

The next step is to do something with this information. The data can be sent to an external application via text/email, or stored in a table for use by other apps, such as a monitoring/alerting tool.
Future-proof database monitoring with Redgate Monitor
The easiest way to do this is to store each of the captured values in a scalar variable and create a message body using them. The following modified code accomplishes this:
|
1 2 3 4 5 6 7 8 9 10 11 12 13 14 15 16 17 18 19 20 21 22 23 24 25 26 27 28 29 |
DECLARE @SessionId INT; DECLARE @QueryRuntimeSeconds INT; DECLARE @TriggeringDatabaseName VARCHAR(100); DECLARE @FullQueryText VARCHAR(MAX); DECLARE @TriggeringProgramName VARCHAR(100); DECLARE @TriggeringLoginName VARCHAR(100); DECLARE @TriggeringHostName VARCHAR(100); DECLARE @TriggeringIPAddress VARCHAR(100); DECLARE @TriggeringCommandType VARCHAR(32); SELECT TOP 1 @SessionId = dm_exec_sessions.[session_id], @QueryRuntimeSeconds = ISNULL(dm_exec_requests.total_elapsed_time / 1000, 0), @TriggeringDatabaseName = DB_NAME(dm_exec_requests.database_id), @FullQueryText = ISNULL(dm_exec_sql_text.[text], ''), @TriggeringProgramName = ISNULL(dm_exec_sessions.[program_name], ''), @TriggeringLoginName = dm_exec_sessions.login_name, @TriggeringHostName = ISNULL(dm_exec_sessions.[host_name], ''), @TriggeringIPAddress = ISNULL(dm_exec_connections.client_net_address, ''), @TriggeringCommandType = dm_exec_requests.command FROM sys.dm_exec_sessions WITH (NOLOCK) INNER JOIN sys.dm_exec_requests WITH (NOLOCK) ON dm_exec_requests.session_id = dm_exec_sessions.session_id LEFT JOIN sys.dm_exec_connections WITH (NOLOCK) ON dm_exec_connections.connection_id = dm_exec_requests.connection_id CROSS APPLY sys.dm_exec_sql_text(dm_exec_requests.sql_handle) WHERE dm_exec_requests.total_elapsed_time / 1000 >= 5 ORDER BY dm_exec_requests.total_elapsed_time ASC; |
From here, an email can be generated and sent to whomever needs to know about the slow query:
|
1 2 3 4 5 6 7 8 9 10 11 12 13 14 15 16 17 18 19 20 21 22 23 24 |
DECLARE @ServerName VARCHAR(100) = @@SERVERNAME; DECLARE @ProfileName VARCHAR(MAX) = 'Default'; DECLARE @EmailAddressList VARCHAR(MAX) = 'ed@somedomain.com'; DECLARE @EmailSubject VARCHAR(MAX)= 'Long Running Query Alert on ' + @ServerName; DECLARE @EmailBody VARCHAR(MAX); SELECT @EmailBody = '<html><body>The following long-running query was identified:<P> Database Server: ' + ISNULL(@@SERVERNAME, CAST(SERVERPROPERTY('ServerName') AS VARCHAR(MAX))) + '<BR> Query Runtime (Minutes): ' + CAST(@QueryRuntimeSeconds AS VARCHAR(MAX)) + '<BR> Session Id: ' + CAST(@SessionId AS VARCHAR(MAX)) + '<BR> Database Name: ' + @TriggeringDatabaseName + '<BR> Program Name: ' + @TriggeringProgramName + '<BR> Login Name: ' + @TriggeringLoginName + '<BR> Host Name: ' + @TriggeringHostName + '<BR> IP Address: ' + @TriggeringIPAddress + '<BR> Command Type: ' + @TriggeringCommandType + '<BR> Full Query Text: ' + @FullQueryText + '</body></html>'; EXEC msdb.dbo.sp_send_dbmail @profile_name = @ProfileName, @recipients = @EmailAddressList, @subject = @EmailSubject, @body_format = 'html', @body = @EmailBody; |
This creates a basic HTML email and sends it out based on the parameters provided using Database Mail. If you do not use SQL Server Database Mail, any other connected service can be used in its place. The following is what the resulting HTML would look like:
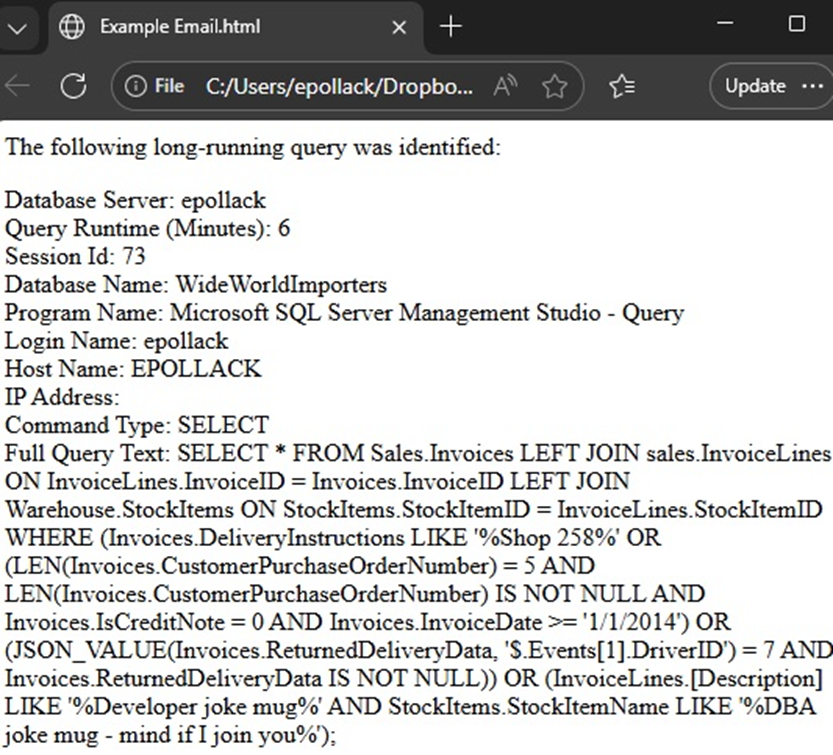
The HTML can be customized to your heart’s content, adding tables, colors, or other styles to make it either prettier or more functional. It can also be plain text, if preferred. The information provided is enough to be able to hunt down the offending query and begin troubleshooting it.
So far, the execution plan for the offending query was omitted as it can potentially get large. Adding it in is easy enough by adding one more variable, join, and assignment to the query from earlier:
|
1 2 3 4 5 6 7 8 9 10 11 12 13 14 15 16 17 18 19 20 21 22 23 |
DECLARE @ExecutionPlan VARCHAR(MAX); SELECT TOP 1 @SessionId = dm_exec_sessions.[session_id], @QueryRuntimeSeconds = ISNULL(dm_exec_requests.total_elapsed_time / 1000, 0), @TriggeringDatabaseName = DB_NAME(dm_exec_requests.database_id), @FullQueryText = ISNULL(dm_exec_sql_text.[text], ''), @TriggeringProgramName = ISNULL(dm_exec_sessions.[program_name], ''), @TriggeringLoginName = dm_exec_sessions.login_name, @TriggeringHostName = ISNULL(dm_exec_sessions.[host_name], ''), @TriggeringIPAddress = ISNULL(dm_exec_connections.client_net_address, ''), @TriggeringCommandType = dm_exec_requests.command , @ExecutionPlan = dm_exec_query_plan.query_plan FROM sys.dm_exec_sessions WITH (NOLOCK) INNER JOIN sys.dm_exec_requests WITH (NOLOCK) ON dm_exec_requests.session_id = dm_exec_sessions.session_id LEFT JOIN sys.dm_exec_connections WITH (NOLOCK) ON dm_exec_connections.connection_id = dm_exec_requests.connection_id CROSS APPLY sys.dm_exec_sql_text(dm_exec_requests.sql_handle) CROSS APPLY sys.dm_exec_query_plan(dm_exec_requests.plan_handle) WHERE dm_exec_requests.total_elapsed_time / 1000 >= 5 ORDER BY dm_exec_requests.total_elapsed_time ASC; |
The execution plan itself is XML, so it will not look very readable as-is:
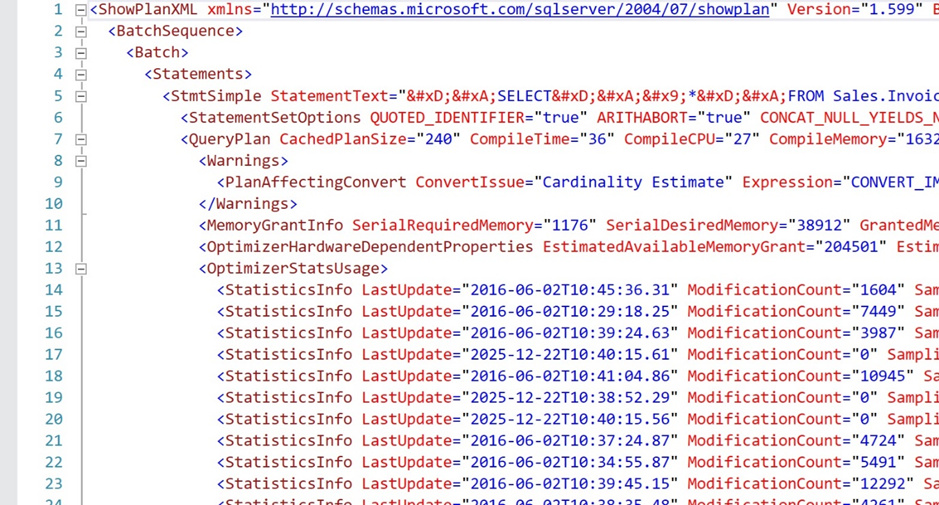
Despite that, the XML text can be stored alongside the other query-related data and viewed when ready, if needed. This sample XML is 972 lines long, so a graphical solution is ideal for analyzing it. Consider the ever-useful (and free) SQL Sentry Plan Explorer for this task:
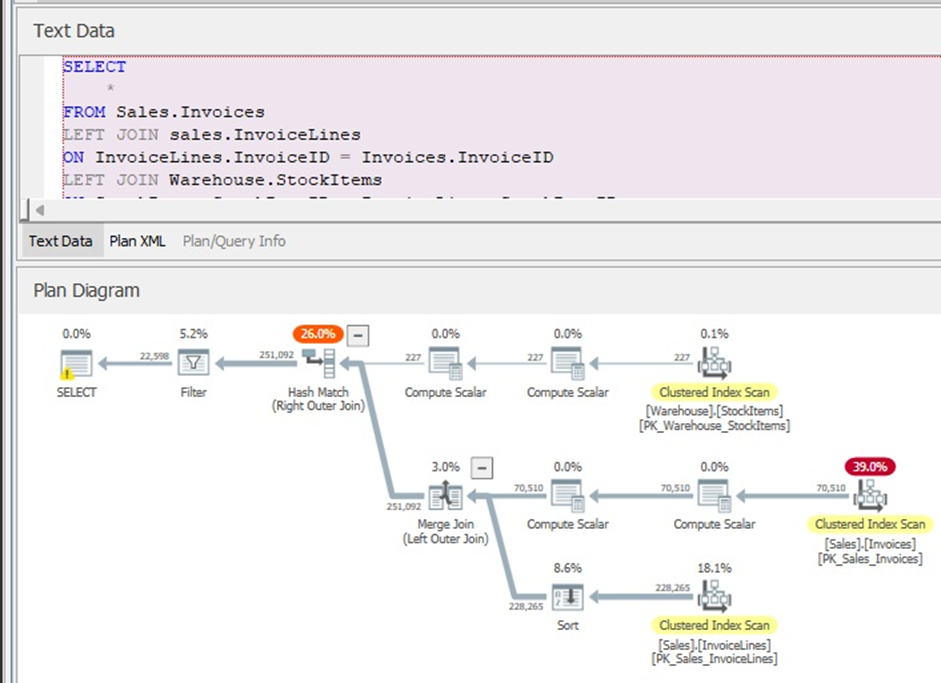
SSMS provides graphical representations for execution plans as well, but this is a tool I always recommend as it adds quite a bit of utility to make plans easier to view. This is especially important when a query (and its plan) become BIG.
The Best Way to Monitor SQL Server Query Performance
The ultimate solution here is a script that is executed often and checks for the count of queries whose runtime exceeds a given threshold. This may be executed by a SQL Server Agent job, a PowerShell task, or any other automation tool that is readily available.
Here is a simple version of a stored procedure that does exactly this, and nothing more. A barebones process is fast, lightweight, and easily adaptable to your specific database environment and its needs:
|
1 2 3 4 5 6 7 8 9 10 11 12 13 14 15 16 17 18 19 20 21 22 23 24 25 26 27 28 29 30 31 32 33 34 35 36 37 38 39 40 41 42 43 44 45 46 47 48 49 50 51 52 53 54 55 56 57 58 59 60 61 62 63 64 65 66 67 68 69 70 71 72 73 74 75 76 77 78 79 80 |
USE WideWorldImporters; GO CREATE OR ALTER PROCEDURE dbo.LongRunningQueryManagement @RunTimeSeconds INT = 5, @ProfileName VARCHAR(MAX), @EmailAddressList VARCHAR(MAX) AS BEGIN SET NOCOUNT ON; DECLARE @ServerName VARCHAR(100) = @@SERVERNAME; DECLARE @LongRunningQueryCount INT; SELECT @LongRunningQueryCount = COUNT(*) FROM sys.dm_exec_sessions WITH (NOLOCK) INNER JOIN sys.dm_exec_requests WITH (NOLOCK) ON dm_exec_requests.session_id = dm_exec_sessions.session_id CROSS APPLY sys.dm_exec_sql_text(dm_exec_requests.sql_handle) WHERE dm_exec_requests.total_elapsed_time / 1000 >= @RunTimeSeconds; IF @LongRunningQueryCount > 0 BEGIN DECLARE @SessionId INT; DECLARE @QueryRuntimeSeconds INT; DECLARE @TriggeringDatabaseName VARCHAR(MAX); DECLARE @FullQueryText VARCHAR(MAX); DECLARE @TriggeringProgramName VARCHAR(MAX); DECLARE @TriggeringLoginName VARCHAR(MAX); DECLARE @TriggeringHostName VARCHAR(MAX); DECLARE @TriggeringIPAddress VARCHAR(MAX); DECLARE @TriggeringCommandType VARCHAR(MAX); SELECT TOP 1 @SessionId = dm_exec_sessions.[session_id], @QueryRuntimeSeconds = ISNULL(dm_exec_requests.total_elapsed_time / 1000, 0), @TriggeringDatabaseName = DB_NAME(dm_exec_requests.database_id), @FullQueryText = ISNULL(dm_exec_sql_text.[text], ''), @TriggeringProgramName = ISNULL(dm_exec_sessions.[program_name], ''), @TriggeringLoginName = dm_exec_sessions.login_name, @TriggeringHostName = ISNULL(dm_exec_sessions.[host_name], ''), @TriggeringIPAddress = ISNULL(dm_exec_connections.client_net_address, ''), @TriggeringCommandType = dm_exec_requests.command FROM sys.dm_exec_sessions WITH (NOLOCK) INNER JOIN sys.dm_exec_requests WITH (NOLOCK) ON dm_exec_requests.session_id = dm_exec_sessions.session_id LEFT JOIN sys.dm_exec_connections WITH (NOLOCK) ON dm_exec_connections.connection_id = dm_exec_requests.connection_id CROSS APPLY sys.dm_exec_sql_text(dm_exec_requests.sql_handle) WHERE dm_exec_requests.total_elapsed_time / 1000 >= 5 ORDER BY dm_exec_requests.total_elapsed_time ASC; DECLARE @EmailSubject VARCHAR(MAX)= 'Long Running Query Alert on ' + @ServerName; DECLARE @EmailBody VARCHAR(MAX); SELECT @EmailBody = '<html><body>The following long-running query was identified:<P> Database Server: ' + @ServerName + '<BR> Query Runtime (Minutes): ' + CAST(@QueryRuntimeSeconds AS VARCHAR(MAX)) + '<BR> Session Id: ' + CAST(@SessionId AS VARCHAR(MAX)) + '<BR> Database Name: ' + @TriggeringDatabaseName + '<BR> Program Name: ' + @TriggeringProgramName + '<BR> Login Name: ' + @TriggeringLoginName + '<BR> Host Name: ' + @TriggeringHostName + '<BR> IP Address: ' + @TriggeringIPAddress + '<BR> Command Type: ' + @TriggeringCommandType + '<BR> Full Query Text: ' + @FullQueryText + '</body></html>'; EXEC msdb.dbo.sp_send_dbmail @profile_name = @ProfileName, @recipients = @EmailAddressList, @subject = @EmailSubject, @body_format = 'html', @body = @EmailBody; END END GO -- Sample Execution EXEC dbo.LongRunningQueryManagement @RunTimeSeconds = 5, @ProfileName = 'DefaultMailProfile', @EmailAddressList = 'epollack@transfinder.com'; GO |
In addition, be sure to adjust details in the code that will differ for each environment, such as the email address to send to, the mail profile, and the latency to alert on.
It is likely that this code would be targeted at a specific application, program, database, or SQL text. Parameters can easily be added to ensure that no noise is returned. In an optimal monitoring/alerting application, an alert would never be received unless there was a problem that required attention. While perfection can be hard to achieve with that goal, we should strive to meet it the best we can. Too many false positives or extraneous alerts will result in people simply ignoring the system altogether, rendering it ineffective.
Customizing the Monitoring Process
Any process like this can be customized extensively, with tactics such as:
- Adding more columns to the result set, such as the execution plan or resource consumption.
- Adding filters to remove results that are of no interest, such as backups and other existing jobs/tasks that are expected to be slow.
- Adjust number of results returned.
- Create permanent tables to store the results for posterity or for further review.
- Automatically kill specific types of queries after a set amount of runtime has elapsed.
- Adjust the definition of a slow query.
- A whole lot more!
If the attached code does not meet your needs, then adjust it to handle those scenarios. Need more data? Add it! Need to filter? Go for it! There are absolutely no rules here and every database server and application will have its own workload patterns that dictate what you most care about and need to see.
Long-Running Queries are Not Always the Cause of SQL Server Performance Problems
It is important to remind ourselves that the “Big Bad” query is not always the cause of a database performance problem. Sometimes it is a simple query that spams a server thousands of times a second. Other times it is an operating system issue. Or a resource issue. Or something else.
Therefore, be sure to fully investigate performance challenges and do not complete the detective work the moment that long-running queries have been ruled out as the cause.
I cannot count the number of times in my career that a performance problem was the result of a fast query than ran millions of times per day and evaded the typical searches for high IO, high CPU, or long waits. It’s a big number, that’s all 😊
Monitoring SQL Server Query Performance: Conclusion & Next Steps
The ability to automatically alert on queries that exceed a minimum runtime threshold allows early communication to be made of potential performance problems. All of the tools needed to do this are free and included in any edition of SQL Server.
Using the basic processes and guidance from this article, you can implement your own alerting process and use it to improve SQL query alerting! Customization allows for a wide variety of applications that can detect anything from rogue users to long-running report queries, to developers running destructive queries from SQL Server Management Studio.
Feel free to share this code, and if you come up with any innovative features for it, please let me know!
Frequently Asked Questions: SQL Server Long-Running Query Detection
1. What is a long-running query in SQL Server?
A long-running query is any SQL Server query whose execution time exceeds an acceptable threshold for your workload, often causing blocking, high CPU usage, or degraded performance.
2. How can I detect long-running queries in SQL Server?
You can detect long-running queries by querying dynamic management views such as sys.dm_exec_requests and sys.dm_exec_sessions, which expose real-time execution details.
3. Which DMV shows currently executing queries in SQL Server?
The sys.dm_exec_requests DMV returns information about queries currently executing in SQL Server, including start time, wait type, and resource usage.
4. Does Query Store capture long-running SQL Server queries?
Query Store captures historical execution data but does not reliably detect or alert on long-running queries in real time, making DMVs more suitable for live monitoring.
5. Can I automate alerts for long-running SQL Server queries?
Yes. You can automate detection using scheduled T-SQL scripts, SQL Agent jobs, or SQL Server monitoring tools like Redgate Monitor that trigger alerts when execution thresholds are exceeded.
This document contains proprietary information and is protected by copyright law.
Copyright © 2026 Red Gate Software Limited. All rights reserved


Load comments