
The series so far:
- Introduction to DAX for paginated reports
- How to filter DAX for paginated reports
- DAX table functions for paginated reports: Part 1
- DAX table functions for paginated reports: Part 2
- Tips and tricks with DAX table functions in paginated reports
SQL Server Reporting Services (SSRS) may have been around for nearly 20 years, but it simply refuses to go away. Its latest lease of life is evidenced in the release of the Paginated Report visual for Power BI that allows developers to include paginated reports inside Power BI dashboards. In many ways, this is a natural extension of the existing ability of the Power BI Premium Service to load and display paginated reports – and of course, the well-established use of SSRS as the reporting tool of choice to visualise information held in tabular SQL Server Analysis Services data warehouses.
However, if you are a traditional SSRS report developer, who is in the habit of using SQL as the query language for your reports, then using DAX to query source data can be initially disconcerting. Equally, the DAX that you use to extract data for reports can be very different from the DAX that you may be used to writing when creating Power BI dashboards (or even extending Excel Pivot tables).
The aim of this article – and the three that follow – is to help you overcome any initial challenges when sourcing data for paginated reports from a Power BI dataset. This includes a series of suggestions to make your life easier when delivering paginated reports – whether as a separate report or as a visual inside a Power BI dashboard with Power BI Premium (which includes Premium per user).
What I am not attempting to do is to provide either an introduction to paginated report development or to DAX. I am presuming that you have a grasp of the fundamentals of each of these and that your objective is to adapt your existing knowledge to use DAX as the source of data for paginated reports. This means that I will not explain how to create Power BI dashboards, load datasets into the Power BI Service, create dataflows, or write DAX measures – or indeed any of the “classic” Power BI techniques.
Within the scope of these objectives, it is time to move on to an initial overview of how to create paginated reports using DAX.
The paginated report developer’s toolkit
Creating and perfecting paginated reports for Power BI requires a very simple set of tools. The good news is that all of them are completely free. The bad news is that paginated reports are only available in a Premium or Premium per user workspace.
The core tool used to create the paginated reports that you will subsequently upload to the Power BI Service is Power BI Report Builder. I suggest this as the report development tool simply because:
- It is free, quick to install, and has no licensing hassles
- It connects automatically to Power BI datasets in the Power BI Service
To write and debug DAX, I strongly advise that you download and install the brilliant and irreplaceable DAX Studio.
Finally, an advanced text editor such as Notepad++ is invaluable for some of the more advanced tweaking of the .Rdl files that you create using Power BI Report Builder.
Sample data
To allow you to concentrate on DAX, and not waste time setting up a complex environment, the accompanying sample data for these articles is a single Power BI Desktop file. This file (CarsDataWarehouse.pbix) contains one fact table and four dimensions. You can see the star schema of the data in the following image:
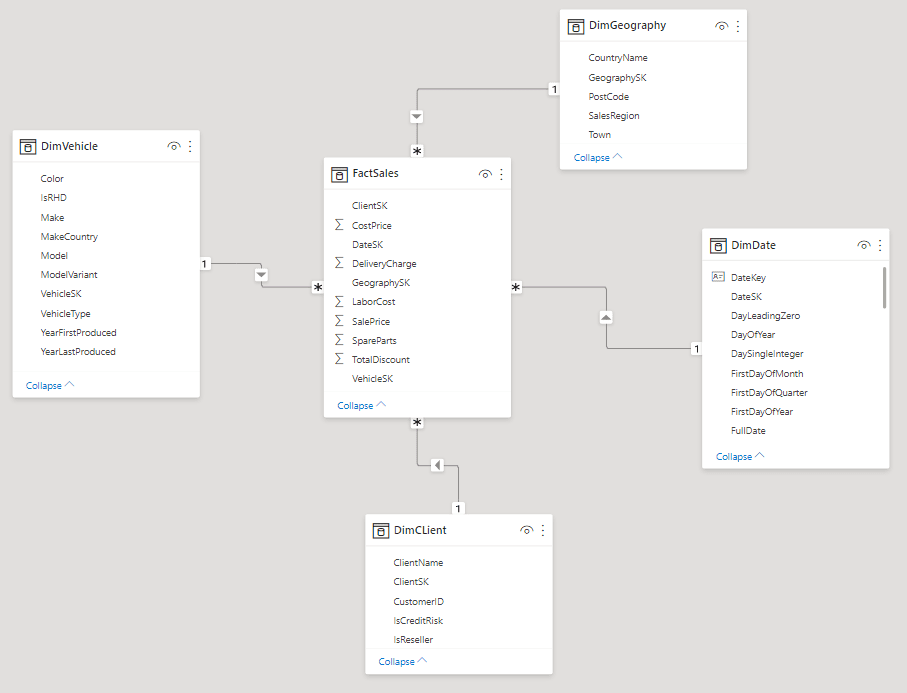
This dataset is deliberately lightweight and contains only a few hundred records to ensure that you spend as little time as possible waiting on query execution when you run your own DAX queries.
Power BI Dashboard and report integration
If you wish to follow the examples in these articles, you will need to imitate a real-world Power BI environment. I will presume that you have access to a Power BI Premium environment and have the rights to upload both .Pbix and .Rdl files. The unfortunate limitation at present is that you cannot perfect your paginated report integration skills if all you have is a free Power BI account. To get started, upload the CarsDataWarehouse.pbix file to Power BI Service.
Building paginated reports using Power BI datasets
To ensure that the prerequisites are in place, here is how you can connect to an existing Power BI dataset in the Power BI Service from Power BI Report Builder. This dataset can be as simple as a version of the sample dashboard CarsDataWarehouse.Pbix that you have previously uploaded.
- Open Power BI Report Builder.
- Create a Blank Report
- Right-click Data Sources and select Add Power BI Dataset connection.
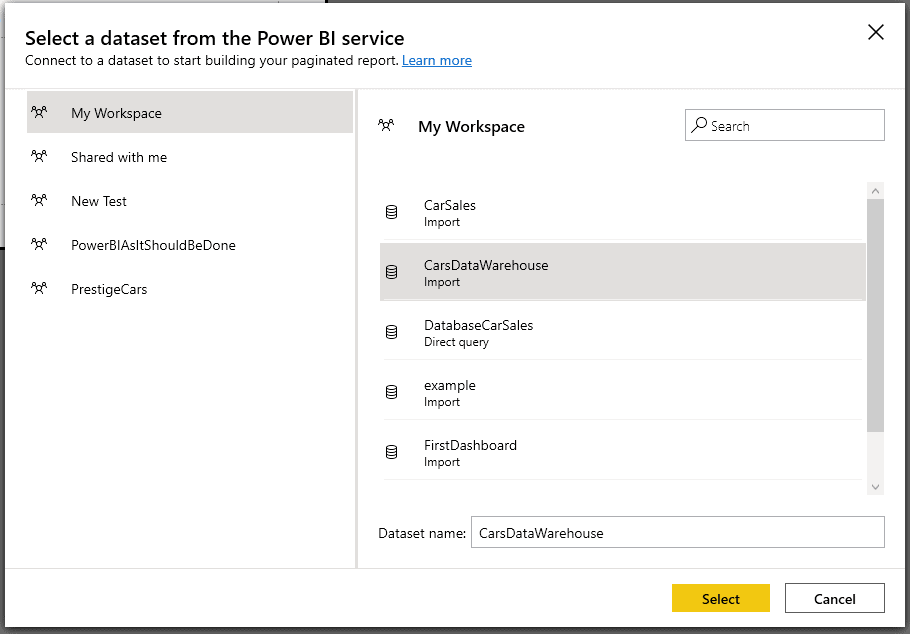
- Select the dataset in the dialog as shown below and click Select.
You can now build SSRS reports that will use the data in the Power BI Service using DAX as the query language.
Automated query writing
If the data you need is extremely simple (a list without parameters and no filtering), then you can have Power BI Report Builder write the DAX for you, like this:
- Right-click on Datasets and click Add Dataset.
- Select the CarsDataWarehouse data source.
- In the Dataset Properties dialog, click on the Query Designer button.
- Drag the Attributes and measures you wish to include in the report dataset into the lower right-hand pane.
- Test the query by clicking Click to execute the query.
- Click OK. You will see the resulting, automatically-generated DAX query in the Query area as shown below:
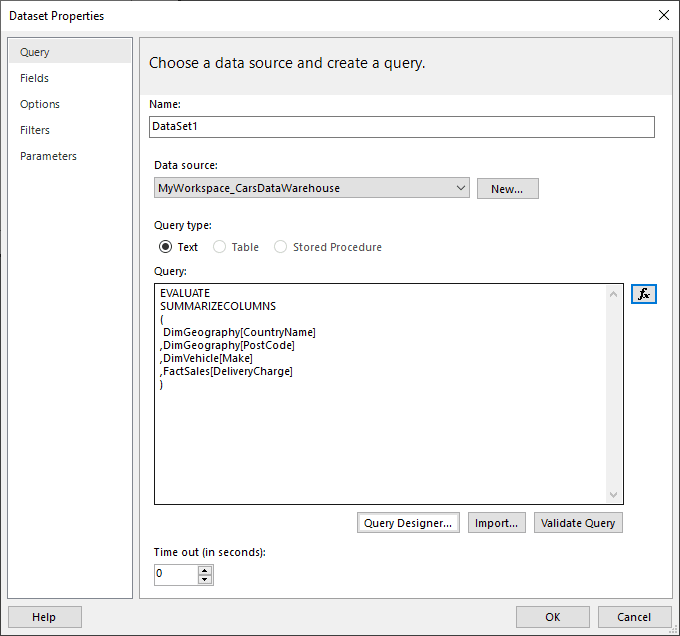
- Click OK to create the dataset.
As you can see, this is very simple and very easy. However, I would never suggest that you build any but the simplest of output datasets in this way. The reasons for avoiding this approach are:
- It only works for simple lists.
- It creates excessively complex DAX that is hard to understand and modify when you add parameters and filters.
- It has an annoying tendency to crash for complex queries
- Using the Query Designer automatically overwrites any existing query – even carefully hand-crafted DAX queries – which rapidly becomes extremely frustrating.
Consequently, I advise avoiding the query designer as far as possible and using DAX Studio to write – and perfect – the DAX that you use to drive your paginated reports.
Uploading paginated reports to the Power BI Service
One of the advantages of using Power BI Report Builder to create .RDL files, is that it imitates Power BI Desktop in that it can connect to the Power BI Service and update the current file in a couple of clicks. Simply click the Publish button in the Home menu and choose the destination workspace for the current paginated report file. Of course, you will have to log in to the Power BI Premium service (just as you would when developing dashboards using Power BI Desktop) first.
Alternatively, you can log in to Power BI and upload an .Rdl file to the Power BI Service just as you would upload a .pbix file.
Alternatives to the Query Designer
If the Query Designer inside Power BI Report Builder is best avoided, what is the alternative? Quite simply, the most efficient alternative that I can suggest is:
- Build and test DAX queries using DAX Studio.
- Copy the query into Power BI Report Builder like this:
- Right-click on Datasets and click Add Dataset.
- Click on the Expression Editor (Fx) button to the right of the Query area.
- Paste the DAX query (from DAX Studio) into the Expression Editor, as shown in the following figure:
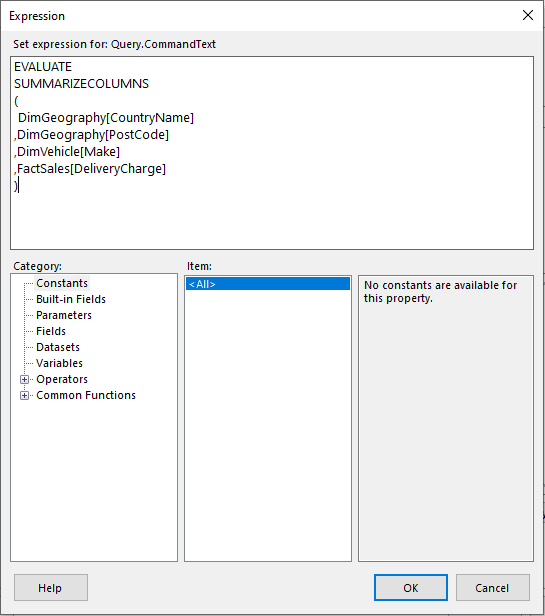
- Click OK twice.
This approach has multiple advantages. Amongst the main ones are:
- You can build, test and debug DAX in an IDE designed specifically for DAX development – including searching for attributes in the dataset and drag and drop, search and replace, etc.
- DAX Studio provides comprehensible error messages if anything does not work quite as expected.
- Coding errors are less likely which is particularly important as many DAX errors cause the Power BI Report Builder either to hang or to crash.
- You can preview the output data.
- You can develop complex DAX that is simply not practical to write in the notepad-style editor of Power BI Report Builder.
SSRS parameters in DAX
Of course, you are inevitably going to need to filter the data when it comes to returning data from a Power BI dataset to a paginated report. SSRS has handled user parameters from its outset as a data filtering technique and can, of course, handle parameter passing to DAX-based Power BI data sources.
Creating DAX-driven parameters
The first thing to do is to populate SSRS parameters from the underlying dataset using DAX. The basic principles concerning populating DAX parameters are very similar to those that you may be used to applying when using SSRS with SQL or MDX as the query languages:
- Create one DataSet in the paginated report for each SSRS parameter that you need to populate.
- Create another separate dataset if you are pre-selecting multiple default items from a parameter list automatically.
Populating the parameter list
The DAX that you use to query a Power BI dataset to return a list of parameter elements is straightforward. It is nearly always something like the following:
|
1 2 3 4 5 |
EVALUATE SUMMARIZECOLUMNS ( DimGeography[CountryName] ) |
It is worth noting that:
- You do not need to specify a distinct list as
SUMMARIZECOLUMNS()does this for you automatically. - Remember that the parameter values are case-sensitive if you enter one or more values manually in the list of default values. You then use this dataset as the source for the available values in the parameter list by selecting Get values from a query as the Available Values setting in the parameter properties.
Date-based parameters
If you are setting a start date (for instance) as the default value for a parameter, the minimum date value from a field in a dataset can be calculated using a DAX query that applied the FIRSTDATE() function like this:
|
1 |
EVALUATE FIRSTDATE(VALUES(DimDate[DateKey])) |
Conversely, that last date in a field can be queried using the LASTDATE() function – something like this
|
1 |
EVALUATE LASTDATE(VALUES(DimDate[DateKey])) |
Applying parameters in paginated reports
Once you have created one or more parameters in a paginated report, you will, of course, need to apply them to the DAX that you are creating to return data to the report. As you just saw, external parameters in DAX are simply variables that start with the @ sign. As you might expect, the art is to apply these variables inside the filters so that the resulting data conforms to your requirements.
Simple parameter passing
To start at the beginning, let’s take a (very) simple output using a single filter that does not yet use a parameter – like this:
|
1 2 3 4 5 6 7 8 |
EVALUATE SUMMARIZECOLUMNS( DimCLient[ClientName] ,DimVehicle[Make] ,DimVehicle[Model] ,FILTER(VALUES(DimVehicle[Color]), DimVehicle[Color] = "Red") ,"Sales", SUM(FactSales[SalePrice]) ) |
The shortened output from this short piece of DAX is:
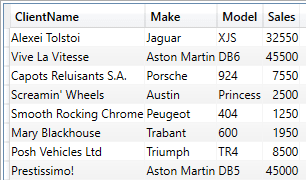
Assuming that you have created an SSRS parameter that contains a list of colours, and that the name of this parameter is @Colour, the previous DAX snippet, tweaked to enable parameter passing into the DAX, becomes:
|
1 2 3 4 5 6 7 8 |
EVALUATE SUMMARIZECOLUMNS( DimCLient[ClientName] ,DimVehicle[Make] ,DimVehicle[Model] ,FILTER(VALUES(DimVehicle[Color]), DimVehicle[Color] = @Colour) ,"Sales", SUM(FactSales[SalePrice]) ) |
This also introduces the use of external parameters in DAX. As you can see, they are extremely simple. An external parameter:
- Starts with
@ - Does not contain spaces
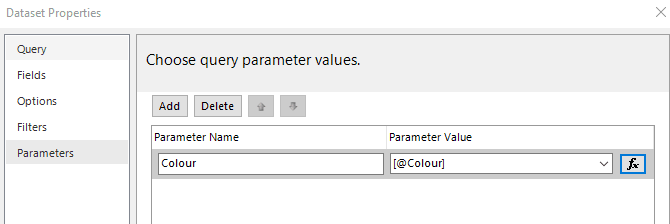
When creating a dataset filtered by a parameter, you must create the query first without the filter. Link the parameter in the Parameters tab and then add the filter. You’ll get an error message if you try to add the filter before the parameter is linked.
Notes:
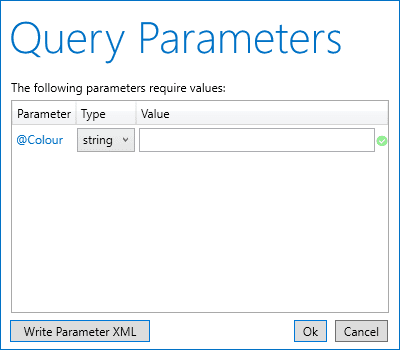
As previously mentioned, DAX Studio allows you to test this approach by entering parameters when you run the DAX. Running the above DAX will display the following dialog:
A single parameter can be reused at multiple places inside the DAX.
- Date parameters require that you enclose the date parameter in the
VALUES()function – like this (for a parameter named@EndDate):
|
1 |
,FILTER(VALUES(DimDate[DateKey]), DimDate[DateKey] >= VALUE("12/29/2020 12:00:00 AM") && DimDate[DateKey]<= <strong>VALUE(@EndDate)</strong>) |
It is worth noting that, given the fragility of Power BI Report Builder, you have to add, update or remove any SSRS parameters that you are using in a report dataset before modifying the query – or, alternatively, modify the query in Notepad++ then add the parameters in Power BI Report Builder. In any case, the input parameters must be aligned to the parameters used in the DAX or Power BI Report Builder will probably hang until you close it and start over. It is also worth remembering that any parameters that you define must be used in the DAX. In contrast, merely adding a parameter to a report and not using it in the dataset will not produce any negative effects.
Populate parameters with all elements selected
The DAX needed if you want to define an SSRS dataset that sets all the elements in a multi-select parameter list as default values are slightly out of the ordinary. You need to add the KEEPFILTERS() function to the DAX, like this:
|
1 2 3 4 5 6 7 |
EVALUATE SUMMARIZECOLUMNS ( DimGeography[CountryName] ,KEEPFILTERS(FILTER(ALL(DimGeography[CountryName]) ,NOT ISBLANK((DimGeography[CountryName])))) ) |
You then use this dataset as the source for the default values in the parameter list by selecting Get values from a query as the Available Values setting in the parameter properties.
Please note that the effect of this definition of default values does not currently display correctly in preview in Power BI Report Builder. To see it work as you expect it to, you have to load the report into the Power BI Service and run the report from there.
Be warned, however, that a multi-value parameter needs careful handling inside the DAX itself. You need to look ahead to the next but one section RSCustomDaxFilter actually to use the multiple elements that you have selected.
Parameterized parameters
Very much as you do for SQL sources, you can create cascading parameters where one parameter’s output becomes an input parameter for a second parameter. This allows you to imitate the hierarchical slicers in Power BI dashboards.
For example, assuming that a parameter named Make exists, and that you want the selected make to filter the items displayed in a Model parameter, you can use the following DAX to return the list of available elements in the Model parameter:
|
1 2 3 4 5 |
EVALUATE SUMMARIZECOLUMNS( DimVehicle[Model] ,FILTER(VALUES(DimVehicle[Make]), DimVehicle[Make] = @Make) ) |
Of course, this requires a couple of basic structural elements:
- The
Makeparameter is moved above theModelparameter in the Parameters list in Power BI Report Developer. - You define
Makeas an input parameter for theModeldataset you create using the code snippet above. - The
Modelparameter can then be used to filter the main report
RSCustomDaxFilter
Handling multi-select parameters is one aspect of parameter passing from SSRS to DAX that was tricky initially (but that has fortunately been solved for a while now).
The currently recommended approach is to use the SSRS function RSCustomDaxFilter() to handle multiple selections in the SSRS report interface. This function is not standard DAX (it is not recognised by DAX Studio, for instance) and only works in the DAX used in .Rdl files.
This function required four elements. They are:
- Parameter Name
- Comparison/Condition
- Field to use
- Data Type
The RSCustomDaxFilter() function is probably best explained using a simple example. Take a look at the following piece of DAX:
|
1 2 3 4 5 6 7 8 |
EVALUATE SUMMARIZECOLUMNS( DimCLient[ClientName] ,DimVehicle[Make] ,DimVehicle[Model] ,RSCustomDaxFilter(@Colour, EqualToCondition, [DimVehicle].[Color], String) ,"Sales", SUM(FactSales[SalePrice]) ) |
This filter takes multiple selected elements passed from the Colour parameter popup list in a paginated report and applies them as an OR filter to the underlying DAX.
Let’s take a closer look at the four elements of the function:
- ParameterName –
(@Colourin this example). This is simple as it is the name of the input parameter as defined in the Parameters pane of the Dataset properties. - Comparison/Condition – (
EqualToConditionin this example). This is the equality operator (=). - Field to use– (
[DimVehicle].[Color]in this example). This refers to the dataset field that must be used to filter data. - Data Type– (String in this example) This specifies the datatype of the parameter.
Notes:
You cannot write the field name inside the RSCustomDaxFilter() function as CaseProduct[Key Ingredients] or ‘CaseProduct’[Key Ingredients] (as you would in normal DAX). You must wrap both the table and the field names in square brackets and separate them with a period. I suspect that this is a possible hangover from the MDX-style approach used in SSRS when handling non-SQL data sources.
The possible datatypes that you can use are:
- Int64
- String
- Double
- DateTime
- Boolean
- Currency
The possible conditions that you can use are:
- EqualToCondition
- Not EqualToCondition
To make things clearer, the following is a valid application of RSCustomDaxFilter():
|
1 |
RSCustomDaxFilter(@SalesAmount,NotEqualToCondition,[FactSales].[SalePrice],Double) |
In practice, you can use RSCustomDaxFilter() where you would otherwise use FILTER() inside the SUMMARIZECOLUMNS() function when you need to accept multiple alternative parameter inputs to filter data. You can, of course, mix the two approaches as well as using use the complete range of possibilities of SUMMARIZECOLUMNS() as the following example shows:
|
1 2 3 4 5 6 7 8 9 10 11 12 13 14 15 16 17 |
EVALUATE SUMMARIZECOLUMNS( DimCLient[ClientName] ,DimVehicle[Make] ,DimVehicle[Model] ,FILTER( VALUES(DimDate[DateKey]) ,AND(DimDate[DateKey] >= VALUE("01/01/2020") ,DimDate[DateKey]<= VALUE("12/30/2022")) ) ,FILTER(VALUES(DimVehicle[Color]), DimVehicle[Color] = @Colour) ,RSCustomDaxFilter(@SalesAmount ,EqualToCondition ,[FactSales].[SalePrice] ,Double) ,"Sales", SUM(FactSales[SalePrice]) ) |
Unfortunately RSCustomDaxFilter() is not recognised by DAX Studio. However, there are workarounds that I will give in the final article in this series. Even more unfortunate is that adding RSCustomDaxFilter using Power BI Report Builder can also cause intermittent issues. So you are probably best advised to add this particular filtering approach to the DAX for the .Rdl file using Notepad++.
Some useful tips
I want to conclude this introductory article with a couple of practical tips that should help when starting out using DAX to query datasets for SSRS reports.
The SAMPLE() Function
Power BI datasets can become extremely large. The corollary is, inevitably, that running sample queries on industrial-sized data sources can take up valuable development time.
One solution to ease the pain – and make queries run considerably faster when carrying out initial development – is the judicious application of the SAMPLE() function. For instance, you can simply wrap a DAX query in SAMPLE() as follows:
|
1 2 3 4 5 6 7 8 9 10 11 12 |
EVALUATE SAMPLE ( 10 ,SUMMARIZECOLUMNS ( DimGeography[CountryName] ,DimCLient[ClientName] ,"Total Sales", SUM(FactSales[SalePrice]) ) ,DimCLient[ClientName] ) |
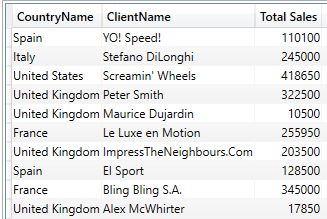
The SAMPLE() function merely requires a number as the first element (the number of sample records that you want the query to return) and the DAX query as the second element. Of course, you have to remember to remove SAMPLE (and the final right parenthesis) once development is complete to allow accurate unit testing. The entire output from this piece of DAX is:
Dummy measure
If you are returning wide lists, that means DAX queries that contain many fields from different tables (whether or not the data is filtered) using SUMMARIZECOLUMNS(). You can easily find yourself facing long query times or even timeouts. The simple solution to resolve this challenge is to add a calculated value (directly calculated or using an existing measure) at the end of the SUMMARIZECOLUMNS() function – even if you will not need to display the calculation output in the actual report.
You can see this technique applied in the following code sample:
|
1 2 3 4 5 6 7 8 9 10 11 12 13 14 15 16 17 |
EVALUATE SUMMARIZECOLUMNS ( DimVehicle[Make] ,DimVehicle[Model] ,DimGeography[CountryName] ,DimGeography[SalesRegion] ,DimGeography[Town] ,DimCLient[IsCreditRisk] ,DimCLient[IsReseller] ,DimCLient[ClientName] ,DimVehicle[MakeCountry] ,DimVehicle[VehicleType] ,DimVehicle[IsRHD] ,DimVehicle[ModelVariant] ,"DummyMeasure", COUNT(FactSales[SalePrice]) ) |
The output from this piece of DAX adds an extra column. However, the increase in the processing speed more than compensates for any increase in data size – and you do not have to use the Dummy column in your paginated report.
It is worth noting that the data output slowdown does not seem to occur when returning multiple fields from a single table in the underlying dataset.
The future articles in this series contain many more hints and tips that you could find helpful when facing more complex challenges.
Next steps
Armed with what you have read in this article, you should be able to create paginated reports that you can either load directly into the Power BI Service or use when creating Power BI visuals using the Paginated Report visual in Power BI Desktop.
However, there is still a lot to learn when using Power BI datasets and DAX as the basis for paginated reports. The next step is to extend the basic approaches that you saw in this article with more advanced DAX techniques that enable you to filter the source data for the paginated reports that you want to deliver. This is the subject of the next article.
This document contains proprietary information and is protected by copyright law.
Copyright © 2026 Red Gate Software Limited. All rights reserved
Load comments