I’m drilling down into the metrics about SQL Server itself available to me in the Analysis tab of SQL Monitor to see what’s up with our two problematic servers.
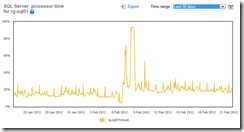
In the previous post I’d noticed that rg-sql01 had quite a few CPU spikes. So one of the first things I want to check there is how much CPU is getting used by SQL Server itself. It’s possible we’re looking at some other process using up all the CPU
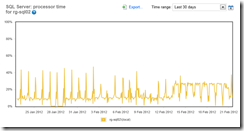
Nope, It’s SQL Server. I compared this to the rg-sql02 server:
You can see that there is a more, consistently low set of CPU counters there. I clearly need to look at rg-sql01 and capture more specific data around the queries running on it to identify which ones are causing these CPU spikes.
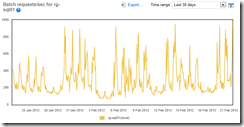
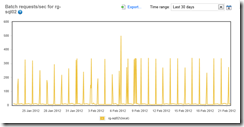
I always like to look at the Batch Requests/sec on a server, not because it’s an indication of a problem, but because it gives you some idea of the load. Just how much is this server getting hit? Here are rg-sql01 and rg-sql02:
Of the two, clearly rg-sql01 has a lot of activity. Remember though, that’s all this is a measure of, activity. It doesn’t suggest anything other than what it says, the number of requests coming in. But it’s the kind of thing you want to know in order to understand how the system is used. Are you seeing a correlation between the number of requests and the CPU usage, or a reverse correlation, the number of requests drops as the CPU spikes? See, it’s useful.
Some of the details you can look at are Compilations/sec, Compilations/Batch and Recompilations/sec. These give you some idea of how the cache is getting used within the system. None of these showed anything interesting on either server.
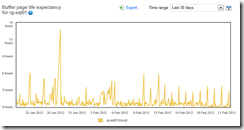
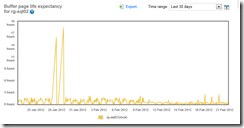
One metric that I like (even though I know it can be controversial) is the Page Life Expectancy. On the average server I expect see a series of mountains as the PLE climbs then drops due to a data load or something along those lines. That’s not the case here:
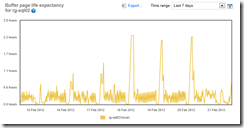
Those spikes back in January suggest that the servers weren’t really being used much. The PLE on the rg-sql01 seems to be somewhat consistent growing to 3 hours or so then dropping, but the rg-sql02 PLE looks like it might be all over the map. Instead of continuing to look at this high level gathering data view, I’m going to drill down on rg-sql02 and see what it’s done for the last week:
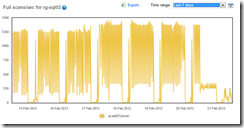
And now we begin to see where we might have an issue. Memory on this system is getting flushed every 1/2 hour or so. I’m going to check another metric, scans:
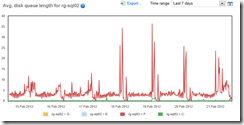
Whoa! I’m going back to the system real quick to look at some disk information again for rg-sql02. Here is the average disk queue length on the server:
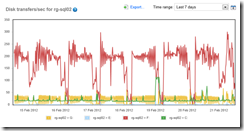
and the transfers
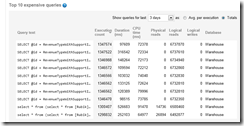
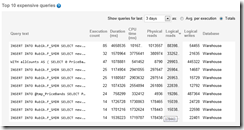
Right, I think I have a guess as to what’s up here. We’re seeing memory get flushed constantly and we’re seeing lots of scans. The disks are queuing, especially that F drive, and there are lots of requests that correspond to the scans and the memory flushes. In short, we’ve got queries that are scanning the data, a lot, so we either have bad queries or bad indexes. I’m going back to the server overview for rg-sql02 and check the Top 10 expensive queries. I’m modifying it to show me the last 3 days and the totals, so I’m not looking at some maintenance routine that ran 10 minutes ago and is skewing the results:
OK. I need to look into these queries that are getting executed this much. They’re generating a lot of reads, but which queries are generating the most reads:
Ow, all still going against the same database. This is where I’m going to temporarily leave SQL Monitor. What I want to do is connect up to the server, validate that the Warehouse database is using the F: drive (which I’ll put money down it is) and then start seeing what’s up with these queries.



Load comments