

This article is the first in this six-part “Moving from Python to esProc SPL” series. You’ll learn how to set up esProc SPL, install it on different operating systems, configure your development environment, and load your first dataset. You’ll also write your first SPL script and compare the setup process with Python. By the end of this first article, you’ll have a fully-functional esProc SPL environment and be ready to look into its capabilities in-depth.
What is esProc SPL, and why should Python users care?
How to install esProc SPL on Windows, macOS and Linux: step-by-step guide
How to install esProc SPL on Windows
Visit the official esProc SPL download page and download the Windows installer. To run the installer, double-click the .exe file and follow the on-screen instructions. After installation, launch esProc SPL from the Start menu.
How to install esProc SPL on macOS
Download the macOS version of esProc SPL from the website. Open the .dmg file and drag esProc SPL to the Applications folder. To launch esProc SPL, open the application from the Launchpad or Terminal.
How to install esProc SPL on Linux
First, you’ll need to download the Linux archive by getting the .tar.gz file from the official site. Then, extract the files: tar -xvzf esProc-linux.tar.gz, and run esProc SPL:
|
1 2 |
cd esProc ./esProc |
How to configure your development environment (IDE options)
The esProc IDE (integrated development environment) comes with several configuration options, allowing you to tailor your development experience for better efficiency. Adjusting these settings can improve readability, performance, and overall workflow.
Before coding, you may want to customize the IDE to suit your preferences. To access the settings, click on “Tools” in the top menu and select “Options” to open the configuration dialog.
One of the first things you can adjust is the editor’s appearance. Choosing a monospaced font like Consolas or Source Code Pro can improve code readability. A comfortable font size, typically between 12 to 14pt, ensures your scripts remain clear and easy to read. You can switch between a light or dark theme depending on your preference.
Optimizing memory allocation is necessary for performance if you plan to work with large datasets. Navigate to the “Performance” tab in the settings and increase the maximum memory allocation. A good starting point is 50% of your system’s available RAM, which helps the IDE handle large-scale computations smoothly.
Another useful configuration is setting default file locations. You can specify where your SPL scripts should be saved and define default directories for datasets, ensuring quick access to frequently used files.
Keyboard shortcuts for faster workflow
Mastering keyboard shortcuts in esProc SPL can significantly improve your productivity. The following shortcuts help streamline your workflow:
F5 – Executes the current script
F9 – Runs a selected block of code
Ctrl + Space – Activates code completion
Ctrl + / – Comments or uncomments selected lines
Ctrl + S – Saves the current script
F1 – Opens the help documentation
You can view and customize additional shortcuts by navigating to the “Keyboard” section in the Options dialog. Configuring the IDE and familiarizing yourself with these shortcuts will make coding in esProc SPL more efficient and enjoyable. For this guide, we’ll focus on using the esProc IDE, as it provides the most seamless experience for beginners.
Simple Talk is brought to you by Redgate Software
How to load your first dataset in esProc SPL: CSV, JSON, and database connections
Now that you’ve installed and configured esProc SPL, it’s time to start working with actual data. One of the first skills you need to understand is loading data from various sources. In this section, I’ll walk you through importing data from CSV files, JSON documents, and database connections using the esProc IDE.
How to work with CSV in esProc SPL
Comma-separated value (CSV) files are among the most common formats for storing tabular data. They’re simple text files where each line represents a row, and values are separated by commas (or other delimiters). Loading CSV files in esProc SPL is remarkably simple.
To load a CSV file in the esProc IDE, you’ll use the `file()` function combined with the `import@ct()` method. Open the esProc IDE and create a new script. Then, type the following code:
= file("data/sales.csv").import@ct() (load a CSV file with headers)
=A1.to(5) (display the first 5 rows to verify that the data loaded correctly)
When you run this code, EsProc will load the CSV file and display the results in cell A1. The `import@ct()` method tells EsProc to import the file as a table, with the first row treated as column headers. The `@c` option specifies that the file is comma-separated, which is typical for CSV files. The `t` option indicates that the first row contains column names.
Let’s look at the output you’ll see in cell A2:
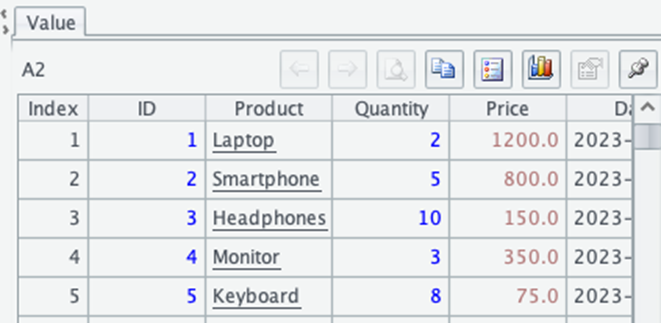
This output shows the first 5 rows of your dataset, with column headers and the corresponding values. You can see that esProc has correctly identified the structure of your data, including the column names and data types. The ID and Quantity columns contain integers, Price contains decimal numbers, Product contains text strings, and Date contains date values.
How does working with CSV in esProc SPL compare to doing so in Python?
If you’re coming from Python, the equivalent code using pandas would look like this:
|
1 2 3 4 5 6 7 |
import pandas as pd # Load the CSV file df = pd.read_csv('data/sales.csv') # Display the first 5 rows print(df.head()) |
Notice how esProc SPL achieves the same result with a more straightforward syntax. You don’t need to import any libraries or modules – the file handling capabilities are built right into the language.
Sometimes, your CSV files might have different delimiters or require specific data type conversions. esProc gives you full control over these options:
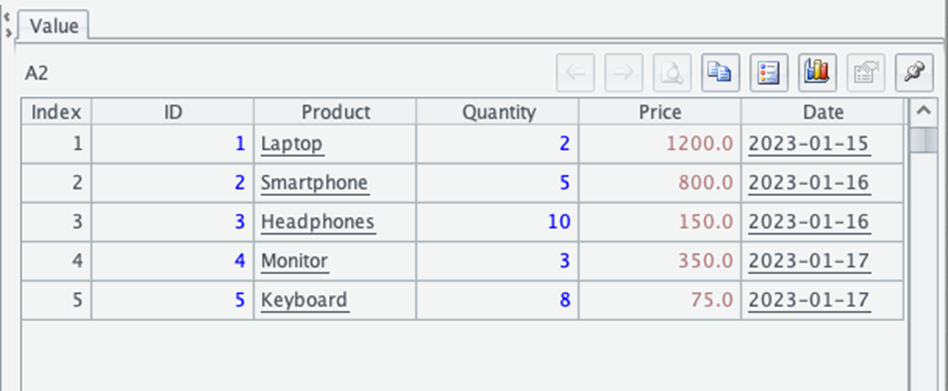
The output for A2 will show you the structure of your dataset:
Notice how the ID column is now treated as a string (as specified in our data type parameter) rather than an integer. This level of control is particularly useful when working with data that contains leading zeros in codes or other special formatting requirements.
After loading your CSV data, you might want to explore it further. The esProc IDE allows you to examine your data directly in the cell results. Simply click on the cell containing your dataset (A1 in our example), and you’ll see a preview of the data.
For a more detailed view, right-click on the cell and select “Browse” from the context menu. This opens the Data Browser, where you can sort columns, apply filters, and get a better understanding of your data.
How to work with JSON files in esProc SPL
JavaScript Object Notation (JSON) has become increasingly popular for data exchange due to its readable format and compatibility with web technologies. esProc SPL makes working with JSON files just as easy as CSV files. To load a JSON file in esProc, you’ll use the `file()` function with the `read()` method:
| A | |
| 1 | file("/Users/Chisom/Documents/sales.json").read() |
| 2 | = json(A1) |
When working with JSON files in esProc SPL, you might find that different approaches work better depending on your specific environment and file structure. In my case, I found success with this approach. It first reads the raw content of the JSON file as text using the `read()` function without any options, then parses it into a JSON object using the `json()` function.
This approach can be more explicit and sometimes more reliable when dealing with different JSON formats. Let’s look at the output:
This output shows five records from your JSON file, now structured as a table with columns for each property in the JSON objects. esProc has automatically detected the structure and converted it to a format that’s easy to work with for data analysis.
How do JSON files work in Python?
In Python, you would typically use pandas to achieve a similar result:
|
1 2 3 4 5 6 7 8 9 10 11 12 |
import pandas as pd import json # Read the JSON file with open('documents/sales.json', 'r') as f: data = json.load(f) # Convert to DataFrame df = pd.DataFrame(data) # Display the first 5 rows print(df.head(5)) |
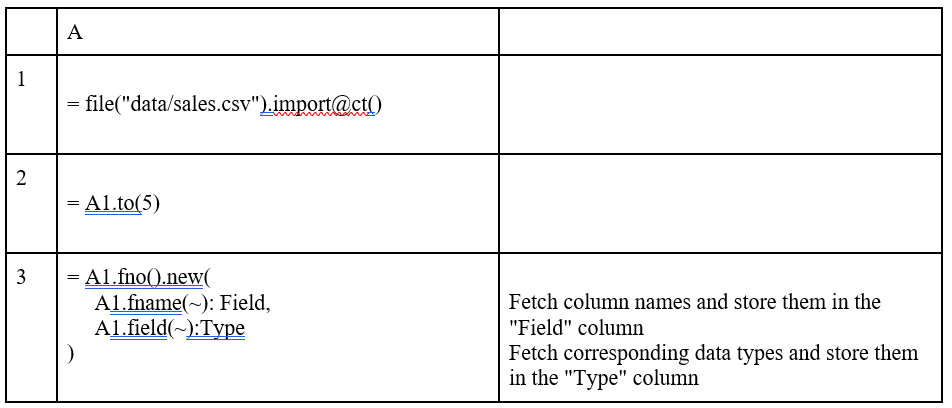
Notice how esProc simplifies this process with its built-in JSON handling capabilities. You don’t need to import multiple libraries or write separate code for reading and converting the data. To verify the column structure, use:
| A | ||
| 3 | = A2.fno().new(A2.fname(~):Field, A2.field(~):Type) | Check the structure of the table |
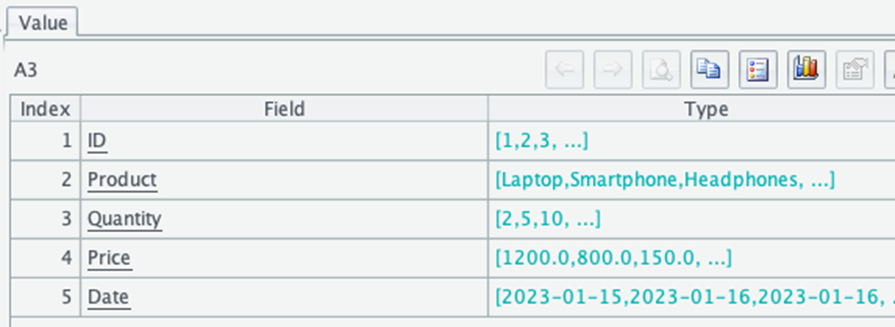
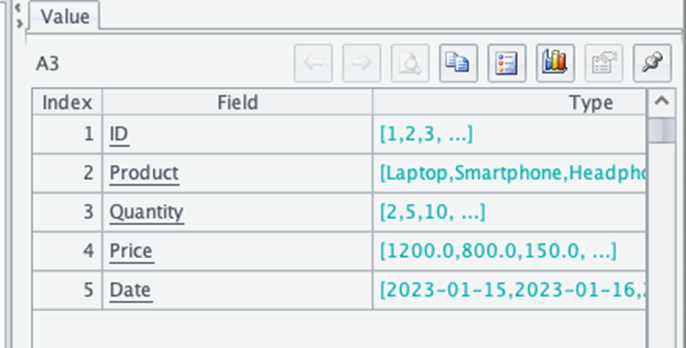
It gives a table with field names and data types.
JSON files can have complex nested structures. esProc provides powerful tools for handling these as well:
| A | ||
| 1 | =file("/Users/Chisom/Documents/sales.json").read() | |
| 2 | = json(A1) | |
| 3 | = A2.derive(Customer.name:CustomerName, Customer.email:CustomerEmail) | Extract nested customer information. |
The output will look like this:
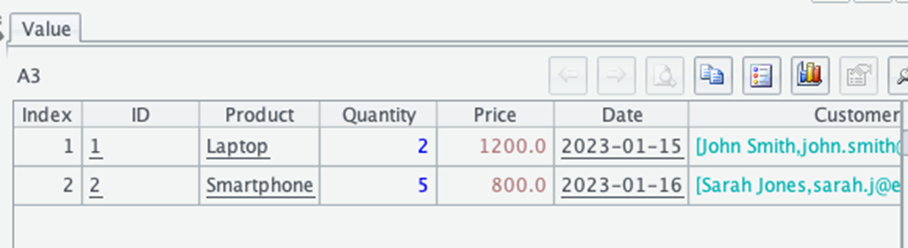
In this example, the `derive()` method creates new columns by extracting values from nested objects. The syntax `customer.name:CustomerName` tells esProc to take the `name` property from the `customer` object and create a new column called `CustomerName`. This method makes it easy to work with nested JSON structures without writing complex extraction logic.
How to connect to databases with esProc SPL
One of esProc SPL’s strengths is its ability to connect directly to various databases. This capability is built into the language, eliminating the need for additional database connector libraries.
To connect to a database in the esProc IDE, you first need to configure a database connection. Click on “Tools” in the top menu, then select “Database Connection.” In the dialog that appears, click “New” to create a connection. You’ll need to provide details such as the database type, host, port, username, and password. After saving your connection, you can use it in your scripts.
How do you query a database in esProc SPL?
| A | ||
| 1 | = connect("SalesDB") | Connect to a configured database |
| 2 | = A1.query("SELECT * FROM sales WHERE region = 'West' LIMIT 5") | Execute a SQL query |
| 3 | = "Number of rows: " + A2.len() | Display information about the result set |
| 4 | = "Number of columns: " + A2.fno() | |
| 5 | = A1.close() | Close the connection |
When you run this code, esProc will connect to your database, execute the SQL query, and store the results in cell A2. The output will show a table with five rows containing sales data from “west” region, the number of rows retrieved and the number of columns in the dataset. esProc has retrieved the data and converted it into a cellset (esProc’s equivalent of a DataFrame), which you can now analyze using SPL’s data manipulation capabilities.
How do you query a database in Python?
In Python, you would typically use a combination of libraries like SQLAlchemy or a database-specific connector along with pandas:
|
1 2 3 4 5 6 7 8 9 10 11 12 13 14 15 16 17 18 19 20 |
import pandas as pd import mysql.connector # Connect to the database conn = mysql.connector.connect( host="localhost", user="username", password="password", database="mydatabase" ) # Execute a query and load results into a DataFrame query = "SELECT * FROM customers WHERE region = 'West' LIMIT 5" df = pd.read_sql(query, conn) # Display the results print(df) # Close the connection conn.close() |
How does esProc SPL simplify the process of querying a database?
esProc simplifies this process by handling the connection and data retrieval in a more integrated way. You don’t need to import multiple libraries or write boilerplate connection code – just use the `connect()` function with your pre-configured connection name. esProc also makes it easy to work with stored procedures:
| A | ||
| 1 | = connect("SalesDB") | Connect to the database |
| 2 | = A1.call("GetCustomerOrders", [101]) | Call a stored procedure with parameters |
| 3 | = A2.fetch(5) | Fetch and display the first 5 results |
| 4 | = A1.close() Close the connection | Close the connection |
The output (A3) shows the first five orders for customer 101, retrieved by calling the `GetCustomerOrders` stored procedure. The `call()` method takes the procedure name as the first parameter and an array of parameter values as the second parameter.
One of the advantages of using esProc for database operations is that you can seamlessly combine SQL queries with SPL’s data manipulation capabilities. For example, you can retrieve data from a database and then perform additional transformations that might be difficult or verbose to express in SQL:
| A | ||
| 1 | = connect("SalesDB") | |
| 2 | = A1.query("SELECT product, category, sale_date, amount FROM sales WHERE sale_date >= '2023-01-01'") | Retrieve sales data |
| 3 | = A2.derive(month(sale_date):Month) | Extract month from sale_date |
| 4 | = A3.groups(category, Month; sum(amount):MonthlySales) | Group by category and month, summing sales amounts |
| 5 | = A4.pivot(category, Month; MonthlySales) | Pivot the data to display monthly sales per category |
| 6 | = A5.fetch() | Fetch and display results |
| 7 | = A1.close() | Close the connection |
The output (A6) will be a pivot table showing total monthly sales per category. This example demonstrates how you can combine SQL and SPL to create a powerful data analysis workflow. First, you retrieve the raw sales data from the database using SQL. Then, you use SPL to extract the month from the sale date, group the data by category and month, calculate the sum of sales for each group and, finally, create a pivot table that shows monthly sales for each category. The result is a concise summary that would be much more verbose to create using SQL alone.
Comparing the setup process: Python vs SPL
When you’re starting a new data analysis project, the initial setup can significantly impact your productivity and experience. Python and esProc SPL take fundamentally different approaches to this process, each with its own advantages and considerations.
Installation
The installation process is where you’ll notice the first major difference between Python and esProc SPL. With Python, you’re embarking on a multi-step journey. First, you need to download and install the Python interpreter itself. A typical Python data analysis setup requires installing multiple packages:
|
1 2 |
# Installing essential Python data analysis packages pip install pandas numpy matplotlib seaborn scikit-learn jupyter |
This command alone brings in six different packages, each with its own dependencies. While this approach gives you flexibility to install only what you need, it also requires you to know what you need in advance.
In contrast, esProc SPL takes an all-in-one approach. You download a single package that includes the runtime environment, development IDE, and all the core functionality needed for data analysis. There’s no separate package manager to learn, no dependencies to resolve, and no version conflicts to troubleshoot. You simply download, extract, and run.
The esProc installation process looks more like this:
1. Download the esProc package for your operating system
2. Extract the files to a location of your choice
3. Run the executable
It gets you up and running quickly, especially if you’re new to data analysis or don’t want to spend time configuring a development environment.
Environment management: simplicity vs. flexibility
Python’s ecosystem has evolved to address the challenges of managing dependencies across different projects. Tools like virtualenv, venv, and conda environments allow you to create isolated environments with specific package versions for each project. This approach prevents conflicts between projects that might require different versions of the same library. Setting up a Python virtual environment typically involves commands like:
|
1 2 3 4 5 6 |
# Creating and activating a virtual environment python -m venv myproject_env source myproject_env/bin/activate # On Windows: myproject_env\Scripts\activate # Installing project-specific packages pip install pandas==1.4.2 matplotlib==3.5.1 |
You’ll need to activate this environment each time you work on the project, and you might maintain a requirements.txt file to track dependencies. While this system offers excellent flexibility for complex projects, it adds another layer of complexity to manage.
esProc SPL takes a different approach by eliminating the need for environment management altogether. Since all functionality is built into the core product, there are no external dependencies to manage. You don’t need to create or activate environments, install packages, or track dependency versions. This approach sacrifices some flexibility but gains simplicity and consistency.
When you open the esProc IDE, you’re immediately ready to start working with all the available features. This consistency means you don’t have to worry about whether you’ve activated the right environment or installed the correct package versions.
Enjoying this article? Subscribe to the Simple Talk newsletter
Development environment: integrated vs. modular
The development environment is another area where Python and esProc SPL differ significantly. With Python, you have a wealth of options for your development environment. You might use a general-purpose IDE like PyCharm or VS Code, a notebook interface like Jupyter, or even a simple text editor with a terminal.
Each option has its own setup process, configuration options, and learning curve. You’ll likely spend time customizing your environment with extensions, themes, and settings to suit your preferences. A typical Python data analysis workflow might involve:
- Writing code in an IDE or text editor
- Running scripts in a terminal or within the IDE
- Visualizing results in a separate window or notebook cell
- Using additional tools for debugging and profiling
The modular approach gives you tremendous flexibility but requires you to piece together different components and learn how they interact.
esProc SPL, on the other hand, provides an integrated development environment specifically designed for data analysis. The IDE includes:
- A code editor with syntax highlighting and auto-completion
- An integrated execution environment that shows results directly in the IDE
- A data browser for exploring datasets
- Built-in visualization capabilities
- Debugging and profiling tools
This integrated approach means you don’t need to switch between different tools or windows during your workflow. You write code, execute it, and see the results all in the same interface. For data analysis tasks, this can lead to a more streamlined and focused experience.
Project structure and organization
How you organize your data analysis projects differs between Python and esProc SPL. In Python, you’ll typically create a project directory with multiple files and subdirectories. A common structure might include:
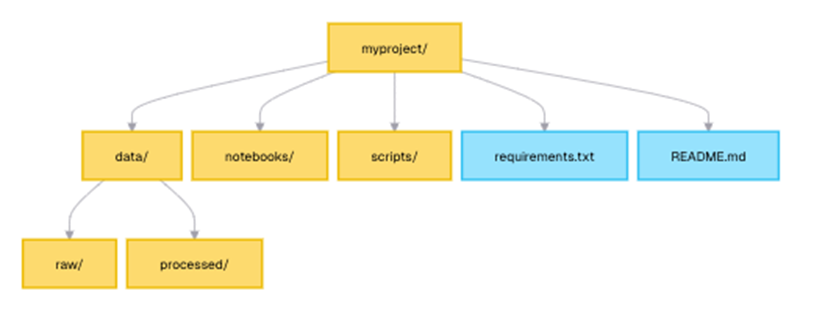
You’ll need to manage imports between files, ensure proper path handling for data files, and potentially create package structures for larger projects. This flexibility allows for complex, well-organized projects but requires more upfront planning and maintenance.
esProc SPL takes a more straightforward approach to project organization. Projects in esProc are collections of SPL scripts, with each script typically focused on a specific analysis task. The IDE provides project management features that allow you to organize related scripts together. Data connections and common settings are managed centrally, reducing the need for configuration in individual scripts.
This approach simplifies project organization, especially for smaller to medium-sized data analysis tasks. You can focus more on the analysis itself and less on managing project structure and dependencies.
Learning curve considerations
The learning curve is an important factor to consider when choosing a data analysis environment. Python’s learning curve for data analysis is relatively gentle at first but steepens as you delve deeper. You start by learning the Python language itself, then add pandas for data manipulation, matplotlib or seaborn for visualization, and potentially scikit-learn for machine learning. Each library has its own concepts, syntax, and best practices to learn. The advantage is that you can learn incrementally, adding new libraries as you need them.
The initial curve when learning esProc SPL, on the other hand, might be slightly steeper as you learn the SPL syntax and concepts, which differ from traditional programming languages. However, the curve tends to flatten out more quickly because all functionality is integrated into a single, consistent language. You don’t need to learn different syntaxes for different tasks: the same SPL concepts apply whether you’re filtering data, performing aggregations, or creating visualizations.
For someone new to programming entirely, Python might be more accessible due to its widespread use and abundant learning resources. For someone with SQL experience or focused specifically on data analysis tasks, SPL’s data-oriented approach might feel more intuitive.
Maintenance and updates
Maintaining your data analysis environment over time is another consideration. With Python, updates can be a complex process. You need to manage updates to Python itself, your IDE, and all the libraries you use. Updating one package might break dependencies with others. This complexity is why many Python users rely heavily on virtual environments and pinned dependency versions. Updating a package in Python involves:
|
1 |
pip install --upgrade pandas |
…but you might need to update multiple packages and resolve any conflicts that arise. esProc SPL, meanwhile, simplifies this process with its all-in-one approach. Updates are released as complete packages, ensuring that all components work together seamlessly. You don’t need to worry about compatibility between different components or libraries.
When a new version is released, you simply download and install it, replacing your previous installation. This approach sacrifices the ability to update individual components independently but gains consistency and reliability. For production environments where stability is crucial, this can be a significant advantage.
Collaboration and sharing
How easily you can share your work with colleagues is another important aspect of the setup process. In Python, this typically involves sharing your code files along with a requirements.txt file or environment.yml file that lists all dependencies. Your colleagues then need to recreate your environment to run your code. This process can be streamlined with tools like Docker, but adds another layer of complexity to the setup.
esProc SPL simplifies collaboration by eliminating dependency management. Since all functionality is built-in, you only need to share your SPL scripts – as long as your colleagues have esProc installed, they can run your scripts without any additional setup. This can be particularly valuable in organizations where not everyone has the technical expertise to manage Python environments.
The Python and esProc SPL setup process, compared
The best choice depends on your specific needs, technical comfort level, and the types of data analysis tasks you perform most frequently. Many data professionals find value in knowing both approaches, using Python for its extensive ecosystem and esProc SPL for its efficiency with structured data processing tasks.
Conclusion & Next Steps
In this first article of our “Moving from Python to esProc SPL” series, you’ve learned how to set up esProc SPL for data analysis, explored its IDE, and written your first SPL script. You’ve seen how SPL’s approach differs from Python’s, particularly in its integrated environment and data-flow oriented syntax.
esProc SPL offers a compelling alternative to Python for structured data processing tasks, with its concise syntax and built-in optimization for data operations. While it’s not a replacement for Python in all scenarios, it can be a powerful addition to your data analysis toolkit, especially for complex data transformations and SQL-like operations on files.
In the next article of this series, we’ll learn esProc SPL’s syntax and data structures, exploring how its table sequence compares to Python’s DataFrame and how to leverage SPL’s unique features for efficient data manipulation. You’ll learn about variables, data types, control structures, and functions in SPL, building a solid foundation for more advanced data analysis techniques.
Further Reading
To deepen your understanding of esProc SPL and data analysis in general, here are some valuable resources:
- esProc official documentation – comprehensive reference for SPL syntax and functions.
- esProc SPL and SQL – detailed comparison of approaches.
- Fundamentals of Data Analysis – data analysis resource.
FAQs: Introduction to esProc SPL
1. What is esProc SPL, and how is it different to Python?
esProc SPL is a data processing language optimized for structured data. Unlike Python, which relies on Pandas for data analysis, esProc SPL has built-in capabilities for handling structured data efficiently.
2. How do I install esProc SPL on Windows/macOS/Linux?
You can download esProc SPL from the esProc official website and follow the installation steps outlined in this guide.
3. Does esProc SPL work with CSV and databases?
Yes, esProc SPL natively supports CSV, JSON, and database connections, making importing and processing data easy.
4. Is esProc SPL beginner-friendly compared to Python?
Yes! If you’re familiar with SQL or spreadsheet-style data manipulation, esProc SPL’s syntax will feel intuitive and easy to learn.


This document contains proprietary information and is protected by copyright law.
Copyright © 2026 Red Gate Software Limited. All rights reserved


Load comments