
Window aggregate functions in SQL Server – using SUM(), AVG(), MIN(), and MAX() with an OVER clause – are powerful for analytical queries but have historically suffered significant performance overhead, particularly for accumulating aggregates like running totals. SQL Server 2019 addresses this with Batch Mode on Rowstore: a query processing improvement that allows batch mode execution on standard heap and B-tree tables without requiring a columnstore index. This article benchmarks the improvement specifically for window aggregate queries, showing up to 7× elapsed time improvement on accumulating SUM queries, and covers what types of window operations benefit most from the feature.
In 2005 and 2012, Microsoft introduced a number of windowing functions in SQL Server, like my favourite function LAG. These functions perform well, but, in my opinion, the main benefit is making complicated queries easier to write. I’ve been fascinated by these functions for years, but there is one thing about them that has bothered me, and that is the performance of window aggregate functions. Luckily, that is changing with SQL Server 2019.
What are Window Aggregate Functions?
Window aggregate functions let you add your favourite aggregate functions, like SUM, AVG and MIN, to non-aggregate queries. This lets you return the details in the results while adding in grand totals or sub-totals or any other aggregate you need. Here’s an example:
|
1 2 3 4 5 6 7 8 9 10 11 12 |
USE AdventureWorks2017; GO SET STATISTICS IO ON; GO SELECT CustomerID, SalesOrderID, OrderDate, TotalDue FROM Sales.SalesOrderHeader ORDER BY CustomerID; SELECT CustomerID, SalesOrderID, OrderDate, TotalDue, SUM(TotalDue) OVER(PARTITION BY CustomerID) AS SubTotal FROM Sales.SalesOrderHeader ORDER BY CustomerID; |
I’m running SQL Server 2019 CTP 2.2, and the database is in 2016 compatibility mode. The first query lists the sales orders, and the second query also has a sub total for each customer. The results should look like Figure 1.
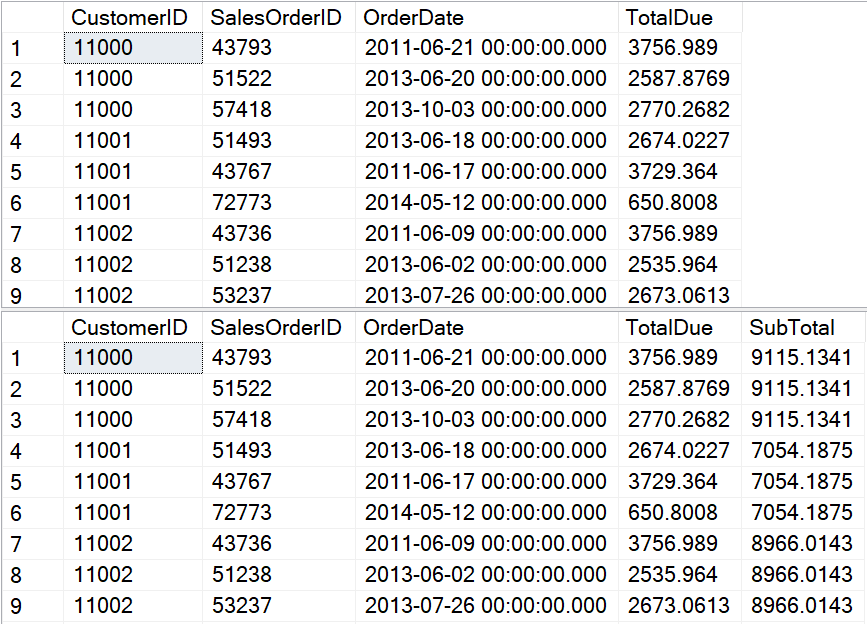
Figure 1: The partial results of the sales orders queries
I think you would have to agree that calculating the subtotal was easy to do. You just have to add the OVER clause. In this case, I wanted the subtotals for each customer, so I included PARTITION BY CustomerID. The problem with this technique is that the performance has been disappointing. In fact, I’ve been recommending that window aggregates be avoided when they must operate on a large number of rows. To show what I mean, take a look at the STATISTICS IO results in Figure 2.
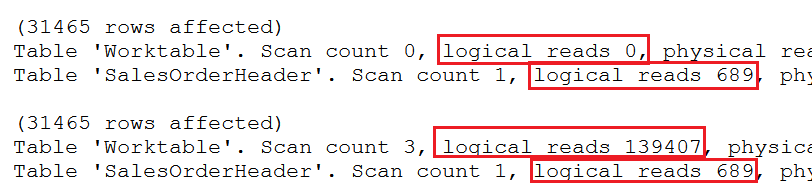
Figure 2: The logical reads for the sales orders queries
The first query has 0 logical reads for a worktable and 689 logical reads for scanning the entire table since there is no WHERE clause. The second query also takes 689 logical reads for scanning the table, and 139,407 logical reads for a worktable. That’s a big difference, but do the logical reads for a worktable affect query run times? These AdventureWorks tables are too small to see the performance impact, but it does make a difference as you’ll see in the next section.
Is the Performance Really That Bad?
To show how much the window aggregate impacts performance, the following queries use bigger tables created from Adam Mechanic’s script Thinking Big Adventure. To make sure that populating SSMS (SQL Server Management Studio) does not affect the run times, the results are saved in temp tables. Here are two queries calculating the subtotal for each product in this table of 31 million rows.
|
1 2 3 4 5 6 7 8 9 10 11 12 13 14 15 16 17 18 19 20 21 22 23 24 |
SET STATISTICS IO ON; SET STATISTICS TIME ON; CREATE TABLE #Products(ProductID INT, TransactionDate DATETIME, Total MONEY, SubTotal MONEY); WITH SubTotalByProduct AS ( SELECT ProductID, SUM(Quantity * ActualCost) AS SubTotal FROM bigTransactionHistory GROUP BY ProductID) INSERT INTO #Products (ProductID, TransactionDate, Total, SubTotal) SELECT STP.ProductID, TransactionDate, Quantity * ActualCost AS Total, SubTotal FROM bigTransactionHistory AS BT JOIN SubTotalByProduct AS STP ON BT.ProductID = STP.ProductID; TRUNCATE TABLE #Products; INSERT INTO #Products (ProductID, TransactionDate, Total, SubTotal) SELECT ProductID, TransactionDate, Quantity * ActualCost AS Total, SUM(Quantity * ActualCost) OVER(PARTITION BY ProductID) AS SubTotal FROM dbo.bigTransactionHistory; DROP TABLE #Products; |
Since the results are stored in temp tables, the only output is the STATISTICS IO and STATISTICS TIME. The first query in this example demonstrates one of the traditional methods to get subtotals, using a CTE (common table expression) that joins to the original table. The second query creates the same results, but with a window aggregate function.
To make sure that caching didn’t affect the run time, I ran the queries twice. The statistics results of the second run can be seen in Figure 3.
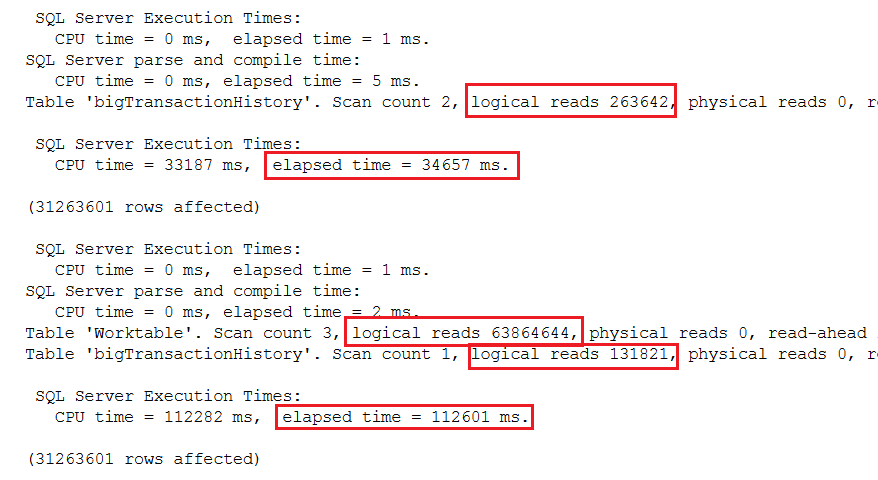
Figure 3: The results of running the test on bigTransactionHistory
The first thing to notice is that the traditional method took 35 seconds. The window aggregate function method took 156 seconds or about 2.2 minutes. You can also see a big difference in the logical reads. The traditional method took twice as many logical reads when scanning the table. That’s because the table was accessed once inside the CTE and again in the outer query. The table was scanned just once when using the window aggregate, but again, the logical reads required is much higher than just reading the table due to the worktable. As you can see, there is a big performance hit with window aggregates over traditional methods.
Batch Mode to the Rescue
In 2016, Microsoft announced an advancement in the columnstore index feature called batch mode processing. This feature also improves the performance of window aggregate queries as long as a table with a columnstore index is part of the query. If that happens naturally, wonderful! Otherwise, artificially adding a columnstore index seems like more trouble than just using the traditional query method.
To show the difference in performance, this example creates an empty temp table with a columnstore index and adds it to the query.
|
1 2 3 4 5 6 7 8 9 10 11 12 13 14 15 16 17 18 19 20 21 22 23 |
USE master; GO ALTER DATABASE AdventureWorks2017 --Make sure it’s 2016 compat SET COMPATIBILITY_LEVEL = 130 WITH NO_WAIT GO USE AdventureWorks2017; GO CREATE TABLE #Products(ProductID INT, TransactionDate DATETIME, Total MONEY, SubTotal MONEY); CREATE TABLE #CS(KeyCol INT NOT NULL PRIMARY KEY, Col1 NVARCHAR(25)); CREATE COLUMNSTORE INDEX CSI_CS ON #CS(KeyCol, Col1); INSERT INTO #Products (ProductID, TransactionDate, Total, SubTotal) SELECT ProductID, TransactionDate, Quantity * ActualCost AS Total, SUM(Quantity * ActualCost) OVER(PARTITION BY ProductID) AS SubTotal FROM dbo.bigTransactionHistory OUTER APPLY #CS; DROP TABLE #Products; DROP TABLE #CS; |
To see the benefits of the 2016 change, the database compatibility level was changed to 2016. The empty table #CS was created along with a columnstore index. It’s added to the query with an OUTER APPLY and doesn’t affect the results.
The performance results can be found in Figure 4:
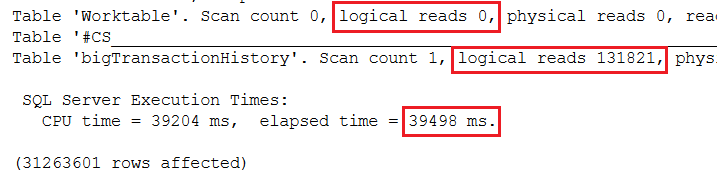
Figure 4: Including a columnstore index to improve performance
In this test, the performance was similar to the traditional CTE query. That’s great, but in my opinion the main reason to use the window aggregate is to make the query simple to write. I don’t want to add the complexity of adding an artificial columnstore index. Luckily, in 2019, batch row processing applies to some queries that could benefit from it without a columnstore index, including window aggregates! This feature is called Batch Mode on Rowstore. Here is another test, this time with 2019 compatibility level.
|
1 2 3 4 5 6 7 8 9 10 11 12 13 14 15 16 17 18 |
USE master; GO ALTER DATABASE AdventureWorks2017 --Set to 2019 compat SET COMPATIBILITY_LEVEL = 150 WITH NO_WAIT GO USE AdventureWorks2017; GO CREATE TABLE #Products(ProductID INT, TransactionDate DATETIME, Total MONEY, SubTotal MONEY); INSERT INTO #Products (ProductID, TransactionDate, Total, SubTotal) SELECT ProductID, TransactionDate, Quantity * ActualCost AS Total, SUM(Quantity * ActualCost) OVER(PARTITION BY ProductID) AS SubTotal FROM dbo.bigTransactionHistory; DROP TABLE #Products; |
This time, the query took just 15 seconds to run! The performance results are shown in Figure 5.
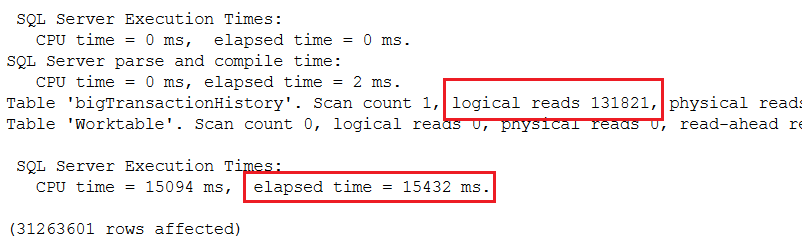
Figure 5: Using the 2019 batch mode feature
Accumulating Aggregates
To get running totals, all you have to do is add ORDER BY to the OVER clause to the window aggregate. This is easy to do and will give you the results you expect as long as the columns in the ORDER BY option of the OVER clause are unique. To drastically improve performance, you need to add the frame (ROWS BETWEEN UNBOUND PROCEEDING AND CURRENT ROW) to the OVER clause. This is intuitive and is probably left out more often than it’s included. To see the difference, this test compares using the frame to not using the frame in 2016 compatibility mode.
|
1 2 3 4 5 6 7 8 9 10 11 12 13 14 15 16 17 18 19 20 21 22 23 24 25 26 27 28 29 30 |
USE master; GO ALTER DATABASE AdventureWorks2017 SET COMPATIBILITY_LEVEL = 130 WITH NO_WAIT GO USE AdventureWorks2017; GO CREATE TABLE #Products(TransactionID INT, ProductID INT, TransactionDate DATETIME, Total MONEY, RunningTotal MONEY); INSERT INTO #Products (TransactionID, ProductID, TransactionDate, Total, RunningTotal) SELECT TransactionID, ProductID, TransactionDate, Quantity * ActualCost, SUM(Quantity * ActualCost) OVER(PARTITION BY ProductID ORDER BY TransactionID) FROM bigTransactionHistory; TRUNCATE TABLE #Products; INSERT INTO #Products (TransactionID, ProductID, TransactionDate, Total, RunningTotal) SELECT TransactionID, ProductID, TransactionDate, Quantity * ActualCost, SUM(Quantity * ActualCost) OVER(PARTITION BY ProductID ORDER BY TransactionID ROWS BETWEEN UNBOUNDED PRECEDING AND CURRENT ROW) FROM bigTransactionHistory; DROP TABLE #PRODUCTS |
The results when using 2016 compatibility mode can be seen in Figure 6.
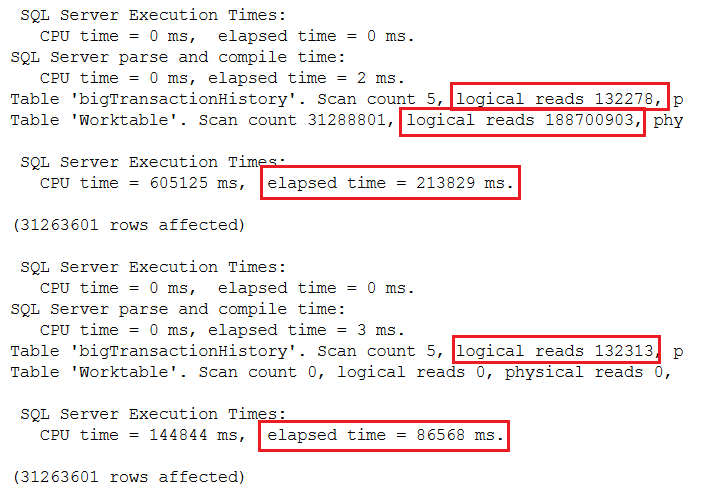
Figure 6: The results comparing using a frame with 2016 compatibility
By using the frame, the query went from almost 4 minutes to 1.4 minutes. Here’s the same test except for 2019 compatibility to take advantage of batch mode processing.
|
1 2 3 4 5 6 7 8 9 10 11 12 13 14 15 16 17 18 19 20 21 22 23 24 25 26 27 28 29 30 |
USE master; GO ALTER DATABASE AdventureWorks2017 SET COMPATIBILITY_LEVEL = 150 WITH NO_WAIT GO USE AdventureWorks2017; GO CREATE TABLE #Products(TransactionID INT, ProductID INT, TransactionDate DATETIME, Total MONEY, RunningTotal MONEY); INSERT INTO #Products (TransactionID, ProductID, TransactionDate, Total, RunningTotal) SELECT TransactionID, ProductID, TransactionDate, Quantity * ActualCost, SUM(Quantity * ActualCost) OVER(PARTITION BY ProductID ORDER BY TransactionID) FROM bigTransactionHistory; TRUNCATE TABLE #Products; INSERT INTO #Products (TransactionID, ProductID, TransactionDate, Total, RunningTotal) SELECT TransactionID, ProductID, TransactionDate, Quantity * ActualCost, SUM(Quantity * ActualCost) OVER(PARTITION BY ProductID ORDER BY TransactionID ROWS BETWEEN UNBOUNDED PRECEDING AND CURRENT ROW) FROM bigTransactionHistory; DROP TABLE #Products; |
With batch mode, there is no performance penalty due to leaving out the frame. In each case, it took less than 30 seconds to run, even faster than using the frame in 2016. Of course, you will need to include the frame if you need one that is different than the default. (See my article Introduction to T-SQL Window Functions to learn more.) Figure 7 has the performance results.
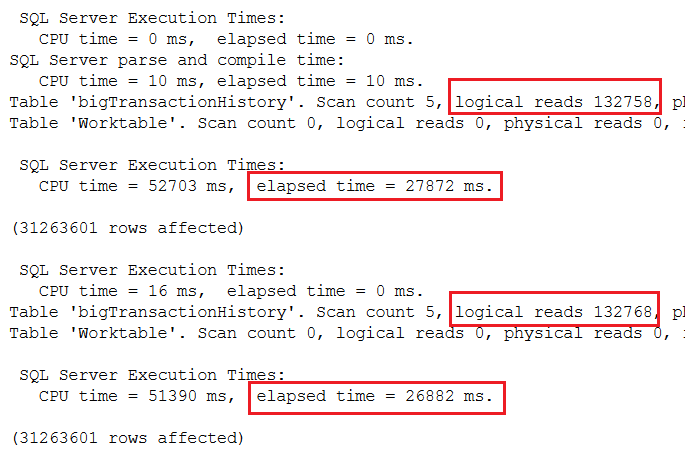
Figure 7: The results of using 2019 compatibility mode with running totals
Batch Mode on Rowstore Processing
As you can see, this new batch mode on rowstore feature dramatically improved the performance of these two window function queries. My queries ran about 7 times faster, but your results will vary. How does batch mode work? It breaks the processing down into chunks of 900 values. SQL Server reserves this for queries with aggregation and sorts when scanning a large number of rows. It’s one of several query processing improvements available with 2019 which together are called Intelligent Query Processing.
You may be wondering how to know if batch processing is used for a query. If you take a look at the execution plan, you can see the difference. Figure 8 is the execution plan for the subtotal query while in 2016 compatibility mode. To make this easier to see, I’ve split the image into two. The top shows the left side of the plan, and the bottom is the right side of the plan.
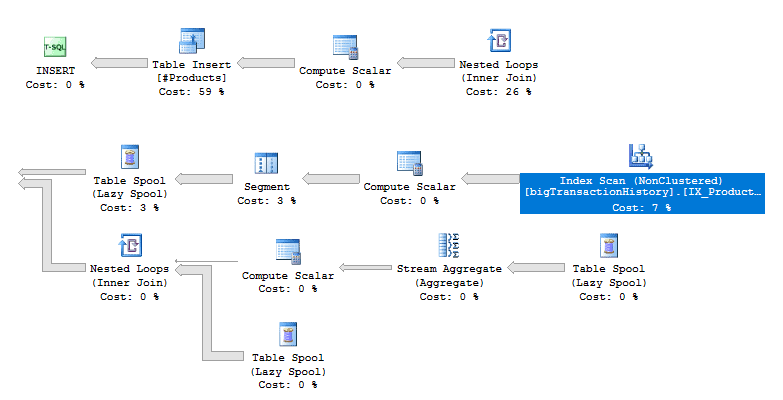
Figure 8: The execution plan for the subtotals with 2016 compatibility mode
The first interesting thing to note is that parallelism is not used even though it seems like it would be useful in a query of 31 million rows. It might be possible to rewrite the query to persuade the optimizer to parallelize the query, but that’s an article for another day.
Also notice the Table Spool operators. These are the worktables that you saw in the STATISTICS IO output. These are joined to the results using Nested Loops.
If you open the properties of the Index Scan operator (Figure 9), you’ll see that the storage is Rowstore, and the Actual Execution Mode is Row.
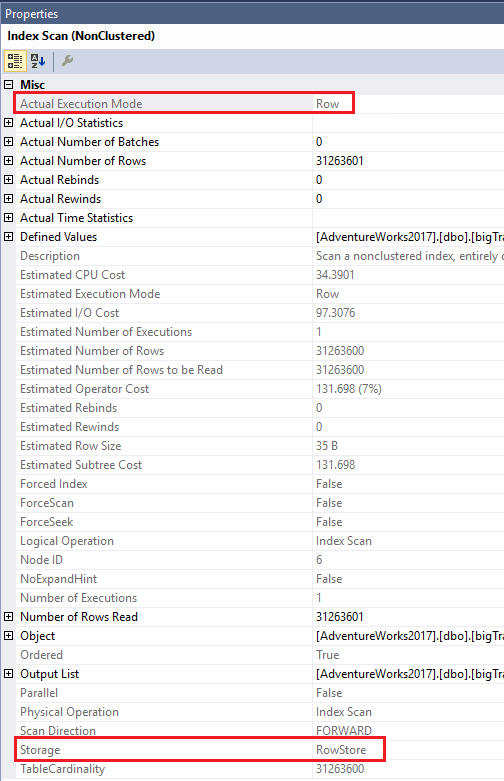
Figure 9: The properties showing Row mode
Now take a look at the execution plan in Figure 10 for the same query when in 2019 compatibility mode. Again, I have split it up to make it easier to read.
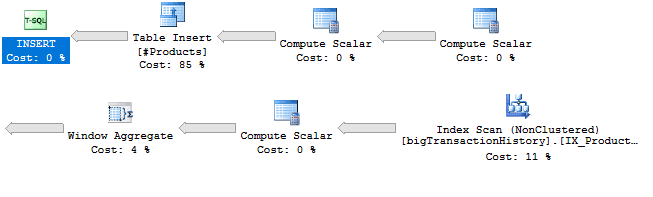
Figure 10: The plan used in 2019 compatibility mode
First, you will probably notice that this plan looks much simpler. There are no more worktables (Table Spools) and no need for the Nested Loops. There is also the new Window Aggregate operator. Hovering over the operator brings up the information shown in Figure 11.
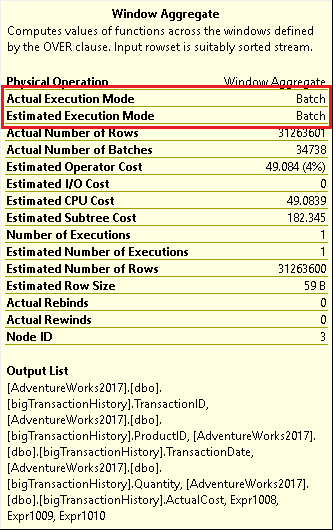
Figure 11: The Window Aggregate operator popup
You can see that batch mode was used. By looking at the properties of the Index Scan in Figure 12, you will see that batch mode was used even though the index is stored in rowstore and not in columnstore.
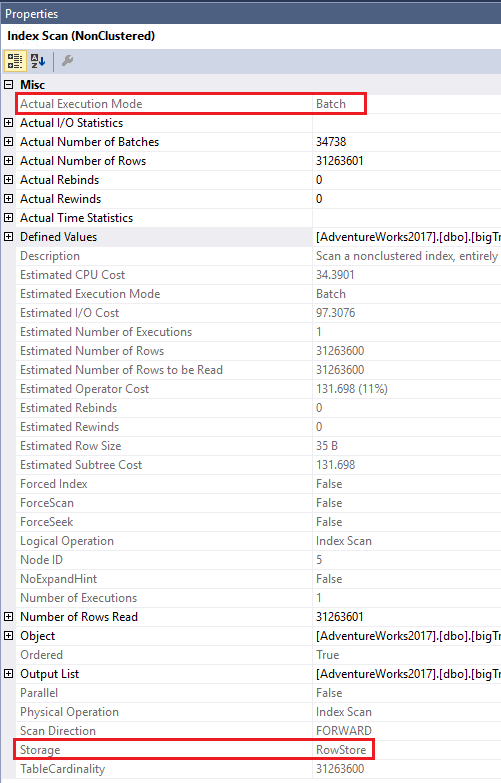
Figure 12: The Index Scan properties
As mentioned earlier, batch mode on rowstore is reserved for queries of a large size that include certain aspects such as sorting or aggregates. I wondered where the tipping point was for this query, so I decide to create a copy of the bigTransactionHistory with the same indexes, just a smaller number of random rows. I found that the tipping point was 131,072 rows for this query on this instance running in an Azure VM. It could be something entirely different for another situation.
If you are using a monitoring tool, such as Redgate’s SQL Monitor, you can see the performance history of your queries and whenever the execution plans change. Wouldn’t it be a nice surprise if a query suddenly started running 5 or 10 times more quickly as the data grew?
Conclusion
Many organizations are not going to upgrade every time there is a new version of SQL Server available. When they do upgrade, they often skip versions. The Big Data Clusters feature is getting a lot of publicity, but not every shop will need it. I think everyone is going to appreciate the new query optimizations. Batch mode on rowstore is just one of many great features that will improve performance by just upgrading to 2019 when it’s generally available.
FAQs: Window aggregates in SQL Server 2019
1. Why are window aggregate functions slow in SQL Server?
Window aggregate functions with ORDER BY in the OVER clause require SQL Server to maintain a running computation across sorted rows. Before SQL Server 2019, these operations used row mode processing – evaluating each row individually – which is CPU-intensive for large datasets. Accumulating aggregates (running totals) are particularly expensive because each row requires recalculating the aggregate from all preceding rows in the window frame.
2. How much does SQL Server 2019 improve window aggregate performance?
For accumulating aggregate queries (running totals using SUM with an ORDER BY in the OVER clause), SQL Server 2019 Batch Mode on Rowstore can improve elapsed time by 5–7× compared to SQL Server 2017 row mode processing on the same query and data. The improvement is most pronounced for large datasets and ORDER BY-based window frames. Non-accumulating window aggregates (without ORDER BY in OVER) see smaller improvements.
3. Does Batch Mode on Rowstore work for all window functions in SQL Server 2019?
Batch Mode on Rowstore improves aggregate window functions (SUM, AVG, MIN, MAX, COUNT with OVER). It does not apply to ranking functions (ROW_NUMBER, RANK, DENSE_RANK) or analytical functions (LAG, LEAD, FIRST_VALUE, LAST_VALUE) in the same way. The improvement is most significant for accumulating SUM queries (running totals) where the ORDER BY in the OVER clause forces sequential computation. Check your execution plan for Batch Hash Match operators to confirm batch mode is being used.
4. What is the difference between window functions and window aggregates in SQL Server?
Window functions is the umbrella term for all SQL functions that use an OVER clause. Window aggregates are the subset that applies aggregate operations – SUM, AVG, MIN, MAX, COUNT – within a window. Window ranking functions (ROW_NUMBER, RANK, DENSE_RANK) and window analytic functions (LAG, LEAD, NTILE) are also window functions but are not aggregates. SQL Server 2019’s Batch Mode on Rowstore performance improvement specifically targets the aggregate subset.


Load comments